Key Findings from the 2019 Schooling in America Survey
Americans’ satisfaction with K–12 education reached a 15-year high this year, according to Gallup. But do parents and teachers agree? Is there consensus among generations? Growing education reform efforts indicate there’s more under the surface.
Our 2019 Schooling in America Survey with Braun Research measures American attitudes toward big issues in K–12 education and digs deeper with parents, public school teachers, Millennials and Generation Z.
Here’s what we learned.
DIRECTION OF K–12 EDUCATION
Like Gallup, our poll also found the percentage of Americans who think K–12 education is headed in the right direction (37%) is at an all-time high, but a majority still thinks it’s on the wrong track (56%).
PUBLIC & PRIVATE SCHOOL COSTS
As in past years, most Americans (and this year, public school teachers) grossly underestimate how much public schools spend per student. (It’s $12,201 on average.) We also learned Americans are more likely to know how much private school tuition costs than they are to know what public schools cost. (The average K–12 private school tuition is $10,676.)
TESTING
There’s little support for increasing how much we test our kids, especially among teachers.
• 71% of the general population think the amount we test is “too much” or “about right”
• 72% of current school parents think the amount we test is “too much” or “about right”
• 88% of current public school teachers think the amount we test is “too much” or “about right”
SATISFACTION
Parents are likely to be satisfied with their kids’ current schools, but homeschooling families’ satisfaction appears to have dipped 10 percentage points in the past year.
• 79% of parents are satisfied with their current private school
• 77% of parents are satisfied with their current charter school
• 76% of parents are satisfied with home schooling currently
• 67% of parents are satisfied with their current public district school
The top reasons parents choose the schooling environments they’ve chosen appear to be all over the map, likely because it’s such a personal decision. A few top factors stood out for each school type.
• Public District Schools: the fact the school was assigned to them or because it’s close to home or work.
• Private Schools: academic reputation and safety
• Charter Schools: academic reputation, safety, one-on-one attention and location
• Home School: safety and one-on-one attention
Though most families send their kids to a public district school, most would prefer a different schooling option—even public school teachers who are parents.
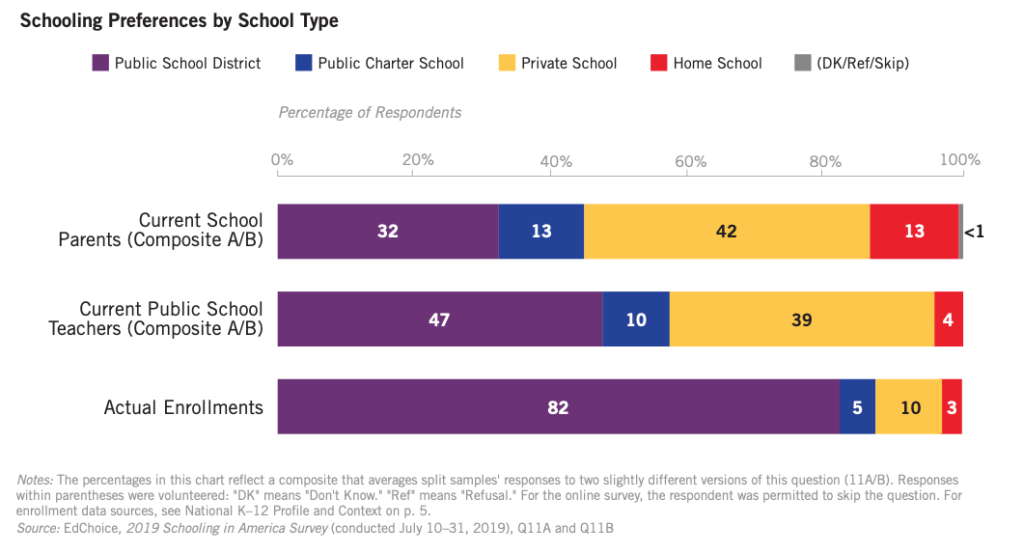
And parents’ preference for private schooling goes up to 45 percent when you remove cost and transportation barriers.
The top reasons Americans said they prefer the schooling types they prefer include:
• Public District Schools: the fact the school was assigned to them or because it’s close to home or work.
• Private Schools: academic reputation and safety
• Charter Schools: academic reputation, safety, one-on-one attention and location
• Home School: safety and one-on-one attention
EDUCATIONAL CHOICE
When you describe how education savings accounts (ESAs) help families not just afford private school but also customize an education for their kids—nearly everyone supports them.
• 85% of current school parents support ESAs
• 78% of current public school teachers support ESAs
• 77% of the general population supports ESAs
The top most important reasons people support ESAs: access to a better academic environment and more freedom and flexibility for parents.
The top most important reason people oppose ESAs: the perception that they take money away from public schools.
Parents are far more likely to say ESAs should be available to all families, not just those who qualify based on financial need.
Notably, ESAs were the most popular type of school choice for all generations, and the generations that include current school parents (Gen X and Millennials primarily) tend to show the strongest support.
Support for other types of school choice—charter schools, vouchers, tax-credit scholarships—also remains strong.
• 68% support tax-credit scholarships
• 64% support charter schools
• 63% support vouchers
TEACHERS
Public school teachers’ choices for their own kids look very similar to other parents’ choices, but their opinions start to diverge as you dig deeper. For instance, only 37 percent of public school teachers said they have “complete” or “a lot of” trust in their students’ parents.
The majority of teachers also oppose inter-district busing, which facilitates parents’ access to public school choice like open enrollment.
Teachers seem more likely to worry about their students’ use of technology than their parents are. Yet teachers are less likely than parents to take kids’ cell phones away as punishment. Parents are more likely than teachers to say they feel completely confident in their ability to teach kids how to engage appropriately online.
All in all, teachers are not very happy with a lot of aspects of their work. Public school teachers would not recommend their profession, compared to other public servants. Their net promoter score is -17 compared to state legislators, who have a score of +41, and to active-duty military, who have a score of +20.
No wonder we’ve seen an uptick in teacher walkouts. Teachers are more likely to blame state government for disruptions that happen during those walkouts, too. Current school parents and the general population are more likely to blame local school districts.
Most Americans support teacher walkouts. When you tell them the average teacher’s salary ($60,483), they’re less likely to support them. Teachers have the opposite reaction. When you tell them the average teacher’s salary, their support levels go up.
That’s all we have for today. But there’s much more to learn in our full 2019 Schooling in America report, including charts, tables, demographic breakouts and our exact questionnaire. Be sure to check it out and share with us what you think are the most interesting results.