Seven Survey Snapshots of Colorado’s K–12 Education Landscape
In spring of this year, the Colorado Supreme Court issued its opinion on the Douglas County school voucher program. Since then, proponents of the program have made headway in their journey to appeal the case to the Supreme Court of the United States.
But what do voters think about Colorado’s K–12 education issues in their state?
Today, we released the findings from our Colorado K–12 & School Choice Survey. The following six snapshots delve deeper into Colorado voters’ opinions—from their K–12 schooling preferences to which policies they think might improve the state’s education system.
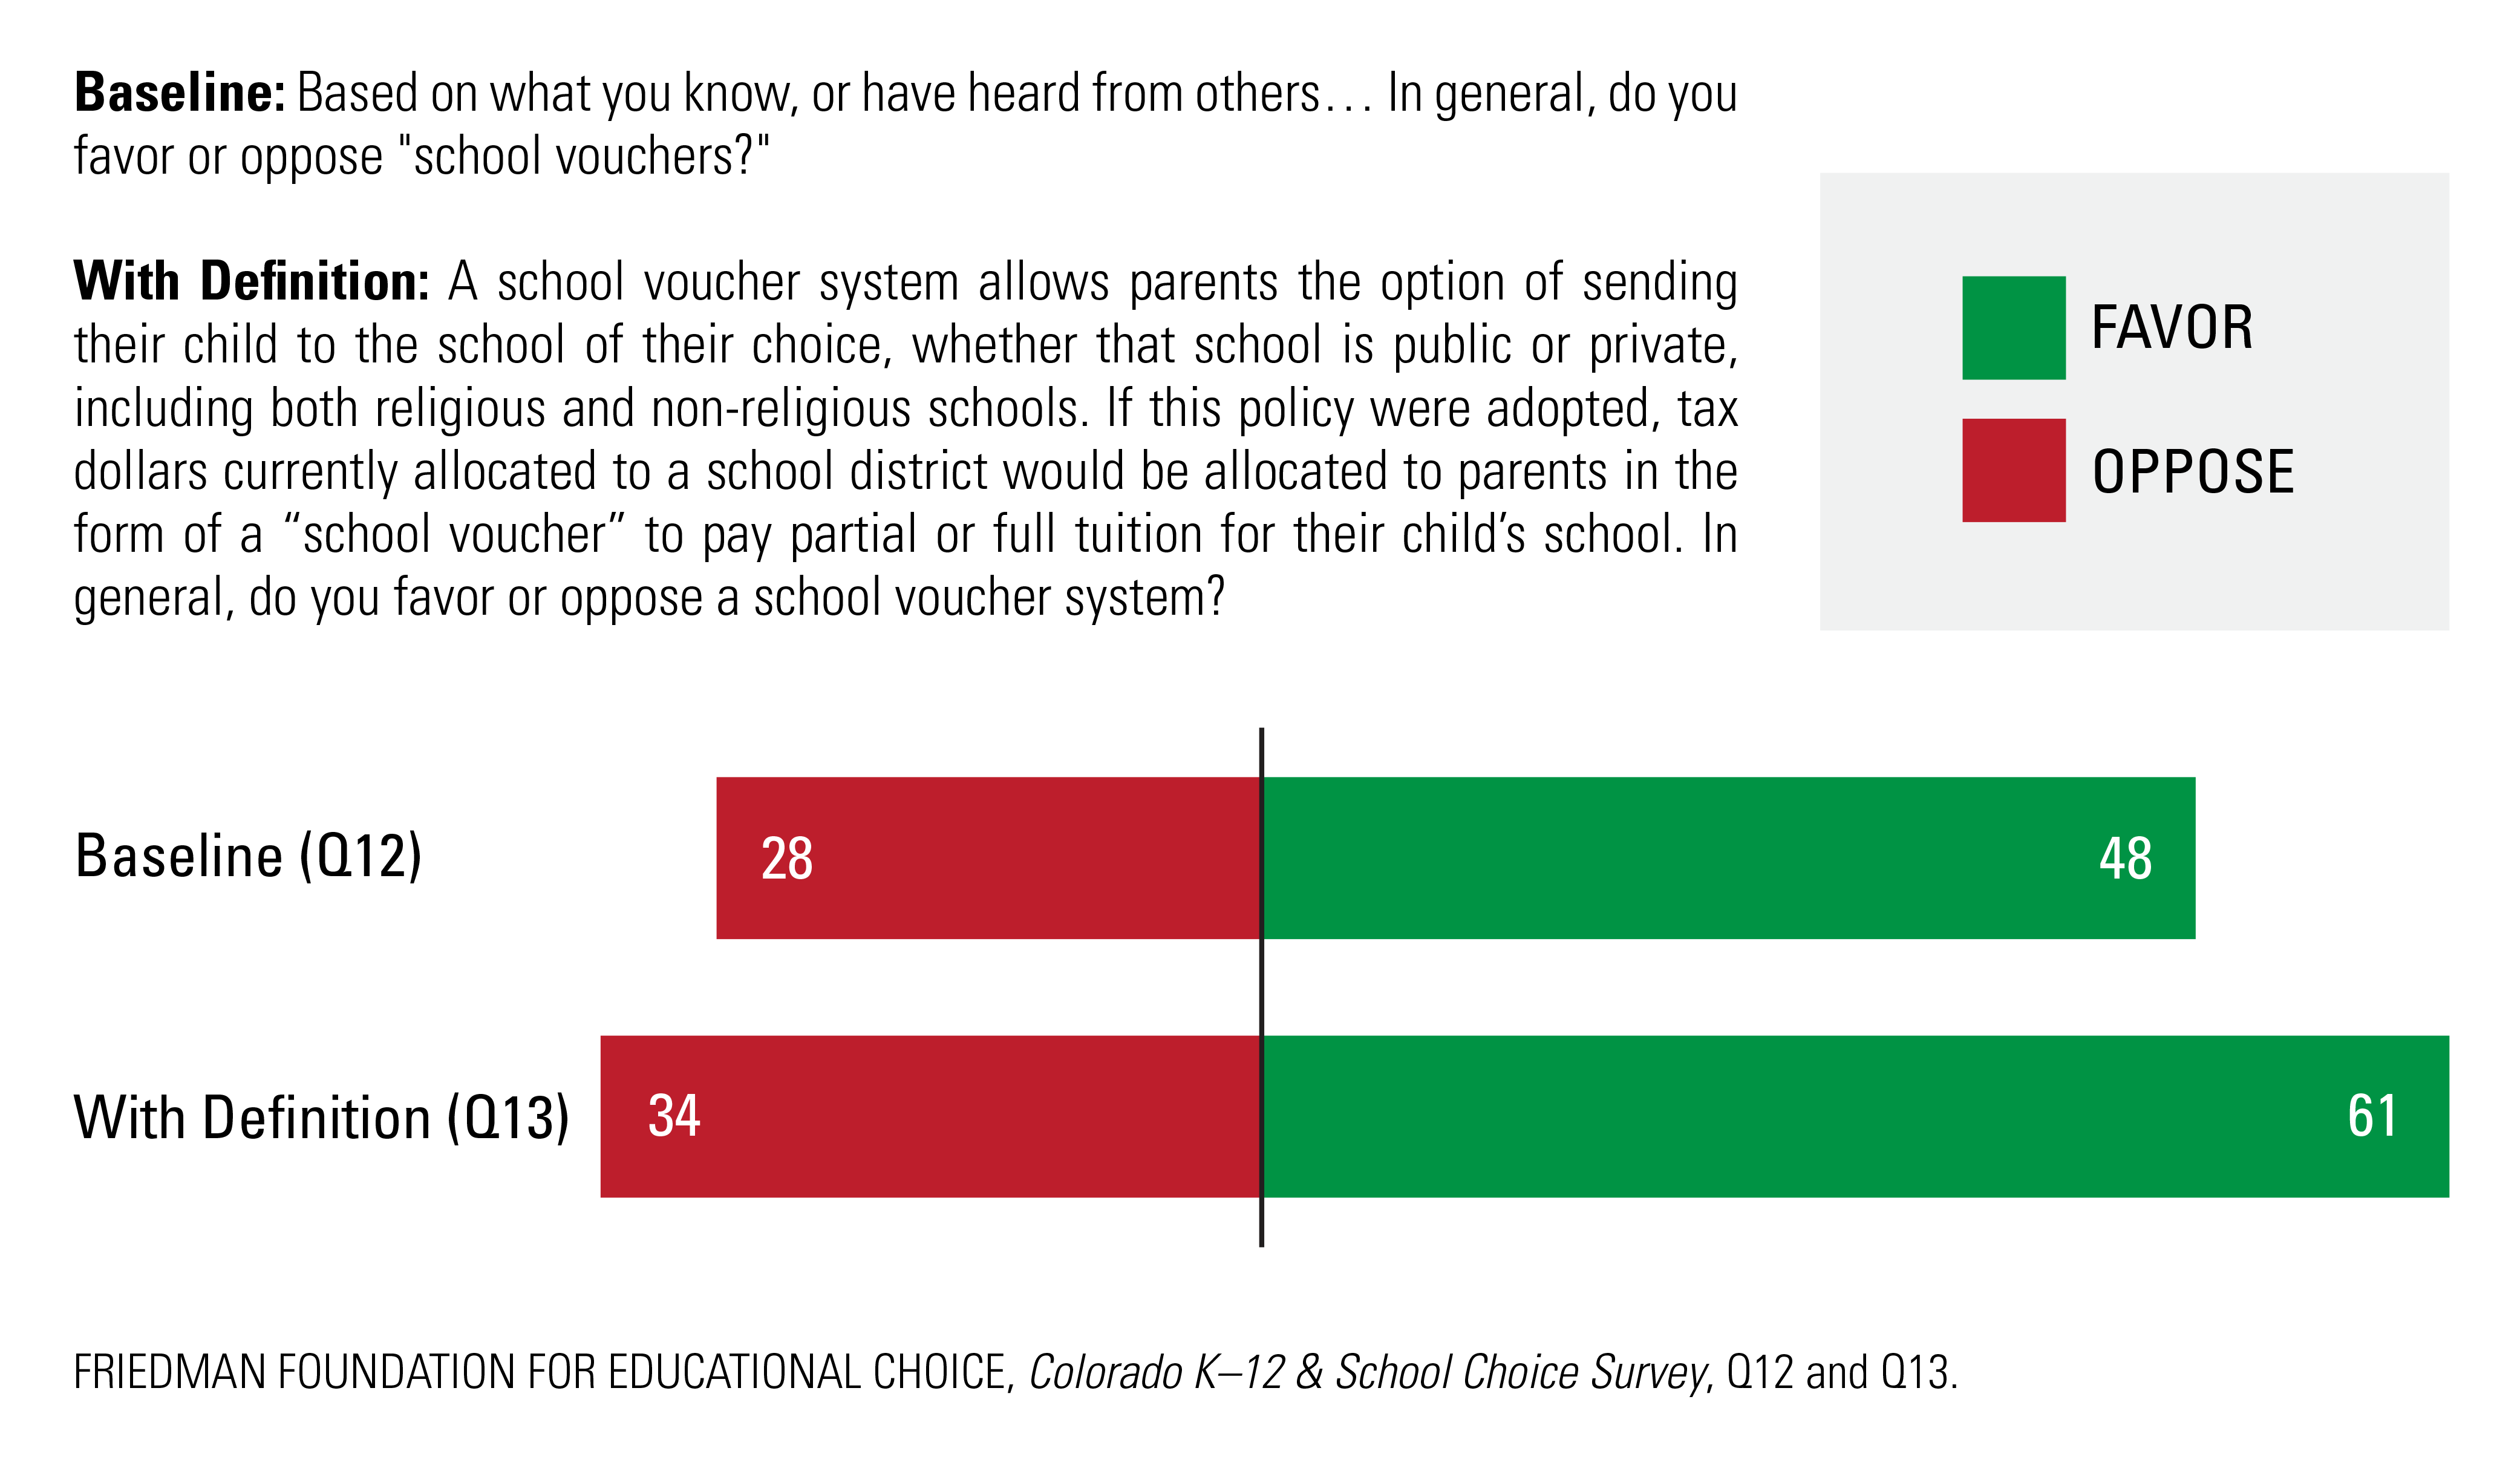
A majority of Coloradans say they would support a state-created “school voucher system,” a concept that is a close cousin to the actual district-created school voucher program in Douglas County. Both types of voucher programs are based on parental choice and decision-making.
When survey respondents are given a definition school vouchers, roughly six out of 10 (61%) say they favor that kind of choice-based policy, compared with 34 percent who said they oppose school vouchers.
The margin of support (+27 points) is nearly seven times as large as the survey’s margin of error. Respondents were more likely to express an intensely favorable view toward vouchers (38% “strongly favor” vs. 24% “strongly oppose”). Without a definition or any other context, 48 percent say they support school vouchers, while 28 percent oppose.
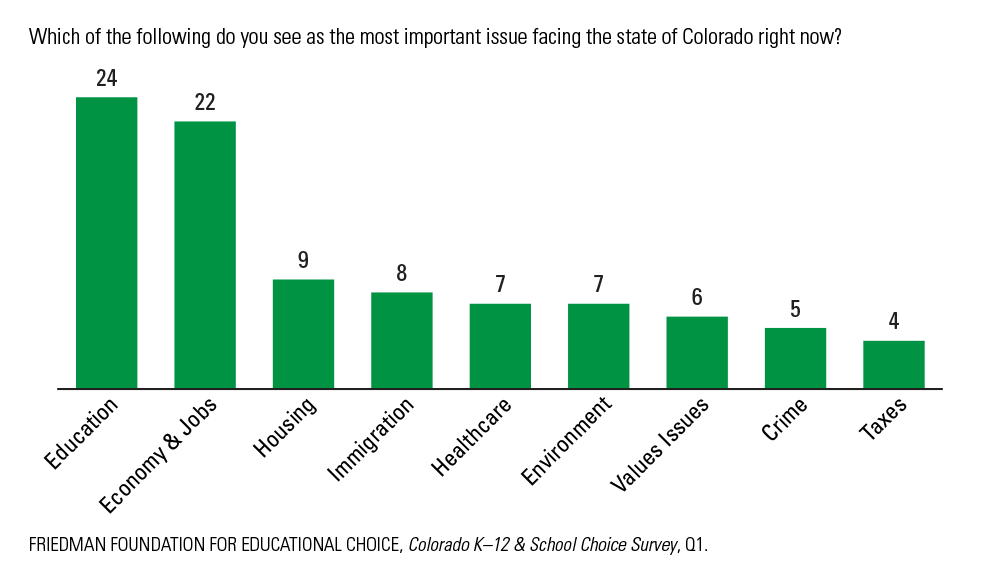
Education is the highest priority for Colorado voters right now. They are more likely to say Colorado’s K–12 education is “the most important issue facing the state” than any other issue.
Nearly one out of four respondents (24%) said “education” was the most important issue facing the state of Colorado right now. That response was in a statistical tie with “economy and jobs” (22%) as a first priority. Certain demographic subgroups significantly differ from one another when saying education is a top priority:
- School parents (31%) are more likely to say education is a priority than non-schoolers (21%).
- Higher proportions of Democrats (31%) and Independents (30%) are focused on education than Republicans (14%).
- More young adults (31%) put education at the top of their agenda, compared with seniors (17%).
- Low-income earners (31%) and high-income earners (26%) are more likely to indicate education is a top priority than middle-income earners (16%).
Coloradans are much more likely to think K–12 education has gotten off on the “wrong track” (54%) compared with about one-third of adults (35%) who say it is heading in the “right direction.”
The gap between those responses (-19 points) is more than four times the margin of error for the statewide sample. We observe negative attitudes about the direction of K–12 education across nearly every demographic. Nearly all subgroup margins are negative and wider than -10 percentage points. However, some key differences stand out when making comparisons within certain demographic categories or comparing a subgroup to the statewide average:
- Two subgroups are significantly less likely to say “wrong track” than the statewide average: Democrats (47%) and young voters (44%).
- Republicans (61%) are more likely to say “wrong track” than Democrats and the statewide average.
In Colorado, huge gaps exist between personal school preferences and actual school enrollments.
When asked for a preferred school type, a plurality of Coloradans chose a private school (36%) as a first option for their child. Slightly less than one-third of respondents (31%) would select a regular public school. Nearly one-quarter of respondents said they would select a public charter school (23%). Nearly one out of 10 would opt to homeschool their child (9%). Those private preferences signal a glaring disconnect with actual school enrollment patterns in Colorado.
The reality check is profound.
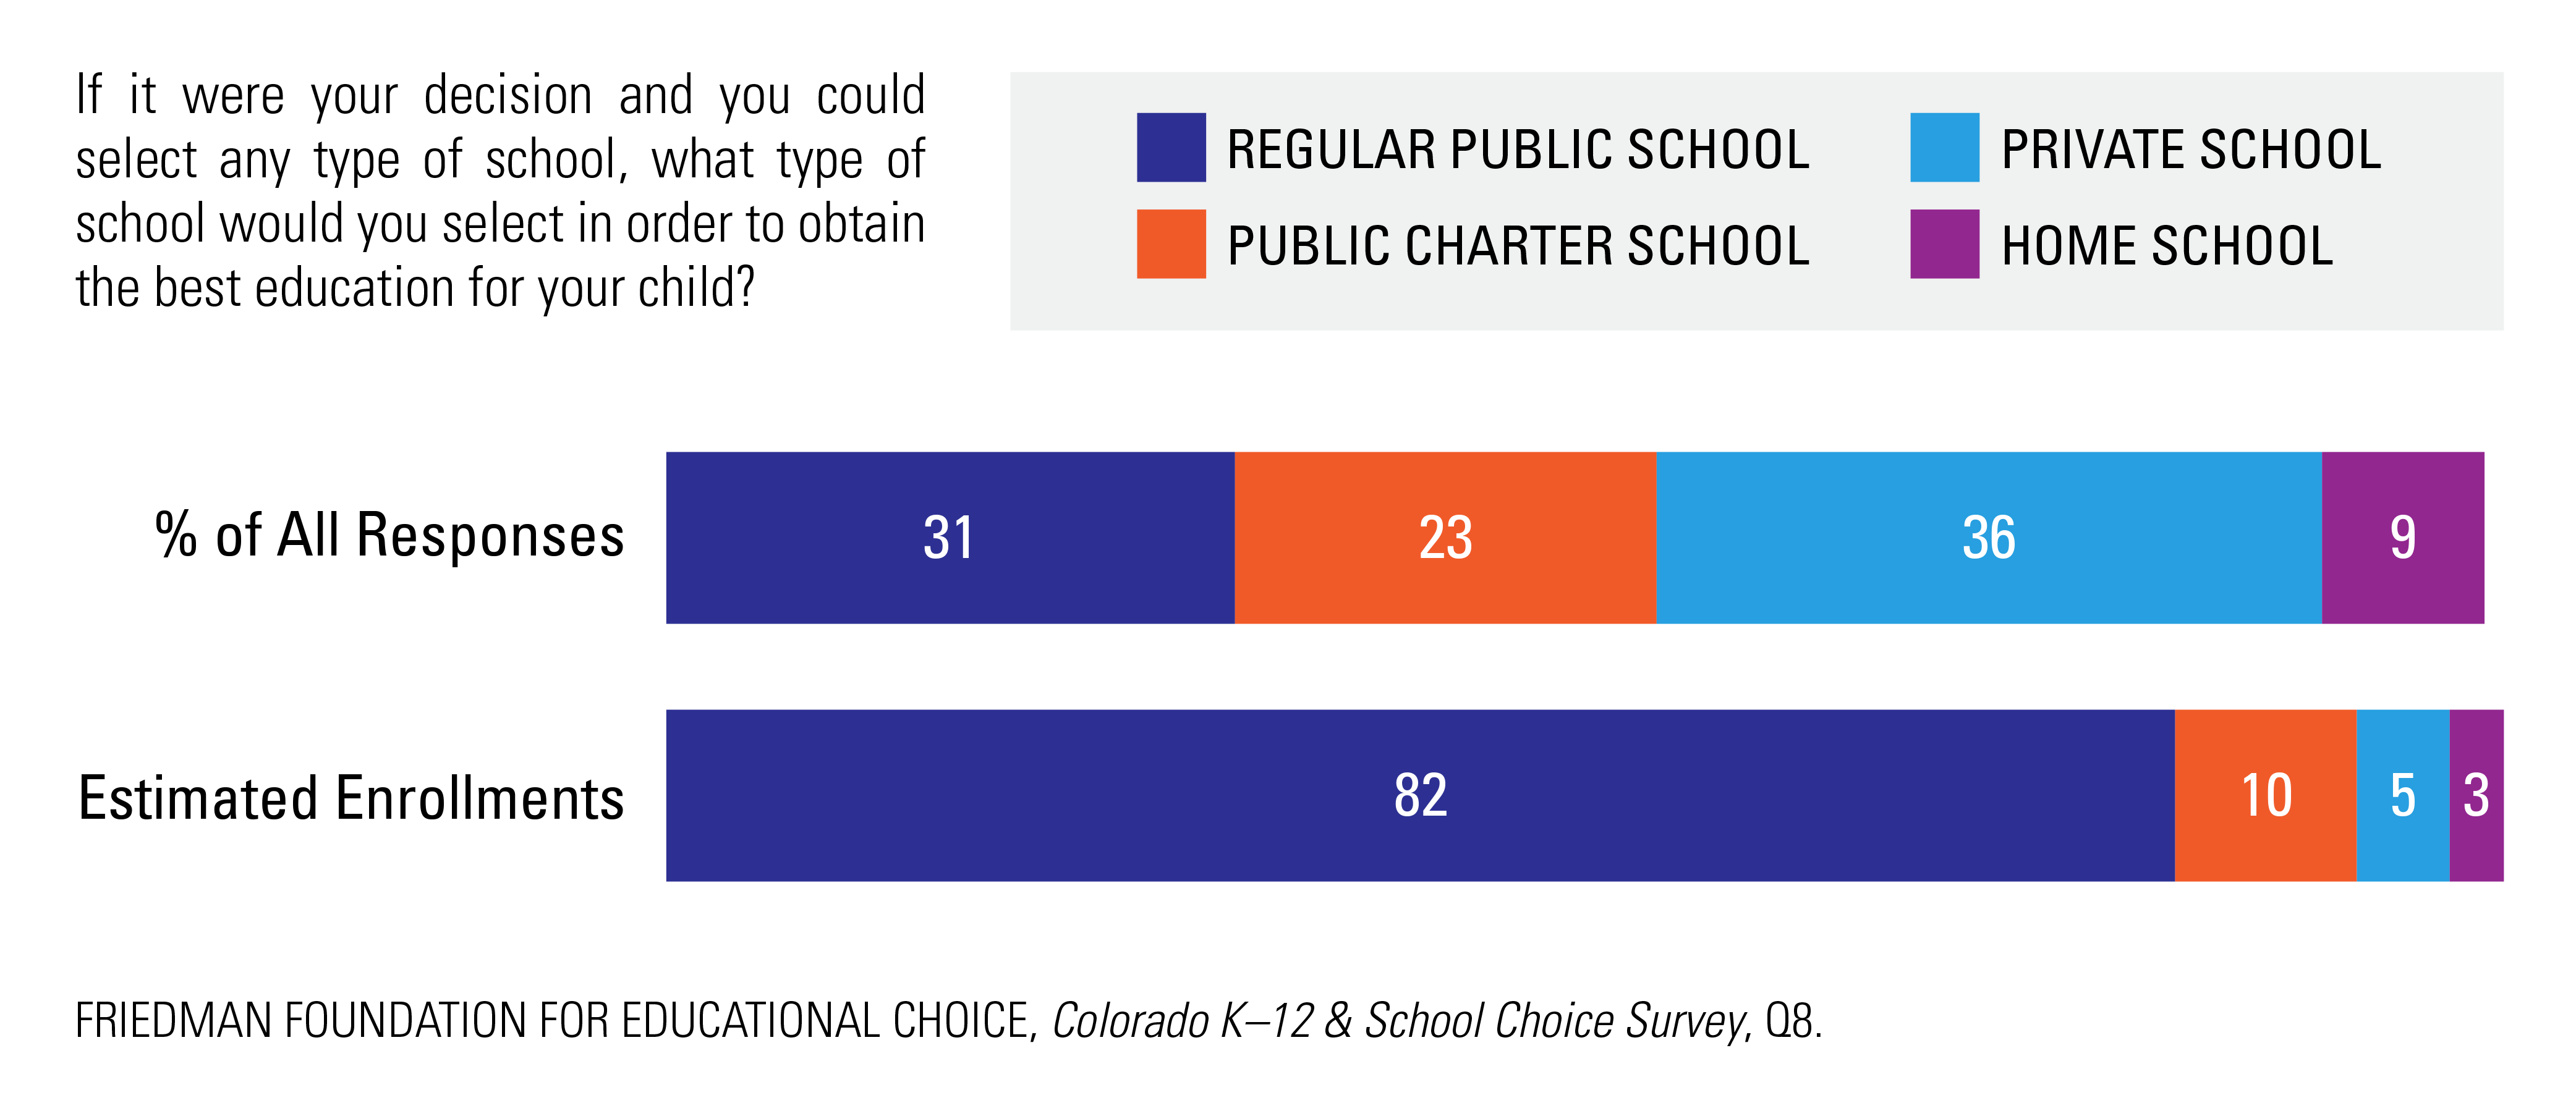
By contrast about 82 percent of K–12 students attend public schools in Colorado. Approximately 10 percent of students currently go to public charter schools. Only about 5 percent of students enroll in private schools. Using estimates produced by Ann Zeise, a long-time home school observer, I estimate that just under 3 percent of the state’s students are homeschooled.
In a follow-up question, more respondents in our survey prioritized “better education/quality” (17%) than any other coded response to explain why they selected a certain school type. Other school attributes cited as important include “academics/curriculum” (14%), “better teachers/teachers/teaching” (9%), and “individual attention/one-on-one” (9%).
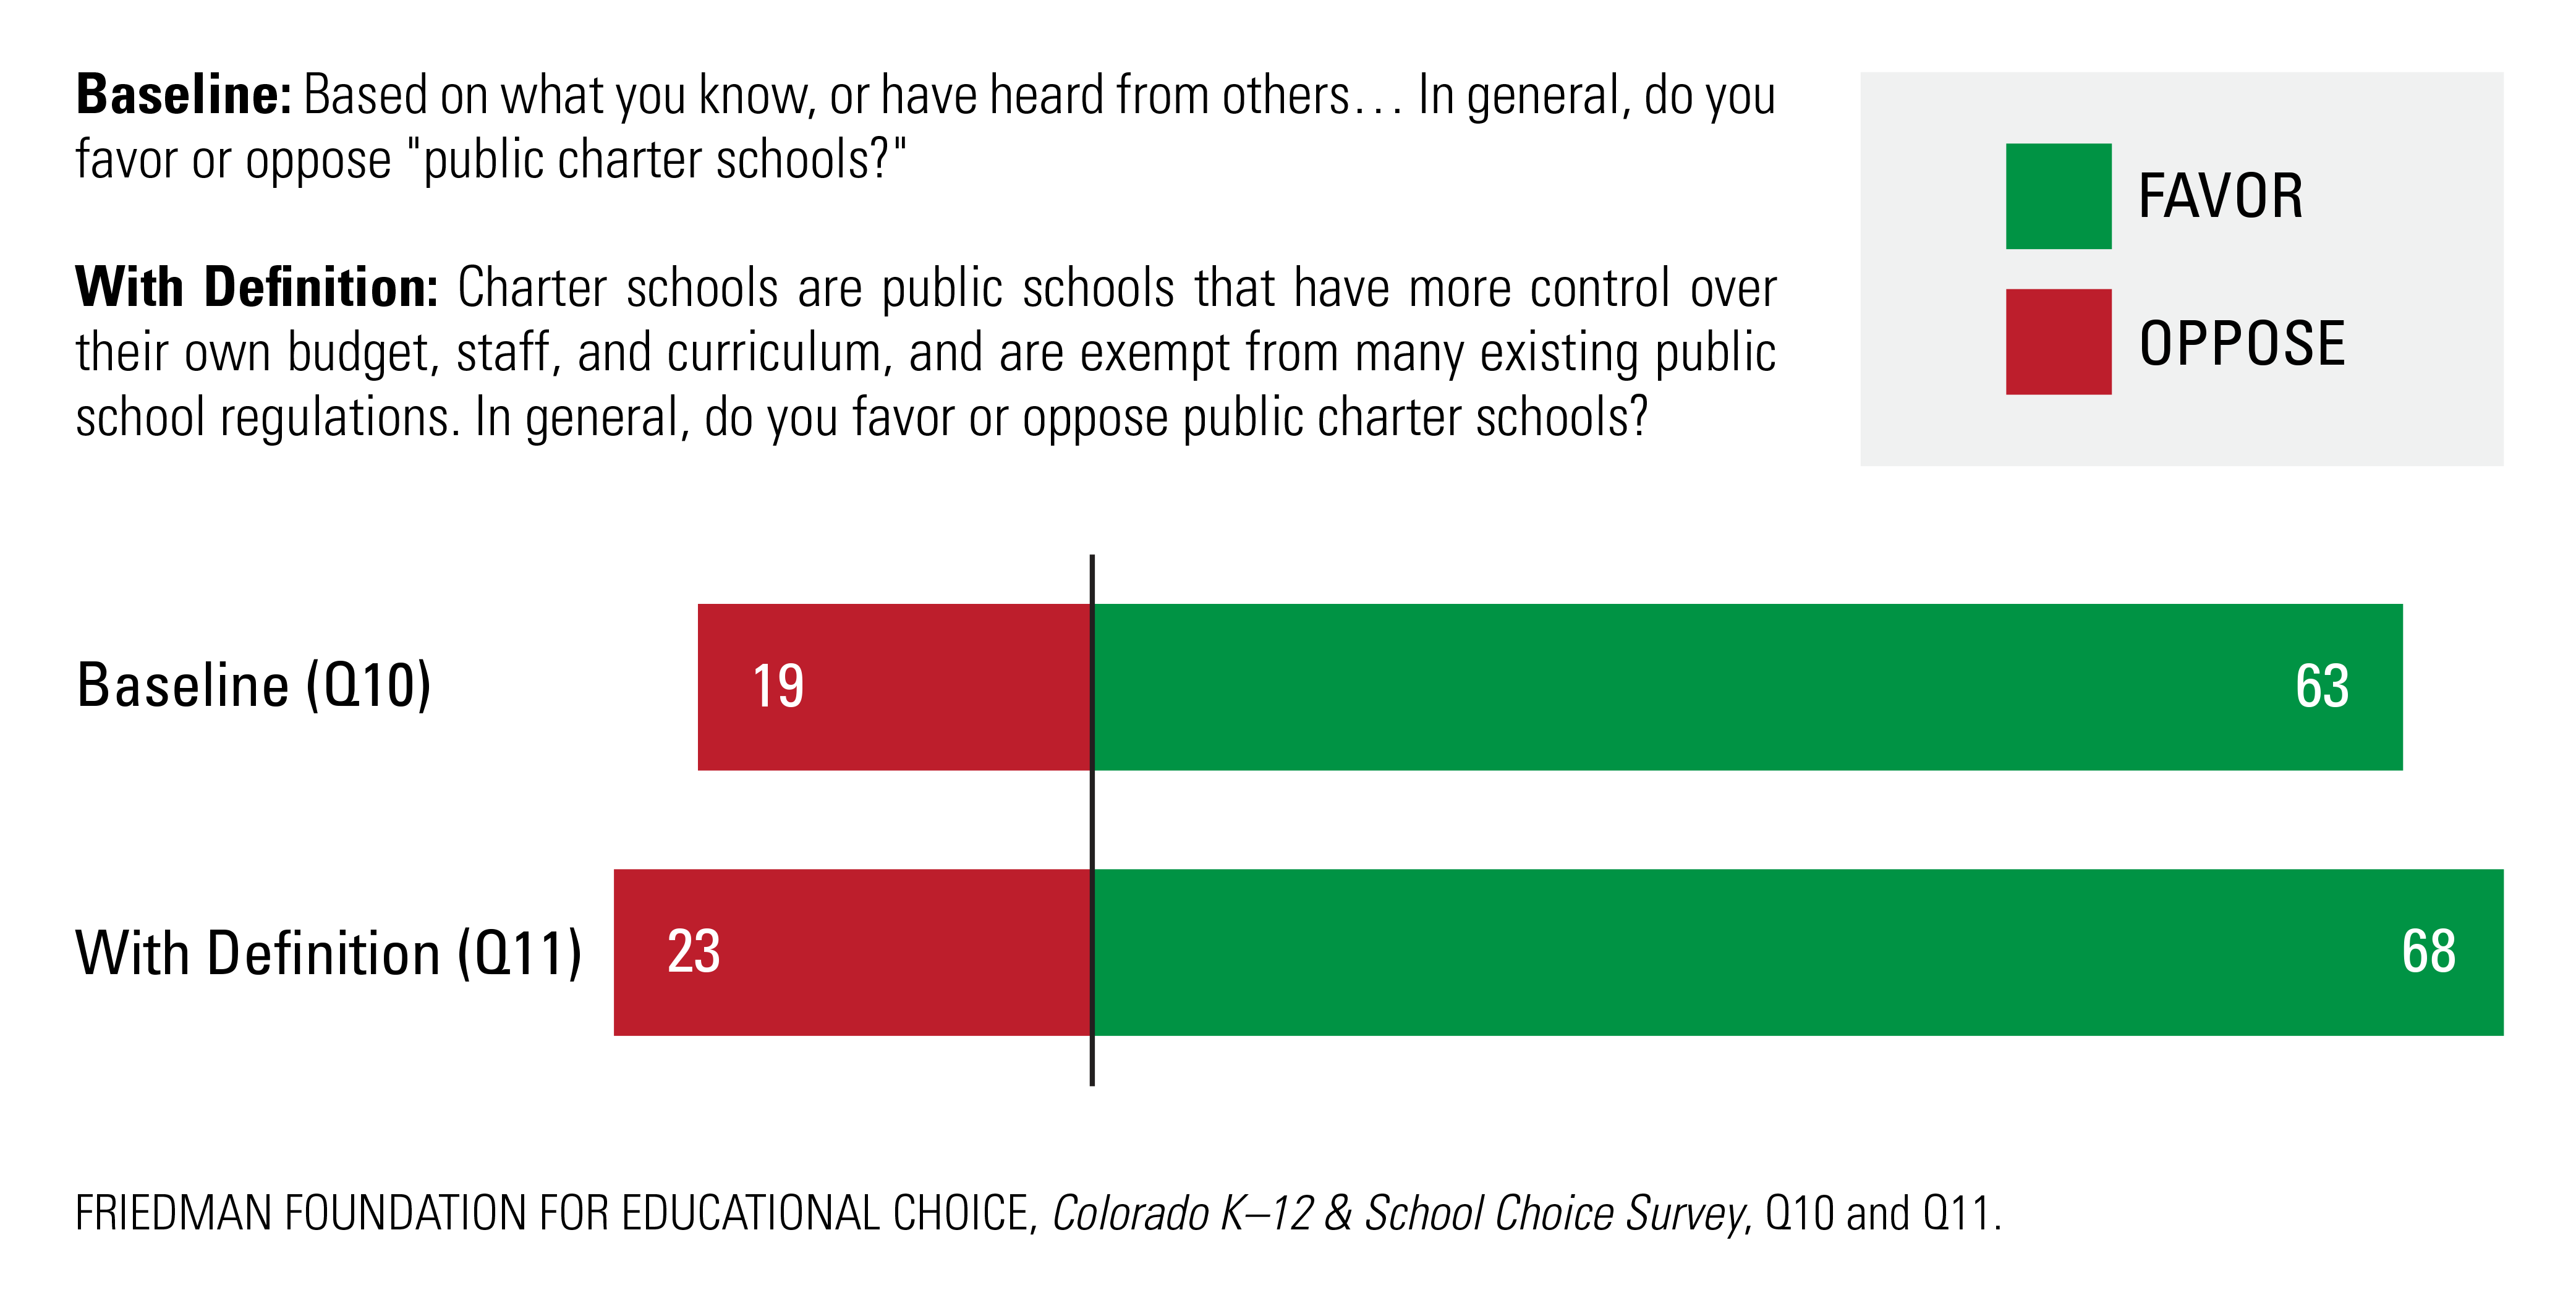
Colorado voters overwhelmingly support public charter schools.
Nearly seven out of 10 (68%) said they favor charter schools, whereas 23 percent of respondents said they oppose charters. The margin of support for charter schools is large (+45 points). Coloradans are almost three times as likely to express intensely positive responses toward charters (32% “strongly favor” vs. 12% “strongly oppose”).
We asked a pair of questions about public charter schools. The first question inquired about an opinion without offering any definition. On this baseline question, 63 percent of respondents said they favored charters and 19 percent said they opposed them. In the follow-up question, respondents were given a definition for a charter school. With this information, support increased five points to 68 percent, and opposition increased four points to 23 percent.
Six out of 10 Coloradans (60%) say they support an education savings account (ESA) system.
The margin of support is large (+29 points) and less one-third of respondents (31%) said they oppose ESAs. Respondents were almost twice as likely to express an intensely favorable view toward ESAs (31% “strongly favor” vs. 17% “strongly oppose”).
All observed demographics are supportive of ESAs. Subgroup margins are greater than +20 percentage points with only a few exceptions. The largest margins are among: young adults (+60 points), small-town voters (+53 points), Republicans (+43 points), and low-income earners (+40 points). By far, the smallest margins are among Democrats (+3 points) and seniors (+8 points).
We asked,
“An education savings account—often called an ESA—allows parents to take their child out of a public district or charter school, and receive a payment into a government-authorized savings account with restricted, but multiple uses. Parents can then use these funds to pay for private school tuition, including both religious and non-religious schools. ESA funds may also be used for tutoring, online education programs, special needs therapies, or save for future college expenses. In general, do you favor or oppose this kind of ‘savings account system?”
| All Respondents | |||
| Denver Metro | |||
| School Parent | |||
| Non-Schooler | |||
| Community | |||
| Urban | |||
| Suburban | |||
| Small Town | |||
| Rural | |||
| Party ID | |||
| Democrat | |||
| Republican | |||
| Independent | |||
| Age Group | |||
| 18 to 34 | |||
| 35 to 54 | |||
| 55 & Over | |||
| Household Income | |||
| Under $40,000 | |||
| $40,000 to $79,999 | |||
| $80,000 & Over |
We learned the most common reasons for supporting ESAs are “more freedom and flexibility for parents” (37%) and “access to schools having better academic outcomes” (29%). We also asked a similar follow-up to those respondents opposed to ESAs. By far the most common reason for opposing this policy is the belief they “divert funding away from public schools” (56%).
Coloradans are more likely to support a tax-credit scholarship system than they are to oppose one.
A majority of respondents (54%) said they supported the reform, whereas 36 percent said they oppose tax-credit scholarships. The margin is +18 percentage points. Voters are about equally as likely to express either an intensely positive or negative response (20% “strongly favor” vs. 18% “strongly oppose”).
Observed subgroup margins vary in the positive direction with only two exceptions. The largest positive margins are among: young voters (+43 points), Republicans (+39 points), low-income earners (+29 points), school parents (+28 points) middle-age voters (+27 points), and small-town voters (+26 points). Democrats (-5 points) and seniors (-5 points) both showed negative margins on this question.
We asked,
“A tax credit allows an individual or business to reduce the final amount of a tax owed to government. Some states give tax credits to individuals and businesses if they donate money to nonprofit organizations that distribute private school scholarships. In a ‘tax-credit scholarship system,’ those nonprofit scholarship organizations allow parents the option of sending their child to the private school of their choice, including both religious and non-religious schools. In general, do you favor or oppose a tax-credit scholarship system?”
| All Respondents | |||
| Denver Metro | |||
| School Parent | |||
| Non-Schooler | |||
| Community | |||
| Urban | |||
| Suburban | |||
| Small Town | |||
| Rural | |||
| Party ID | |||
| Democrat | |||
| Republican | |||
| Independent | |||
| Age Group | |||
| 18 to 34 | |||
| 35 to 54 | |||
| 55 & Over | |||
| Household Income | |||
| Under $40,000 | |||
| $40,000 to $79,999 | |||
| $80,000 & Over |
In follow-up questions, we learned the most common reasons for supporting tax-credit scholarships are “access to schools having better academic outcomes” (38%) and “more freedom and flexibility for parents” (32%)—reflecting a reversal of the ordering of the top two reasons Colorado voters support ESAs. We also asked about reasons for opposition to tax-credit scholarships. Just like the negative reactions toward ESAs, by far the most common reason for opposing tax-credit scholarships is the idea that the policy will “divert funding away from public schools” (47%).
For more from the full report, click the Colorado K–12 & School Choice Survey below.
To stay up to date on the latest and to browse more of our school choice research, visit our Research library.