Six Survey Snapshots of Nevada’s Education Landscape
At the start of the year, an internal “poll” among staff at the Friedman Foundation named Nevada the state most likely to succeed in creating its first school choice program. In fact, a bill that would create a tax-credit scholarship program is making its way through the state legislature right now.
But what does Nevada’s education landscape look like, and what do voters think of K–12 education and school choice?
Today, we released the findings from our “Nevada K-12 & School Choice Survey.” Here are six key snapshots that provide some answers:
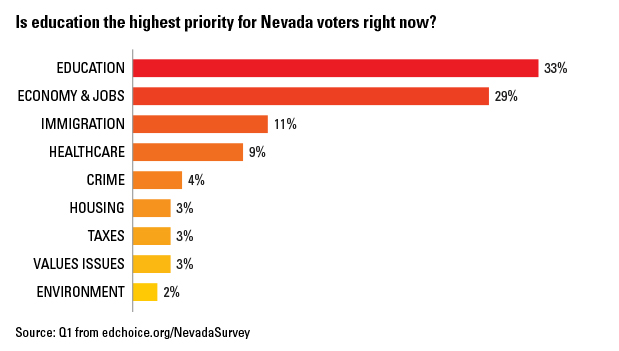
1. Education is the highest priority for Nevada voters right now. They are more likely to say education is “the most important issue facing the state” than other states where we have previously polled this question.
It is rare for our state polls to reveal education as the top priority issue for voters, but this is indeed what we observed in Nevada. One out of three respondents (33 percent) said “education” was the most important issue facing the state, edging out “economy and jobs,” which is typically ranked the top issue in states. Proportions of voters who pointed to other high-profile issues—such as “immigration” and “healthcare”—pale in comparison to those who chose education.
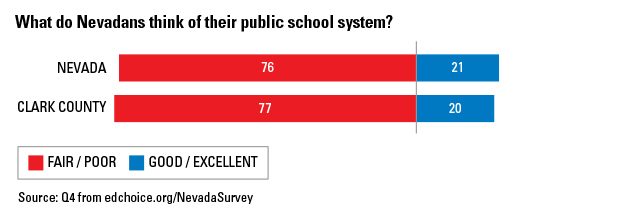
2. A very large proportion of Nevadans have a sharply negative view of the state’s public school system. More than three out of four Nevada voters (76 percent) described the system as “fair” or “poor.”
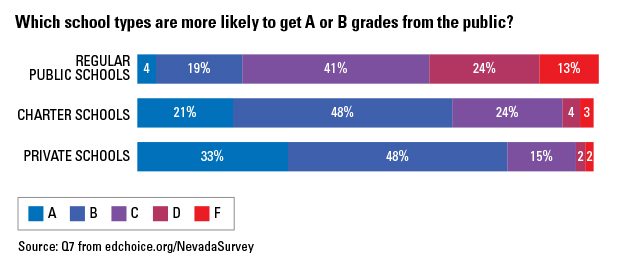
3. Nevada voters are much more likely to give A or B grades to private and parochial schools in their communities than they are in their local public schools.
When examining only those responses giving grades to different school types in their communities, we saw approximately 23 percent of voters give an A or B to local public schools, whereas 81 percent give an A or B to local private/parochial schools. Only 4 percent of voters give a D or F grade to private schools, and 36 percent assigned similar low grades to public schools. It is important to note that the proportions of voters who chose not to express a view for private schools (29 percent) or charter schools (31 percent) was much higher than the proportion of voters who did not grade public schools (4 percent).
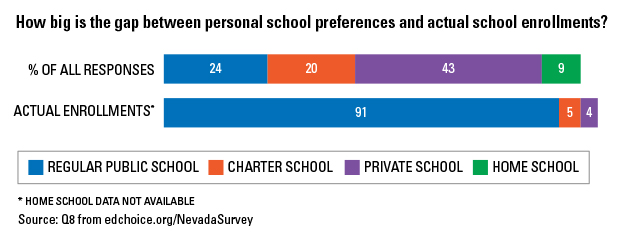
4. Severe gaps exist between personal school preferences and actual school enrollments in Nevada.
When asked for a preferred school type, a plurality of voters said they would choose a private school (43 percent) as a first option. Almost one out of four voters (24 percent) would prefer to send their child to a district public school; one out of five would opt for a public charter school (20 percent); and nearly one out of 10 respondents said they would like to homeschool (9 percent). Those preferences stand in stark contrast with the actual enrollments we see in Nevada schools, where 91 percent of children attend district public schools.
5. In a follow-up to the previous item, more respondents in our survey prioritized “better education/quality” (17 percent) than any other coded response to explain why they selected a certain school type.
Other school attributes cited as important include “individual attention/one-on-one” (12 percent) and “teachers/teaching/better teachers” (10 percent). The following are the most frequently mentioned reasons for choosing a specific school type:
Public District School (N = 136)
26 percent Socialization/Peers/Other Kids
12 percent Diversity/Variety
8 percent Teachers/Teaching/Better Teachers
Private School (N = 269)
25 percent Better Education/Quality
13 percent Individual Attention/One-on-One
12 percent Class Size/Student-Teacher Ratio
Public Charter School (N = 121)
19 percent Class Size/Student-Teacher Ratio
18 percent Individual Attention/One-on-One
15 percent Teachers/Teaching/Better Teachers
Home School (N = 53)
13 percent Individual Attention/One-on-One
12 percent Better Education/Quality
10 percent Someone I Know/I Attend or Work There
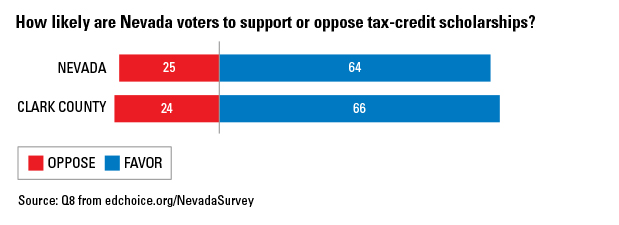
6. Nevada voters are more than twice as likely to support a tax-credit scholarship program than they are to oppose one.
The percentage of those who favor tax-credit scholarships (64 percent) is much larger than the proportion of voters who say they oppose such a school choice reform (25 percent). The margin is +39 percentage points. Likewise, voters are more likely to signal intense positive responses toward tax-credit scholarships (29 percent “strongly favor” vs. 13 percent “strongly oppose”).