Survey Finds Parents More Hopeful, Satisfied Than Those Without Children
As the end of another school year approaches, parents of school-aged children report higher satisfaction with their family relationships and general wellbeing and are more likely to be hopeful about the future than those without children, according to a new, national survey by EdChoice.
In partnership with Morning Consult, EdChoice surveyed a nationally representative sample of American adults 18 and older (N=2,139) from April 17-20, 2023. With additional sampling, we obtained responses from 1,154 parents of children currently in K-12 education.
We included several new questions about wellbeing and happiness, and they reveal interesting findings related to life satisfaction. The survey also explored opinions on school safety, measuring changes in attitudes since the recent school shooting in Nashville. Access the full report here.
Here are some of the key takeaways:
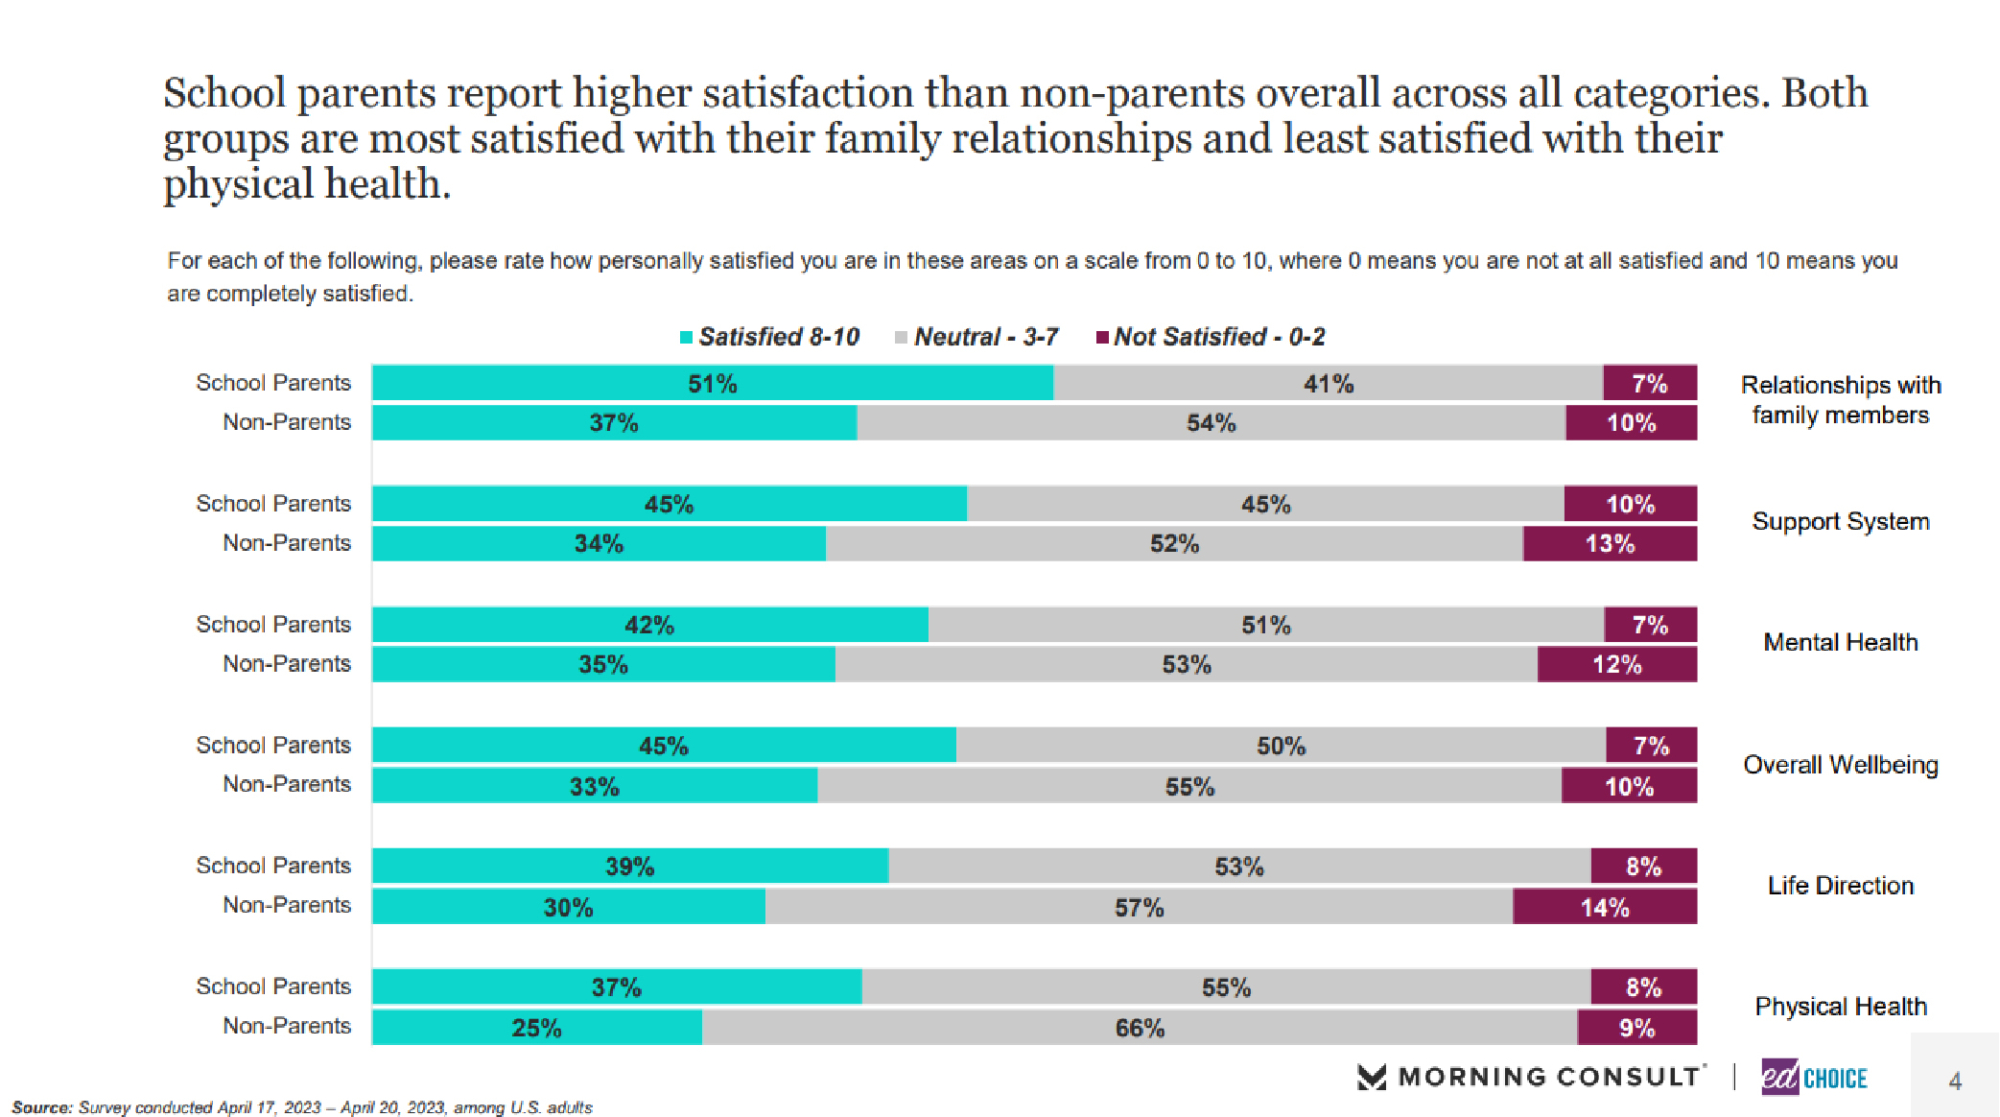
1. School parents report higher satisfaction with their family relationships and general wellbeing than nonparents. We asked respondents to rate their personal satisfaction level for each of the following areas: family relationships, support system, mental and physical health, overall wellbeing, life direction. Parents reported higher satisfaction levels in each area compared to nonparents. Parents and nonparents were aligned in that they are most satisfied with their family relationships and least satisfied with their physical health. Parents were much more satisfied than nonparents when it came to family relationships (+14), overall wellbeing (+12), and physical health (+12).
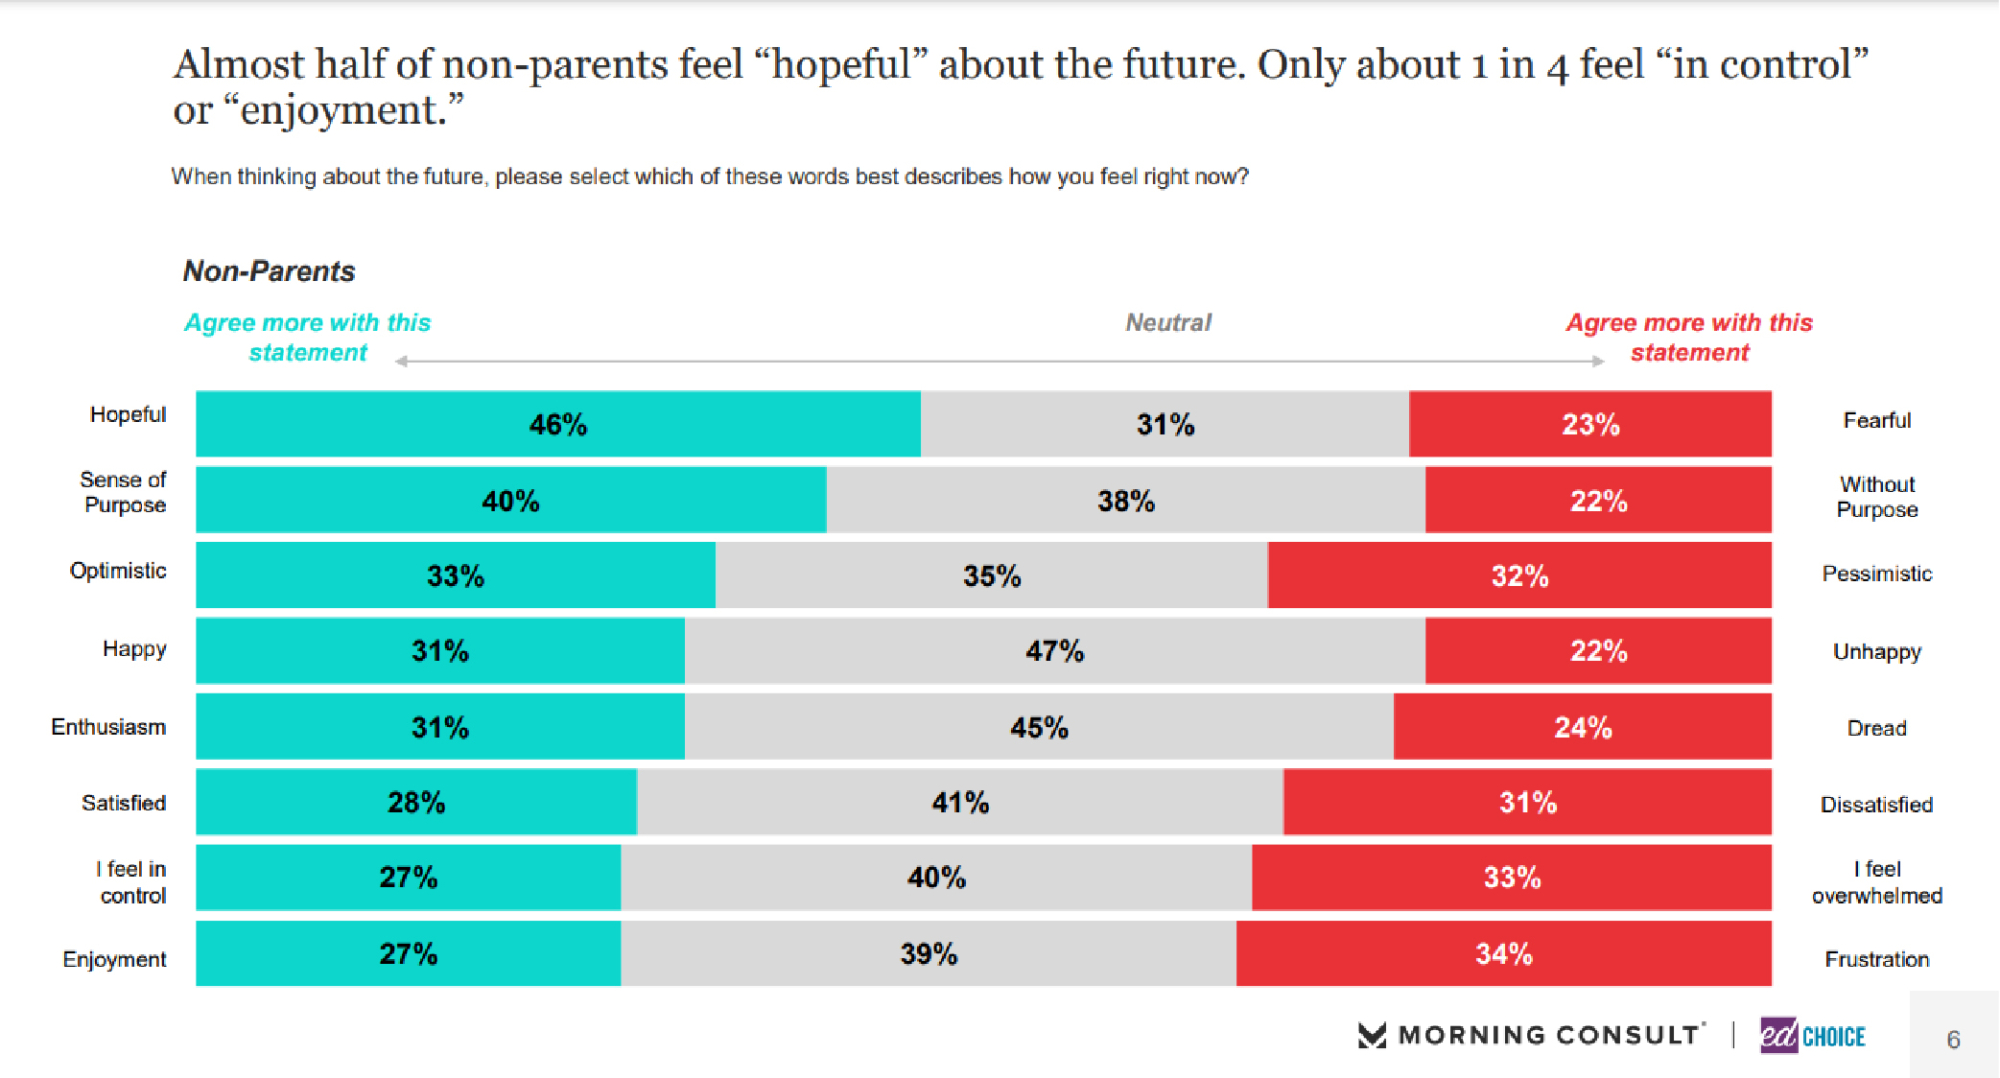
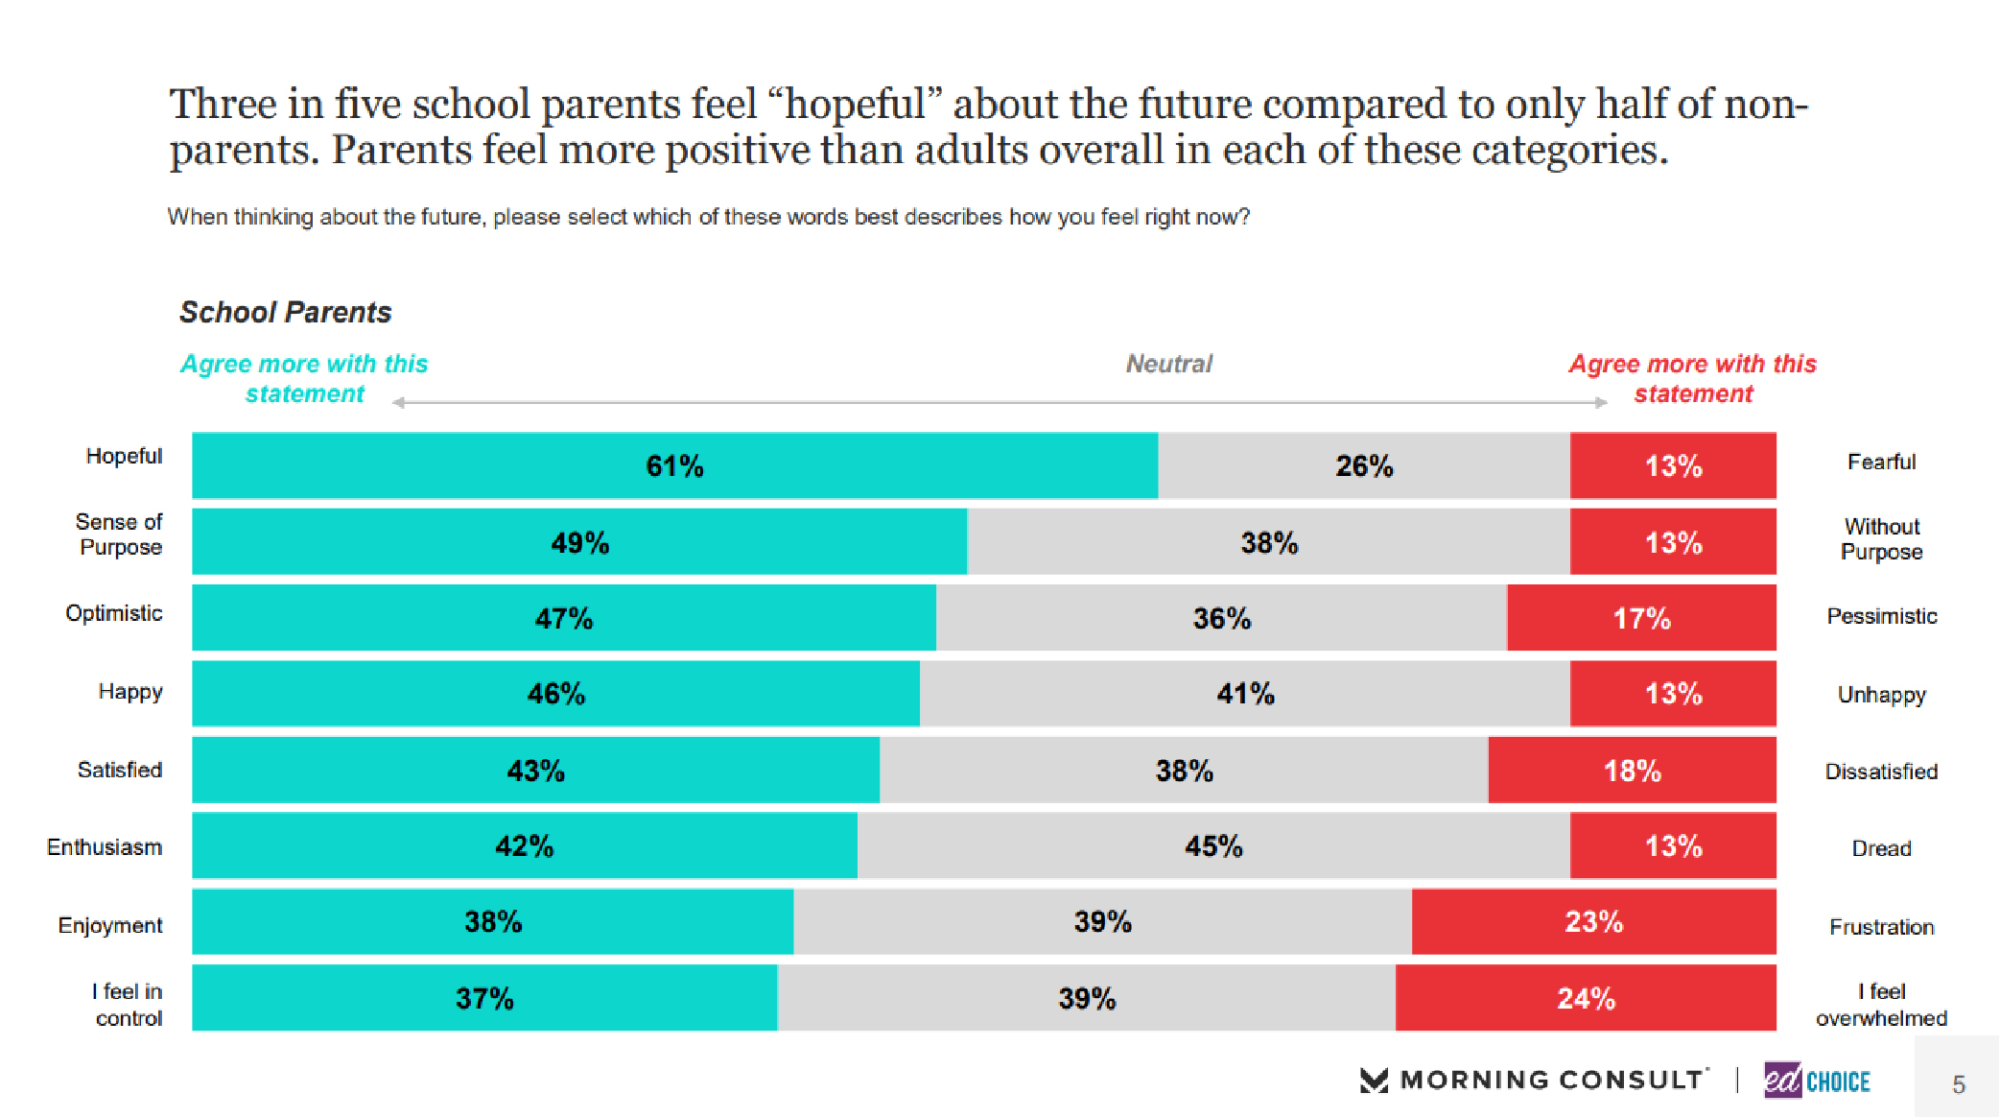
Parents are also much more likely to feel hopeful, happy, and satisfied when thinking about the future. We provided parents and nonparents with a list of descriptive words to see how each group felt about the future. Parents report feeling hopeful (61%), happy (46%), and satisfied (43%) when thinking about the future. Nonparents are much less likely than parents to feel hopeful (46%), happy (31%), and satisfied (28%) when thinking about the future. Additionally, roughly one in three nonparents report feeling frustrated and overwhelmed when thinking about the future. Only about one in five parents hold those feelings about the future.
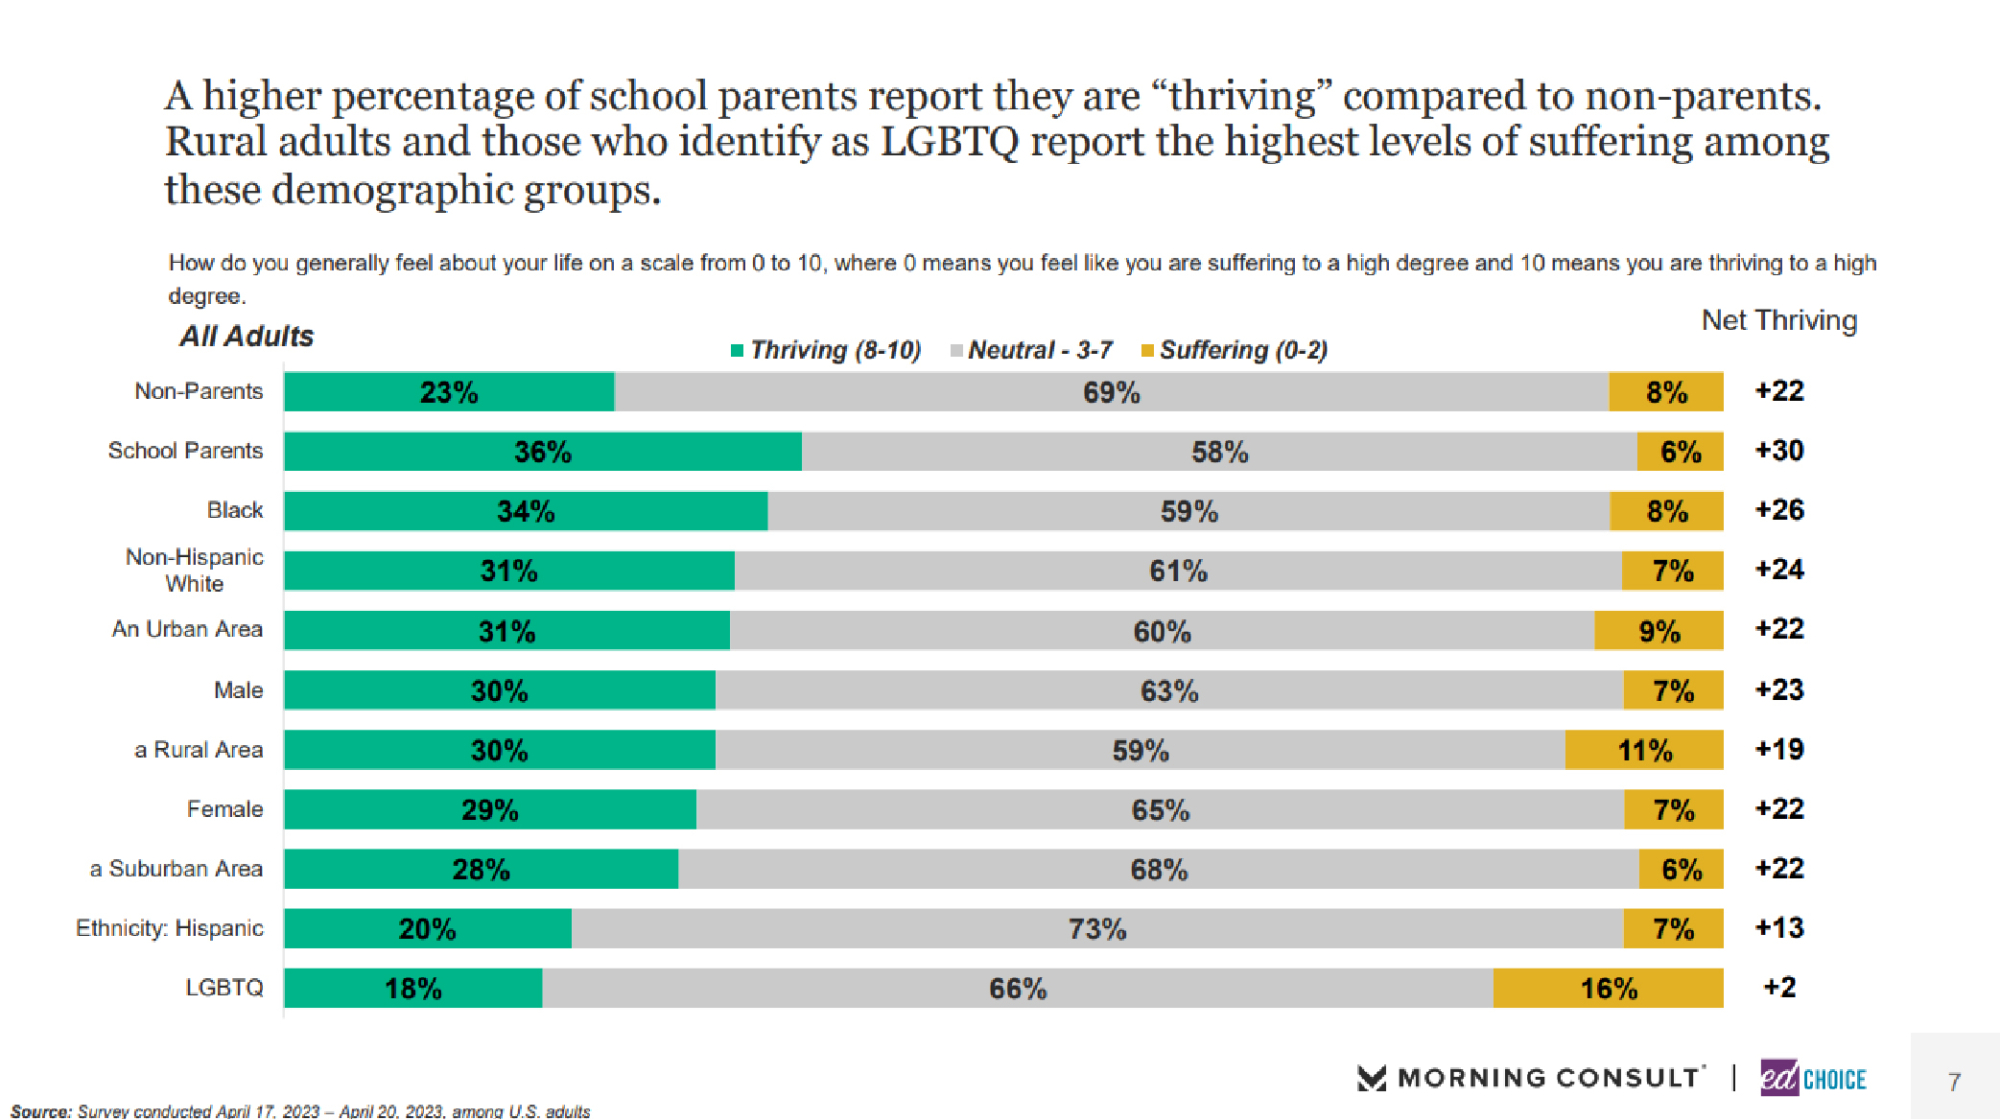
2. A higher percentage of school parents report they are “thriving” compared to nonparents. We posed this question to parents and the general public, “How do you generally feel about your life on a scale from 0 to 10, where 0 means you feel like you are suffering to a high degree and 10 means you are thriving to a high degree.” More than one-third of school parents (36%) said they are thriving, compared to 23 percent of nonparents. Black respondents (34%), white respondents (31%), and adults living in urban areas (31%) were also towards the top. Hispanic adults (20%) and LGBTQ adults (18%) were the least likely to say they are thriving. LGBTQ adults (16%) and respondents living in rural areas (11%) were the most likely to say they are suffering.
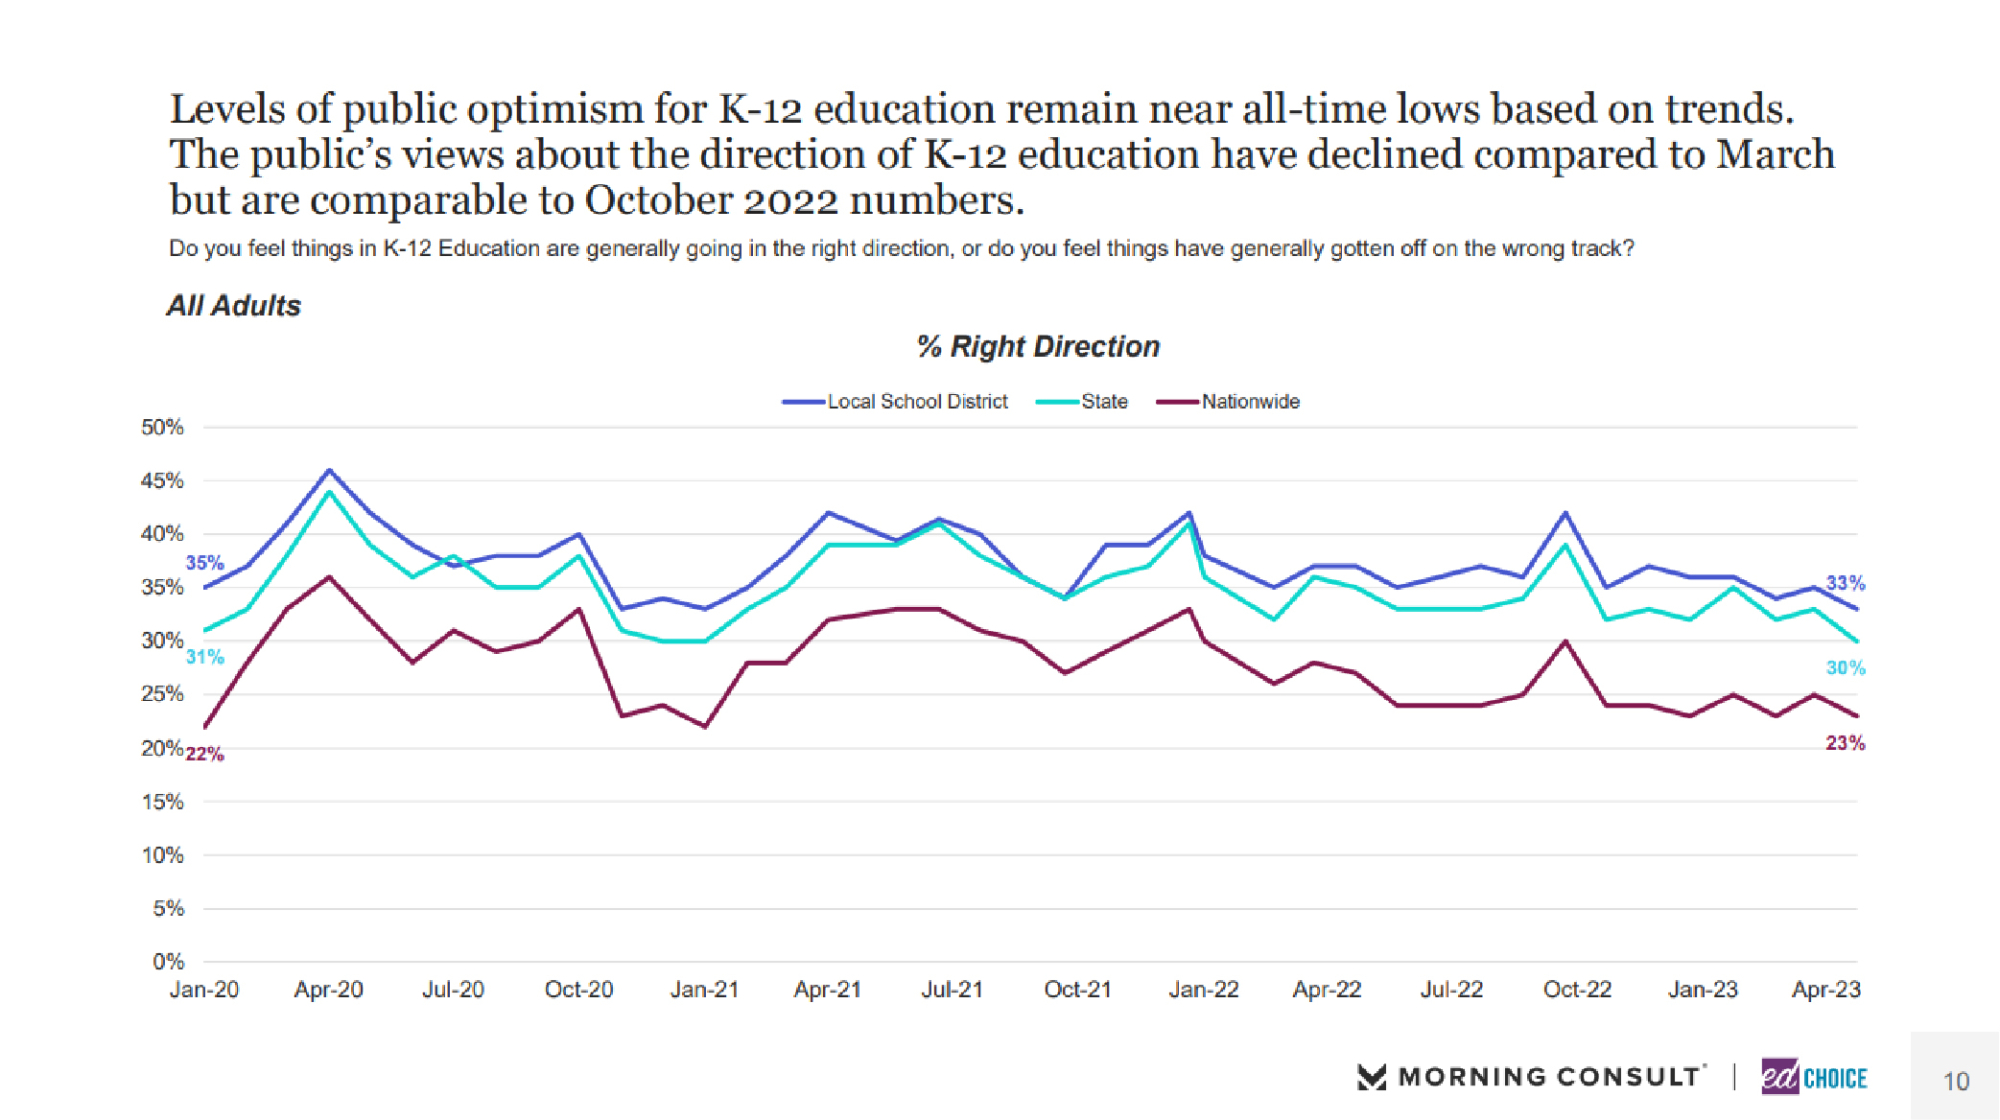
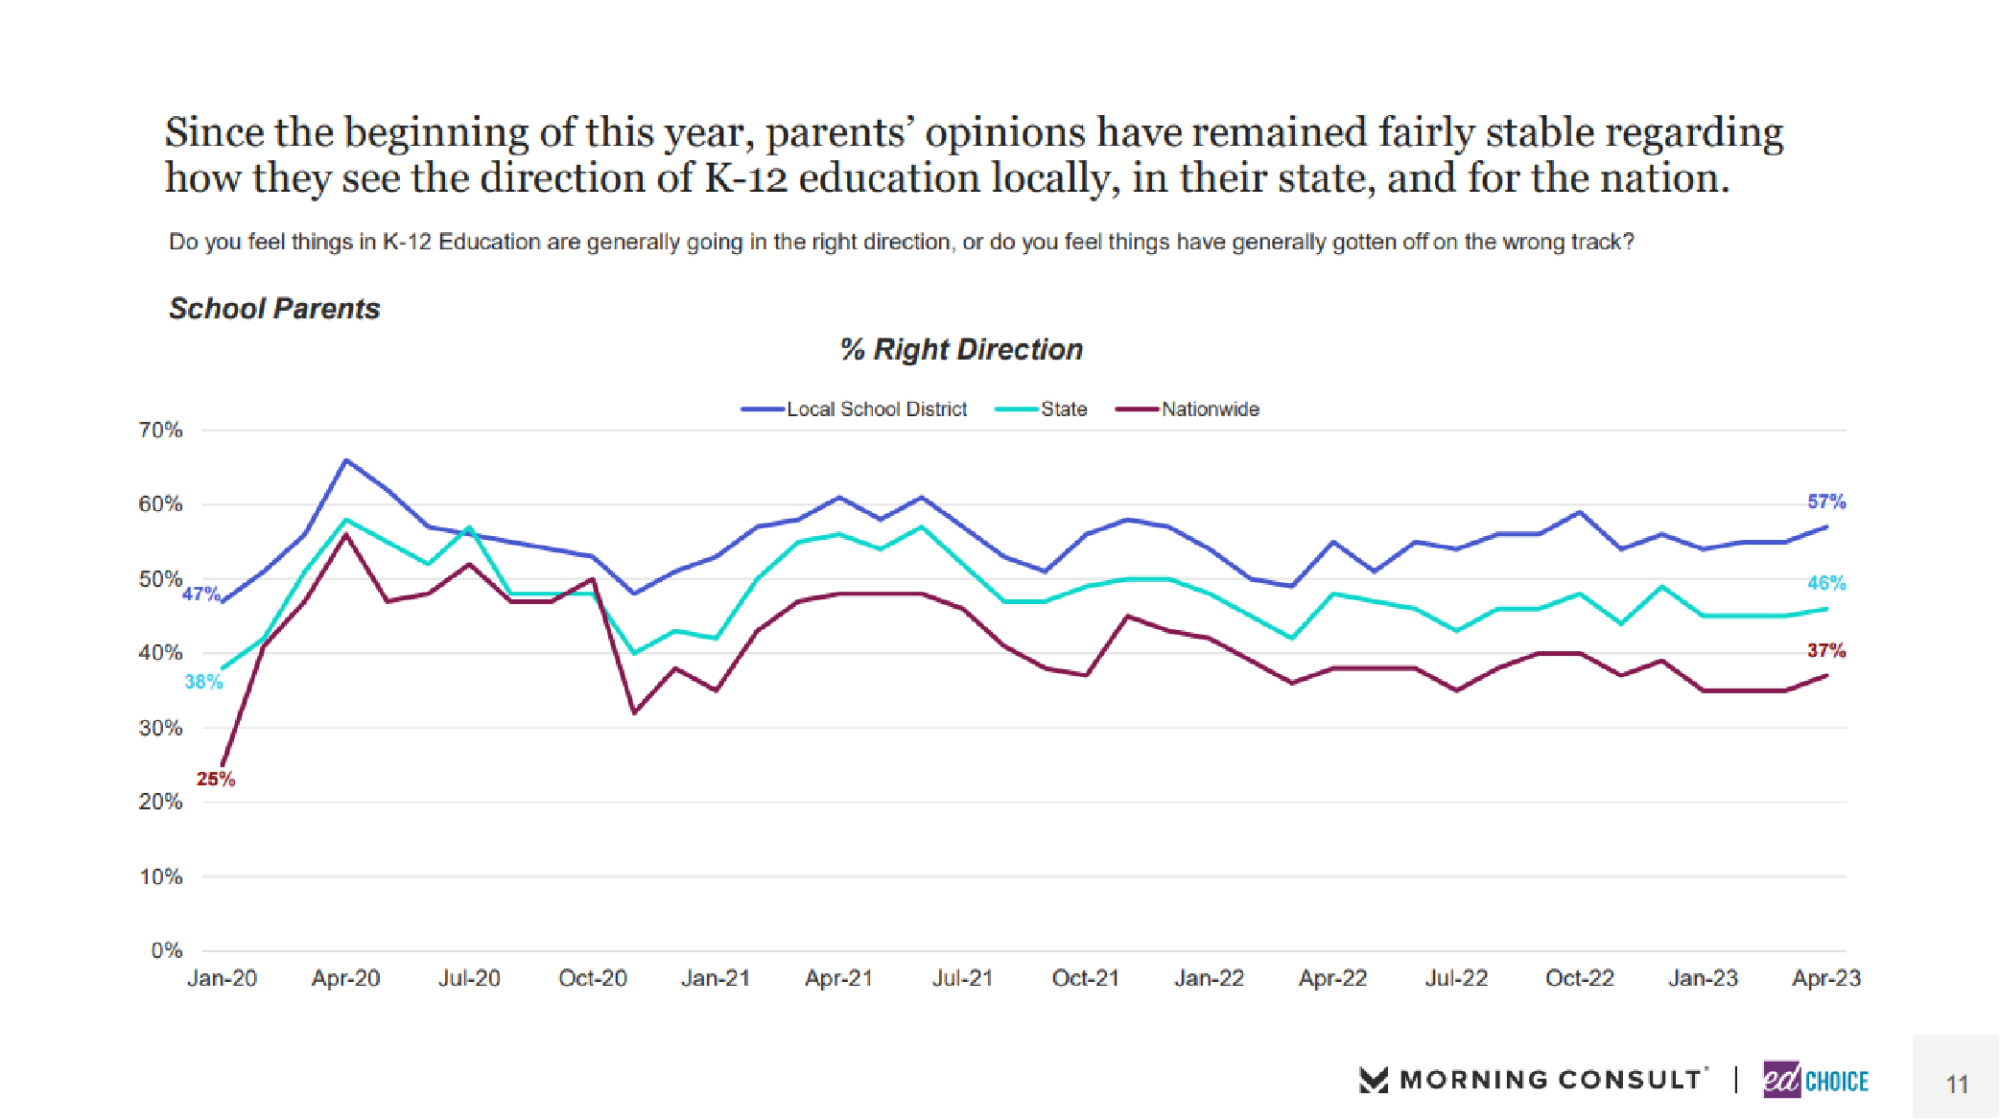
3. The general public’s confidence in the direction of K-12 education declined in April. The level of optimism among the general public has dropped to one of the lowest levels we’ve observed since we began this tracker in 2020. Roughly one-third of Americans feel K-12 education is on the right track at the local and state level, while only one-fourth of Americans express optimism about the direction of K-12 education at the national level. These numbers are comparable to those all the way back in the fall of 2020. Parents, on the other hand, are much more optimistic about K-12 education. Nearly three in five parents feel K-12 education at the local level is on the right track, a slight increase from March. Parents feel less optimistic about K-12 education at the state (46%) and national level (37%), though they reported similar feelings in March.
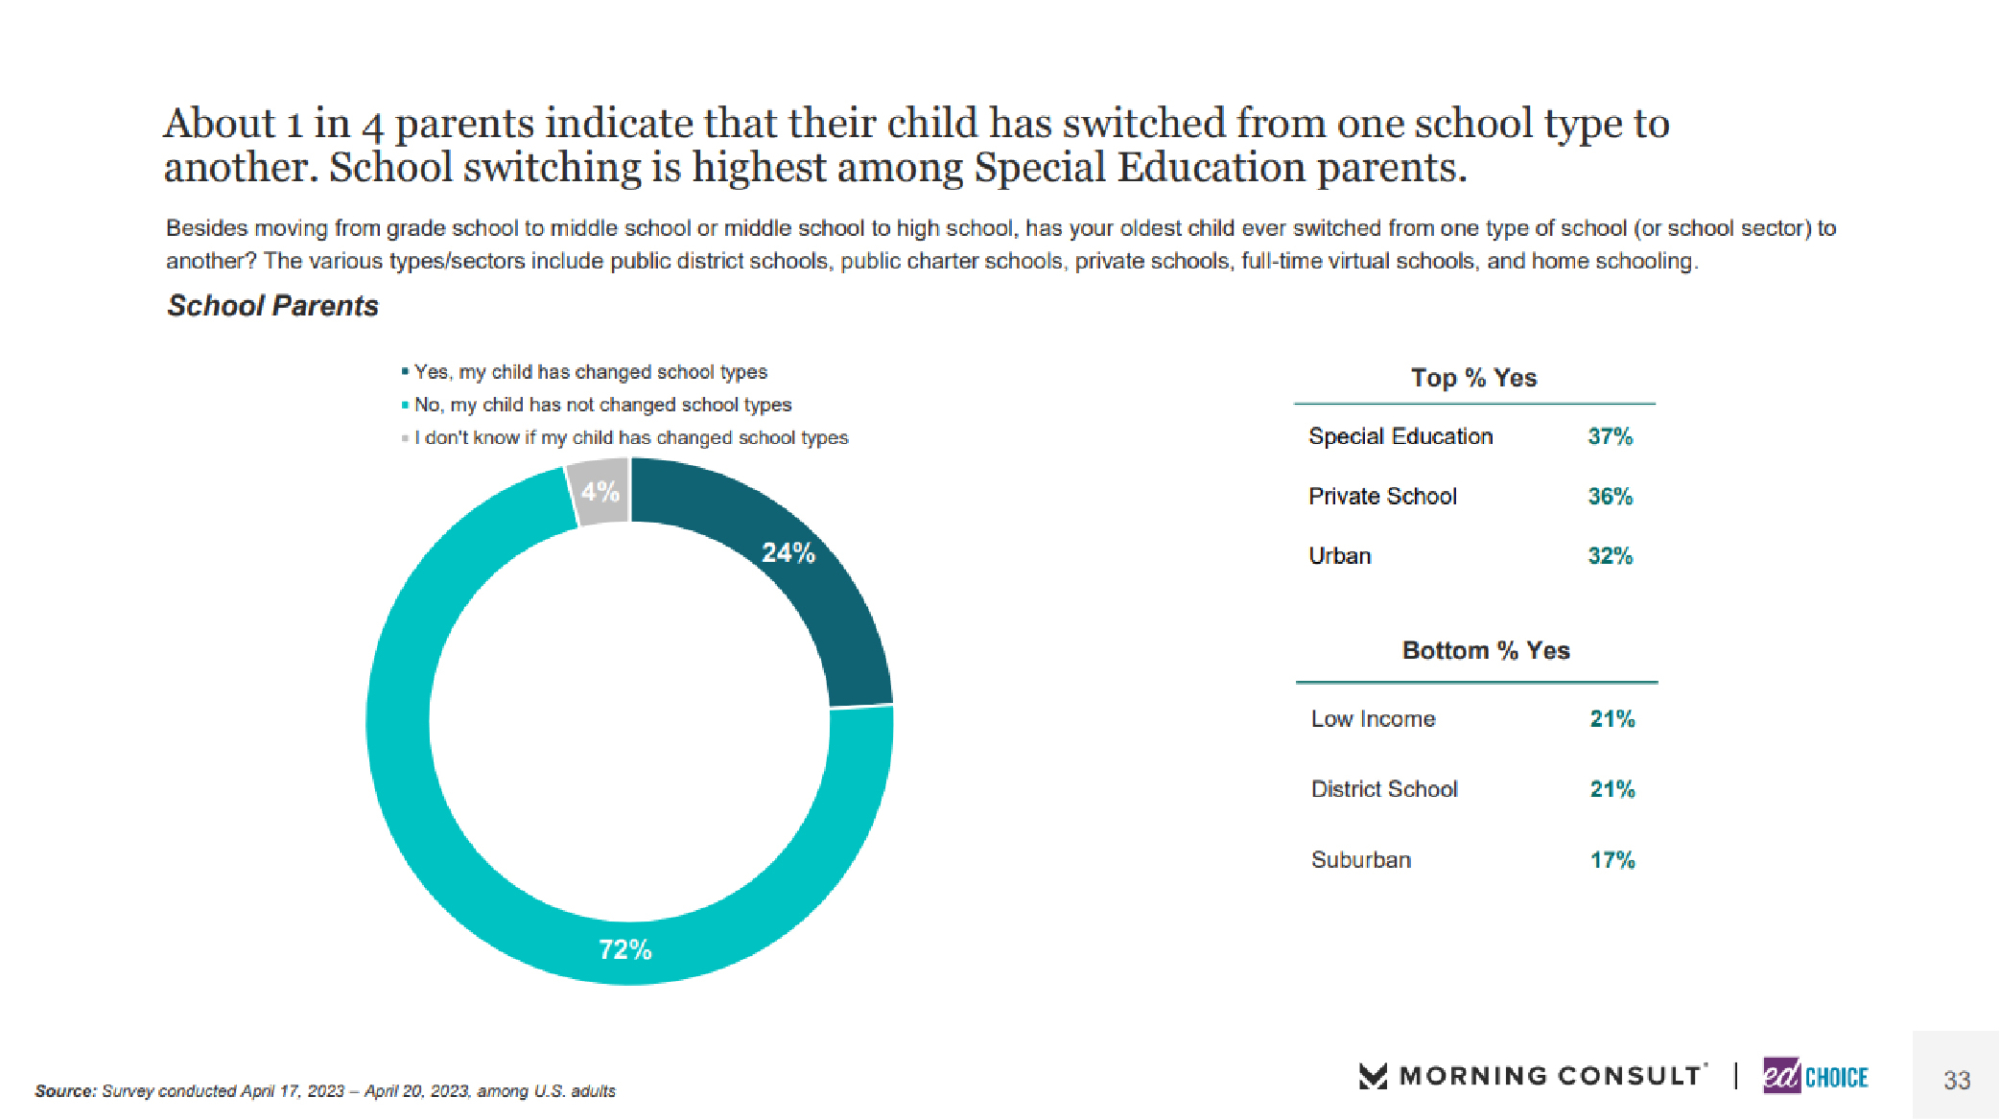
4. Nearly one in four parents say their child has switched school types. Besides moving from elementary to middle school or middle school to high school, 24 percent of parents say their child has switched school types. This is a significant decrease from March. Special education parents (37%) and private school parents (36%) were the most likely to report their child had switched school types. In contrast, low-income parents (21%) and district school parents (21%) were among the least likely to say their child has switched school types.
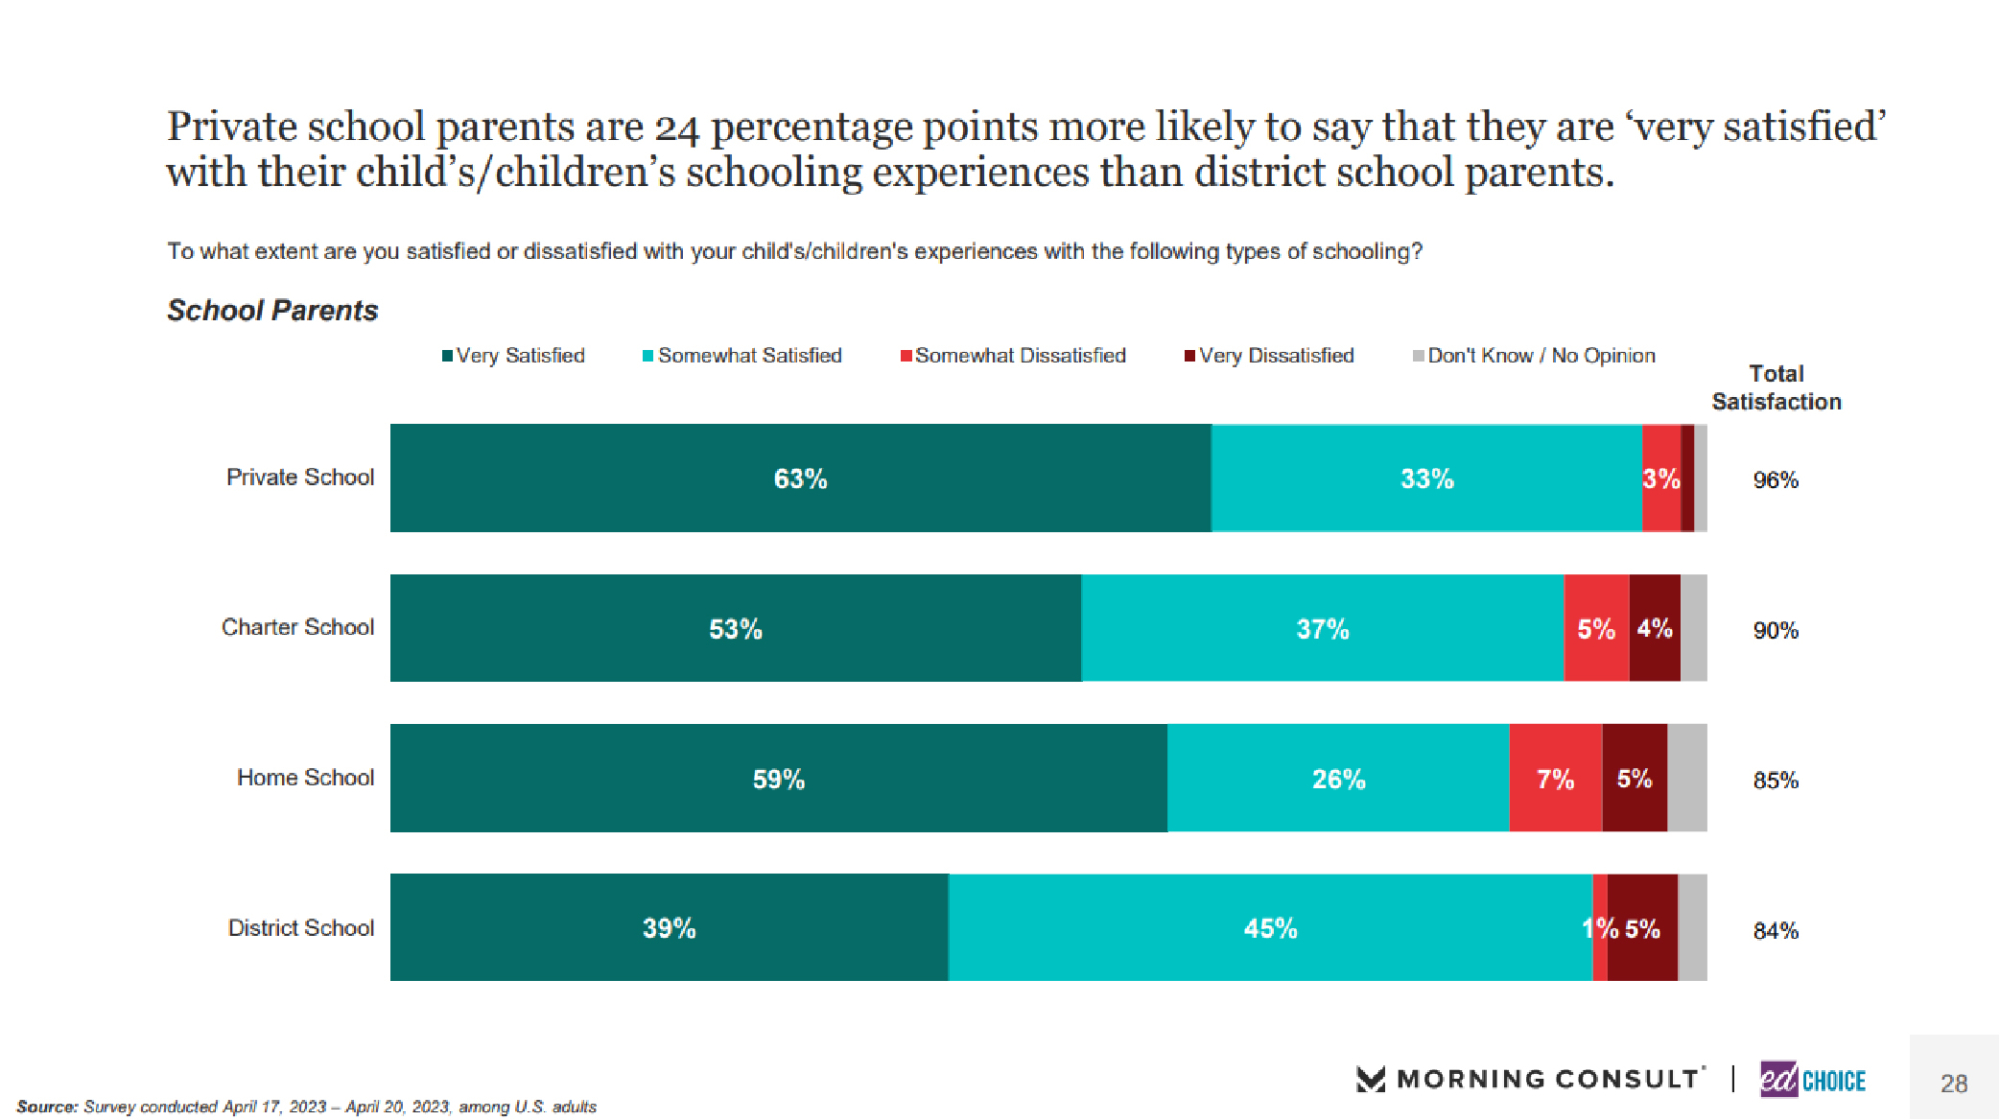
5. Private school parents are significantly more likely to say they are very satisfied with their child’s school than district school parents. Nearly two-thirds of private school parents are very satisfied with their child’s schooling experience. The majority of homeschooling parents (59%) and charter school parents (53%) also report being very satisfied with their child’s schooling experience. District school parents are lagging behind the rest, with only 39 percent saying they are very satisfied with their child’s school. That said, parents of all school types, in terms of total satisfaction, report high levels of satisfaction with their child’s schooling experiences. Private school parents are the most satisfied (96%), while charter school parents (90%), homeschool parents (85%), and district school parents (84%), follow close behind.
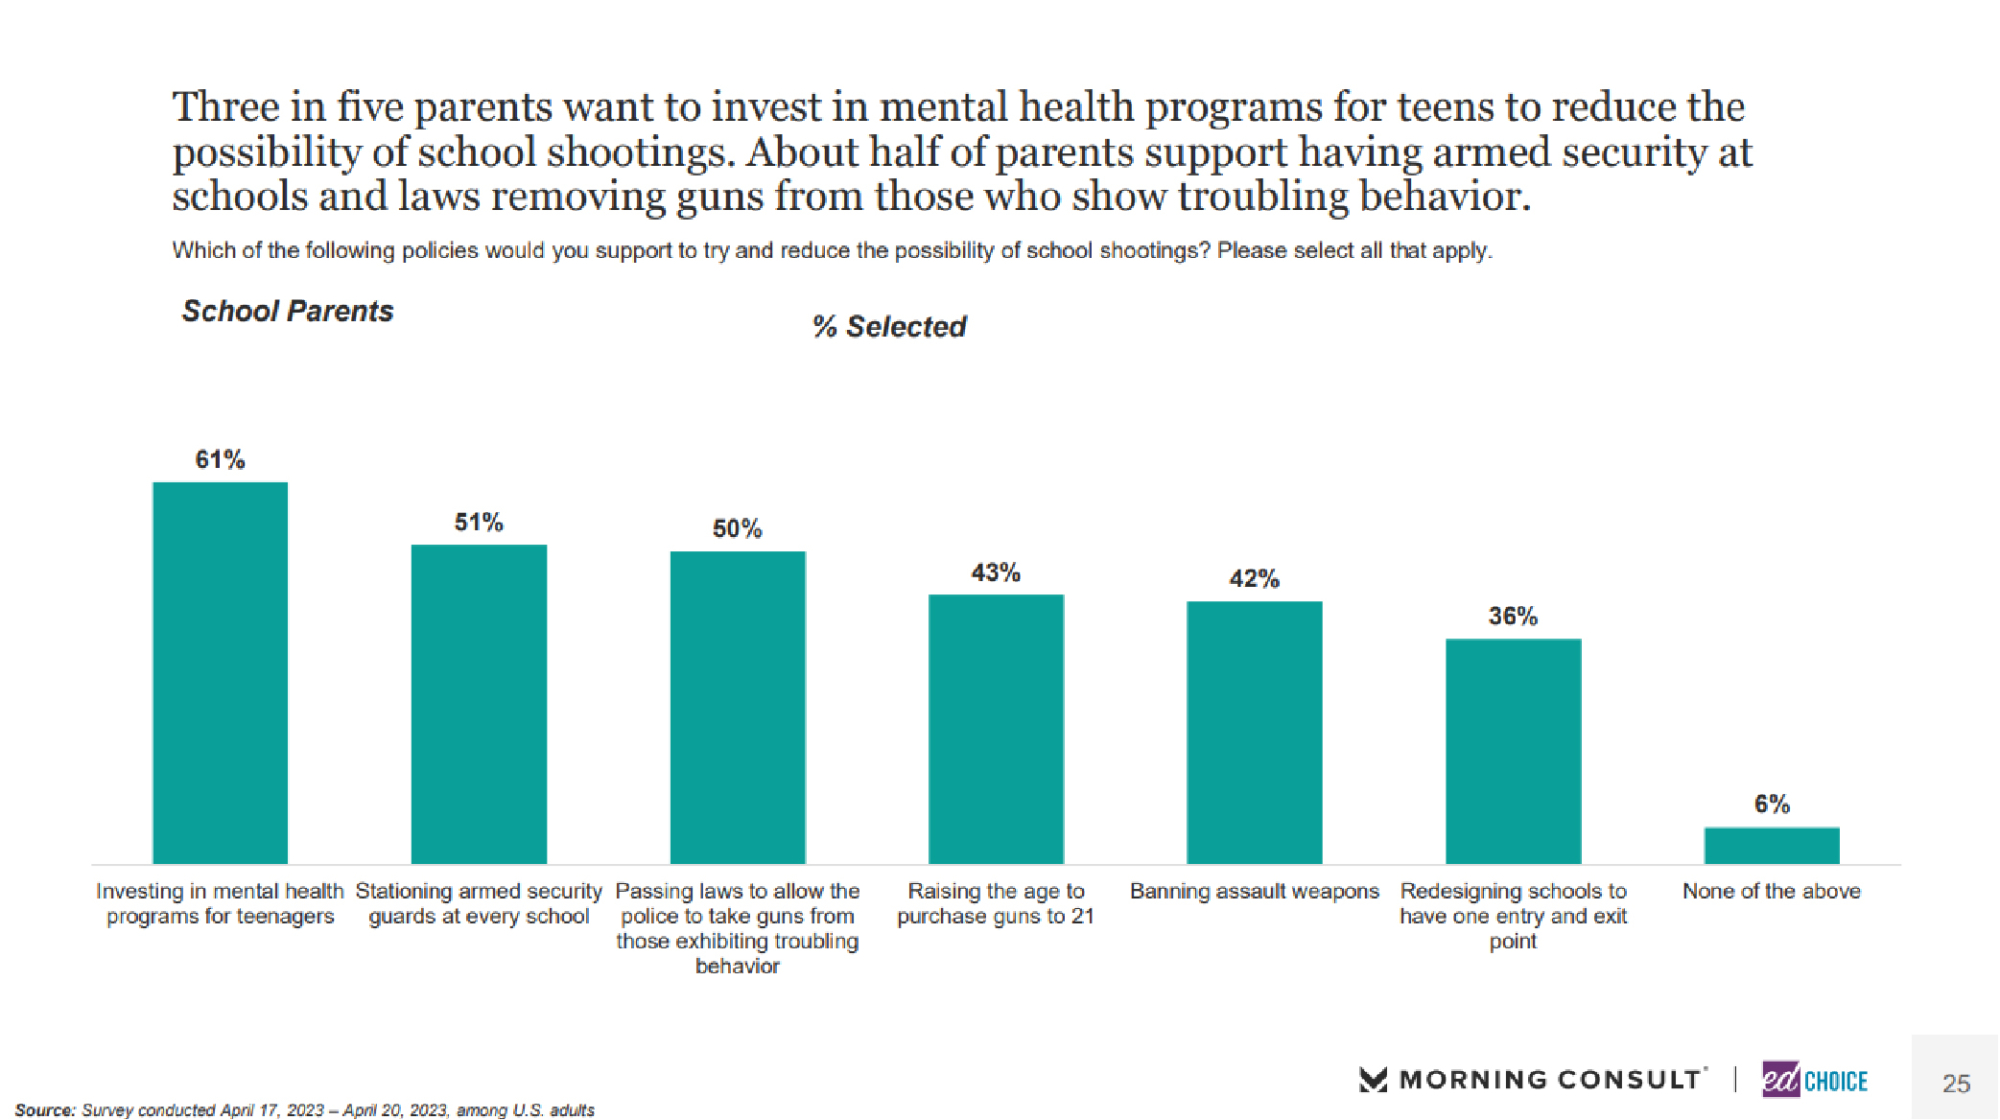
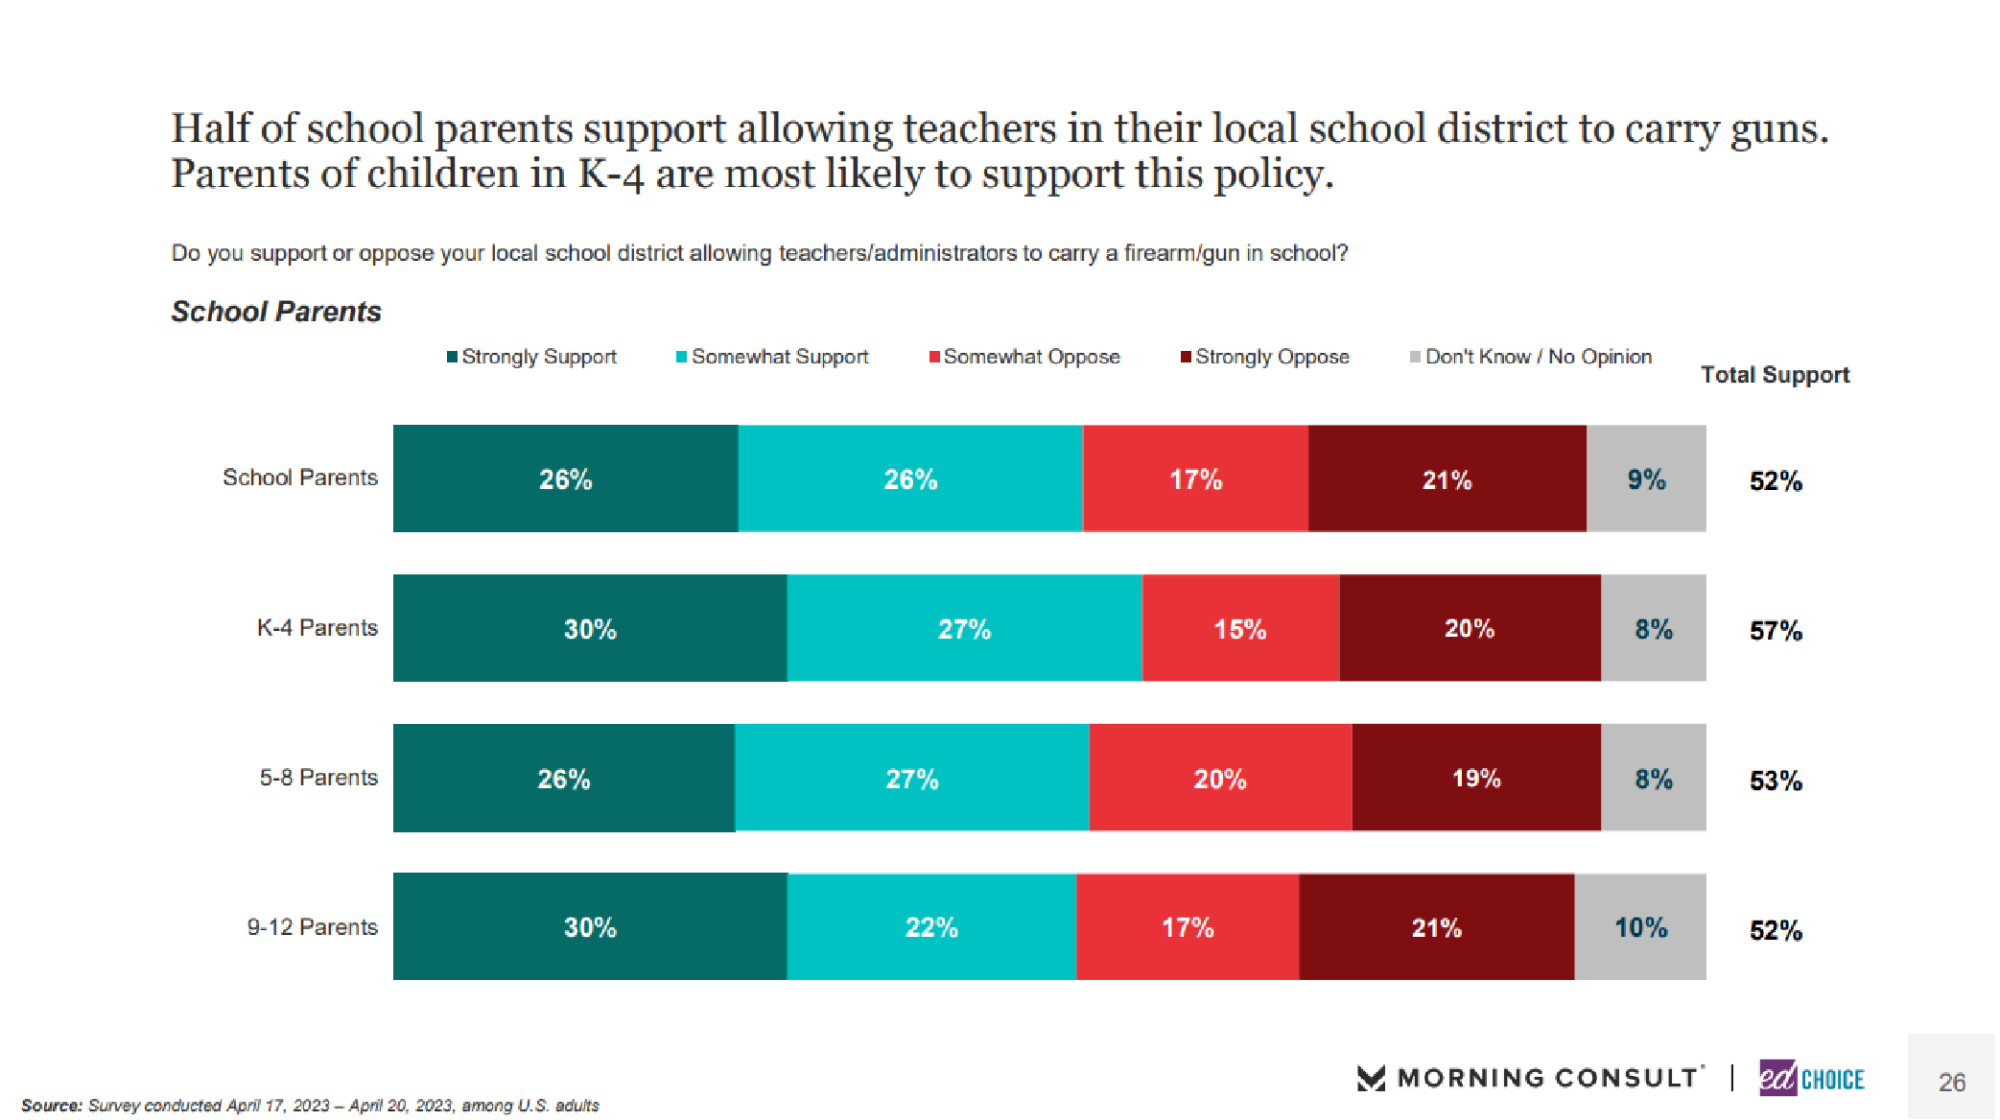
6. More than three in five school parents support investing in mental health programs for teens to reduce the possibility of school shootings. This was the most popular choice for parents by a significant margin. Roughly half of parents signaled that stationing armed guards at school and passing laws to allow the police to take guns away from those exhibiting troubling behavior would also help reduce the possibility of school shootings. When asked about the idea of allowing teachers or staff to carry firearms in school, 52 percent of parents supported that idea. Support for arming teachers was highest amongst parents of younger children, at 57 percent.
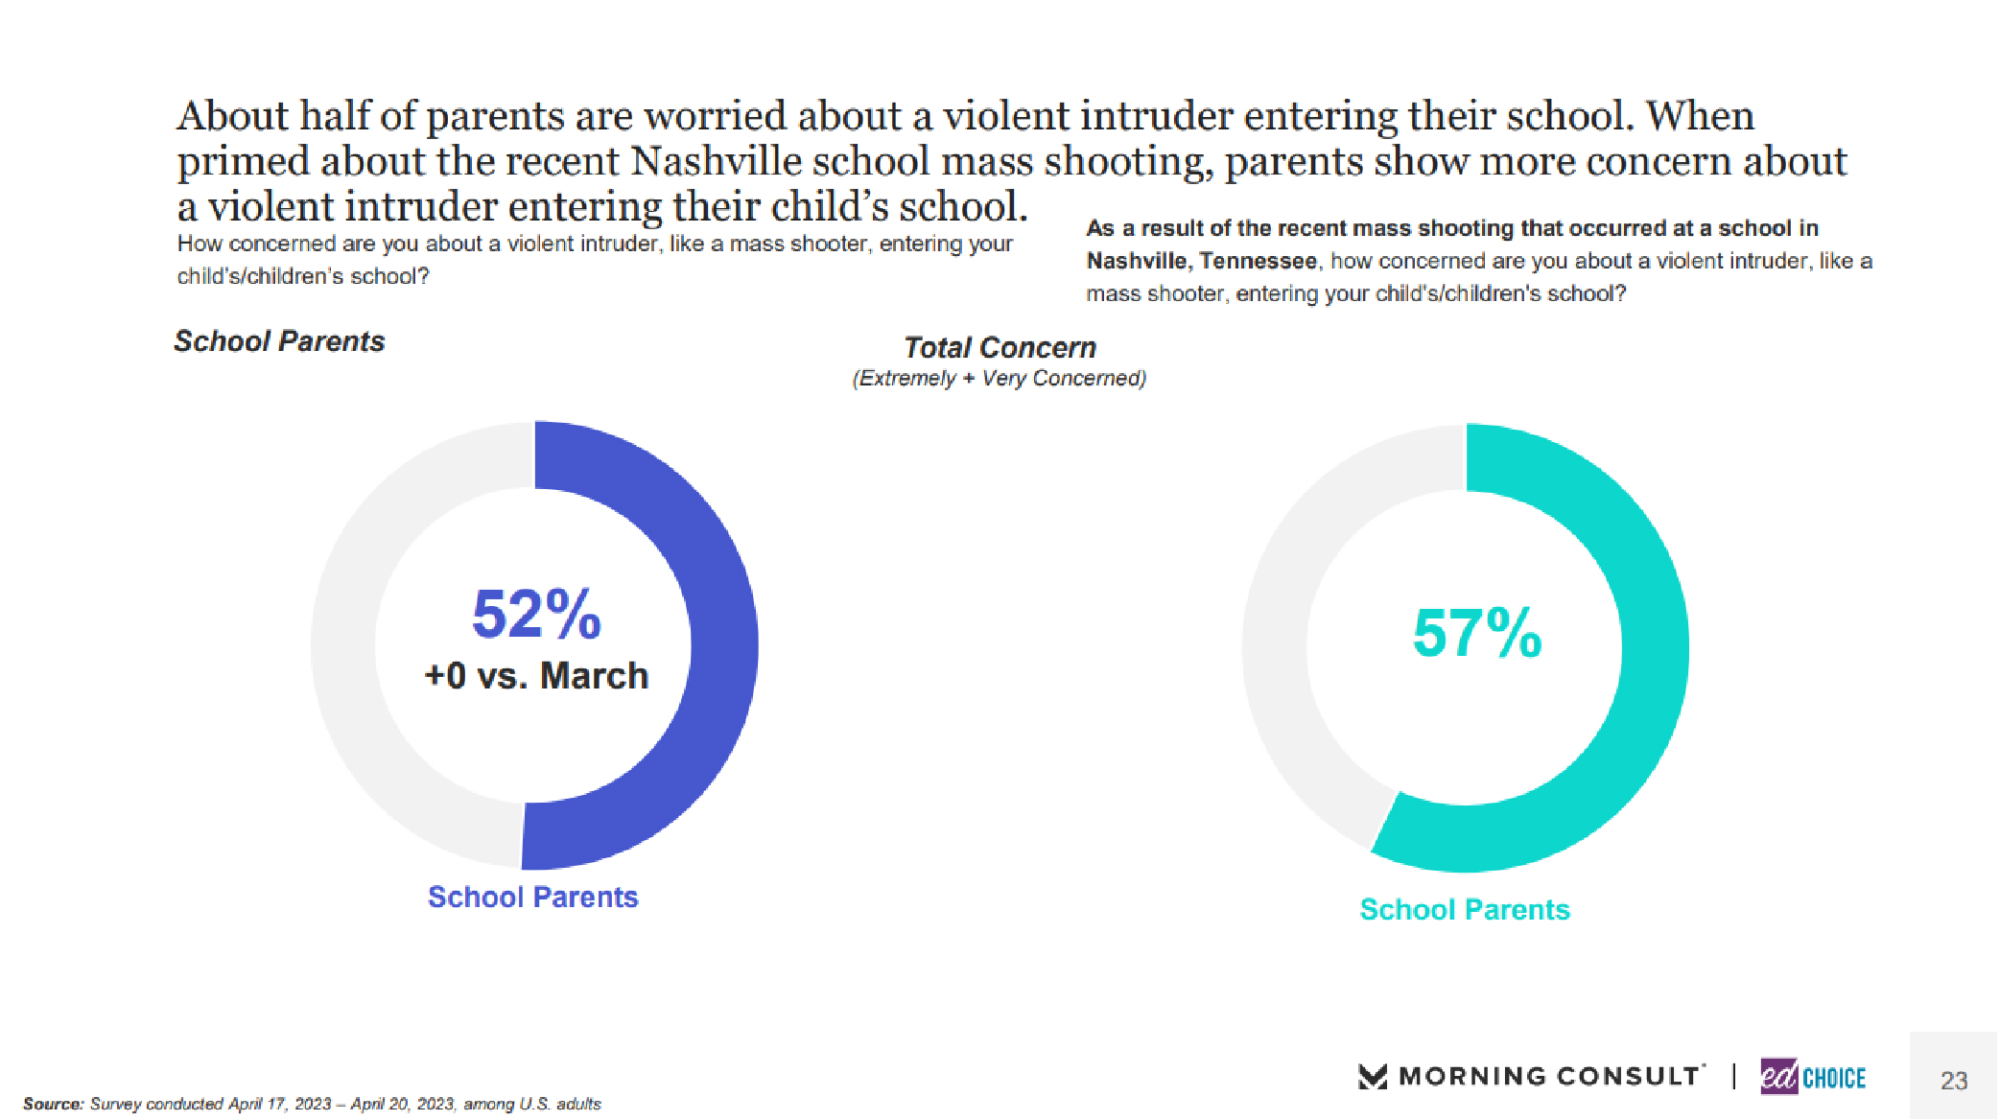
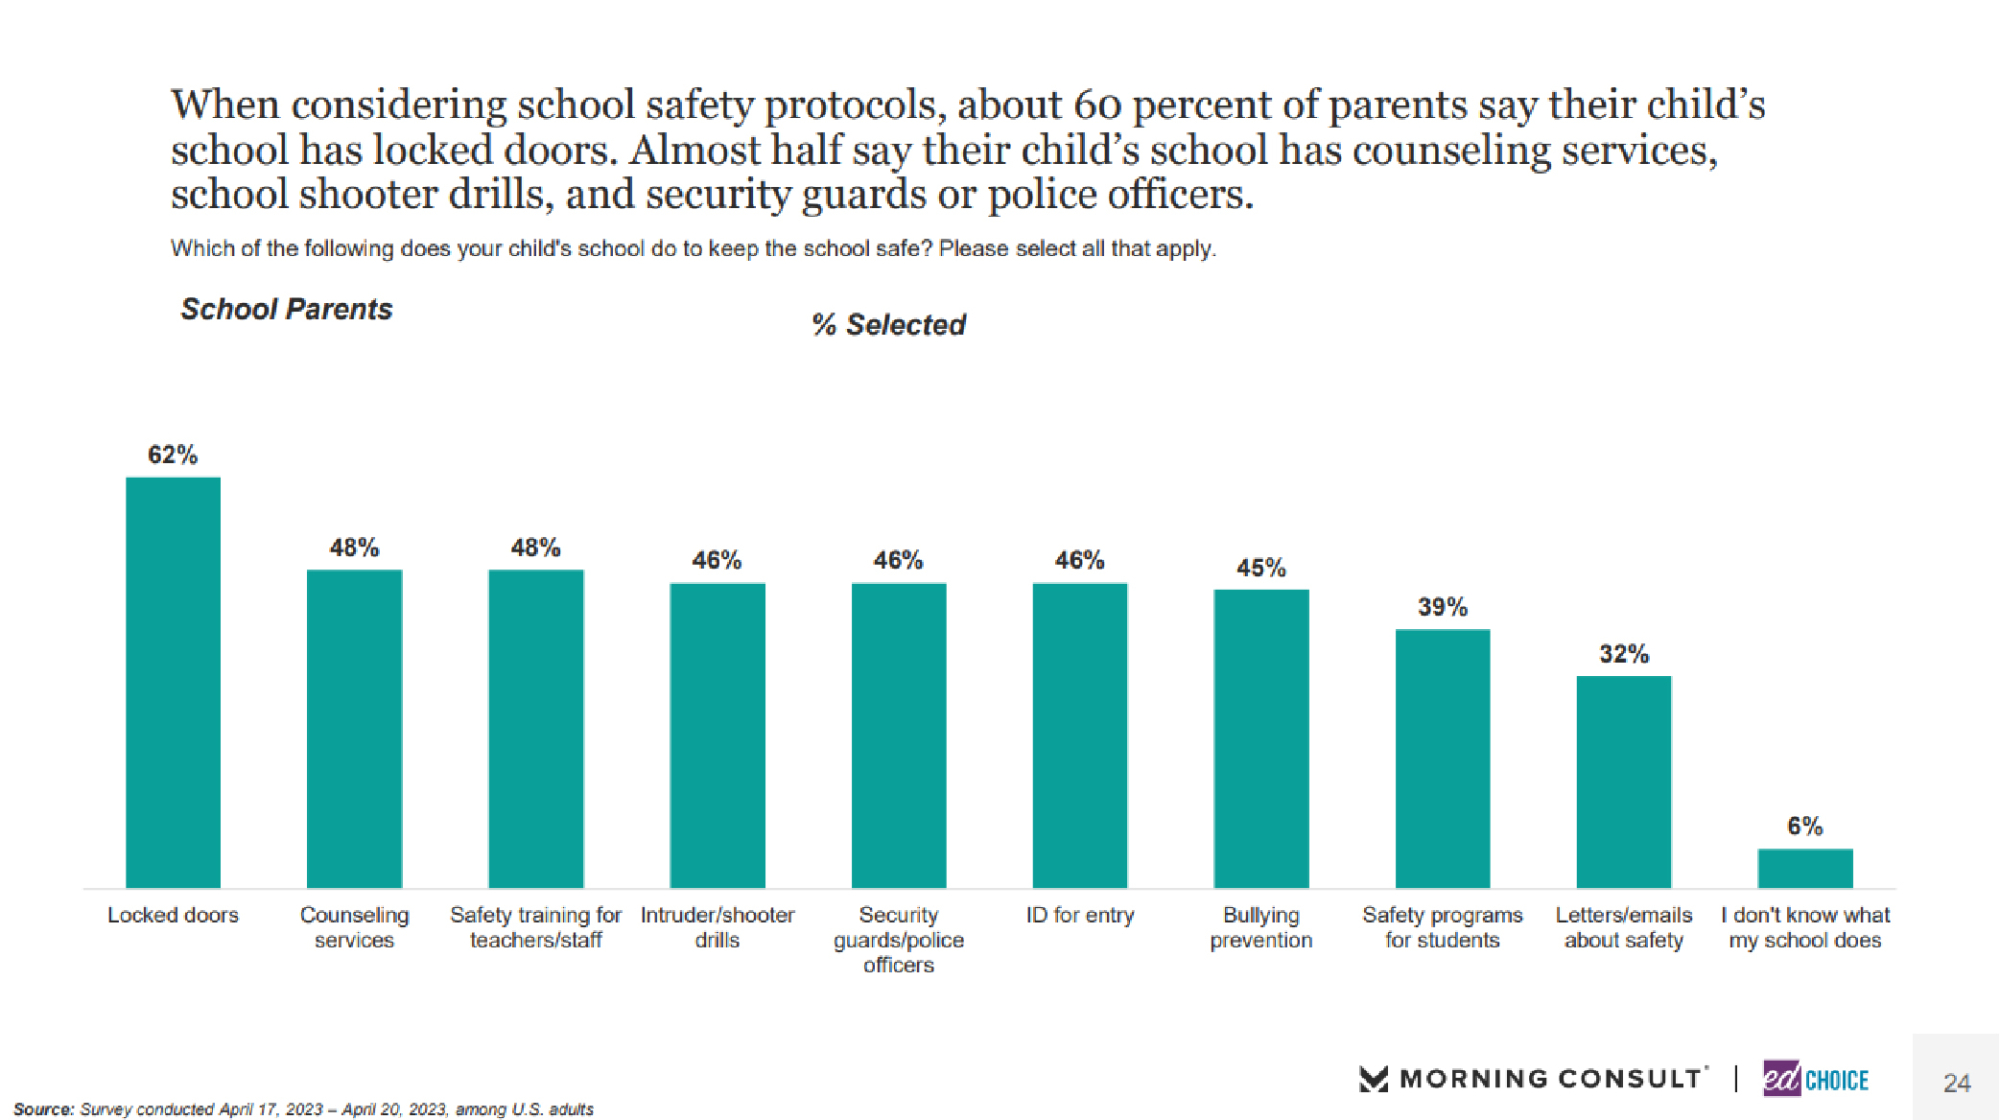
7. More than half of parents are concerned about the possibility of a violent intruder entering their child’s school. Concern among parents remained steady since March. However, when primed about the recent mass shooting at an elementary school in Nashville, parents’ concern level increased 5 percent. When asked what safety protocols their child’s school employs, nearly two-thirds of parents say their school has locked doors. Approximately half of parents say their child’s school has intruder drills, security guards/police officers, safety training for teachers/staff, as well as counseling services.
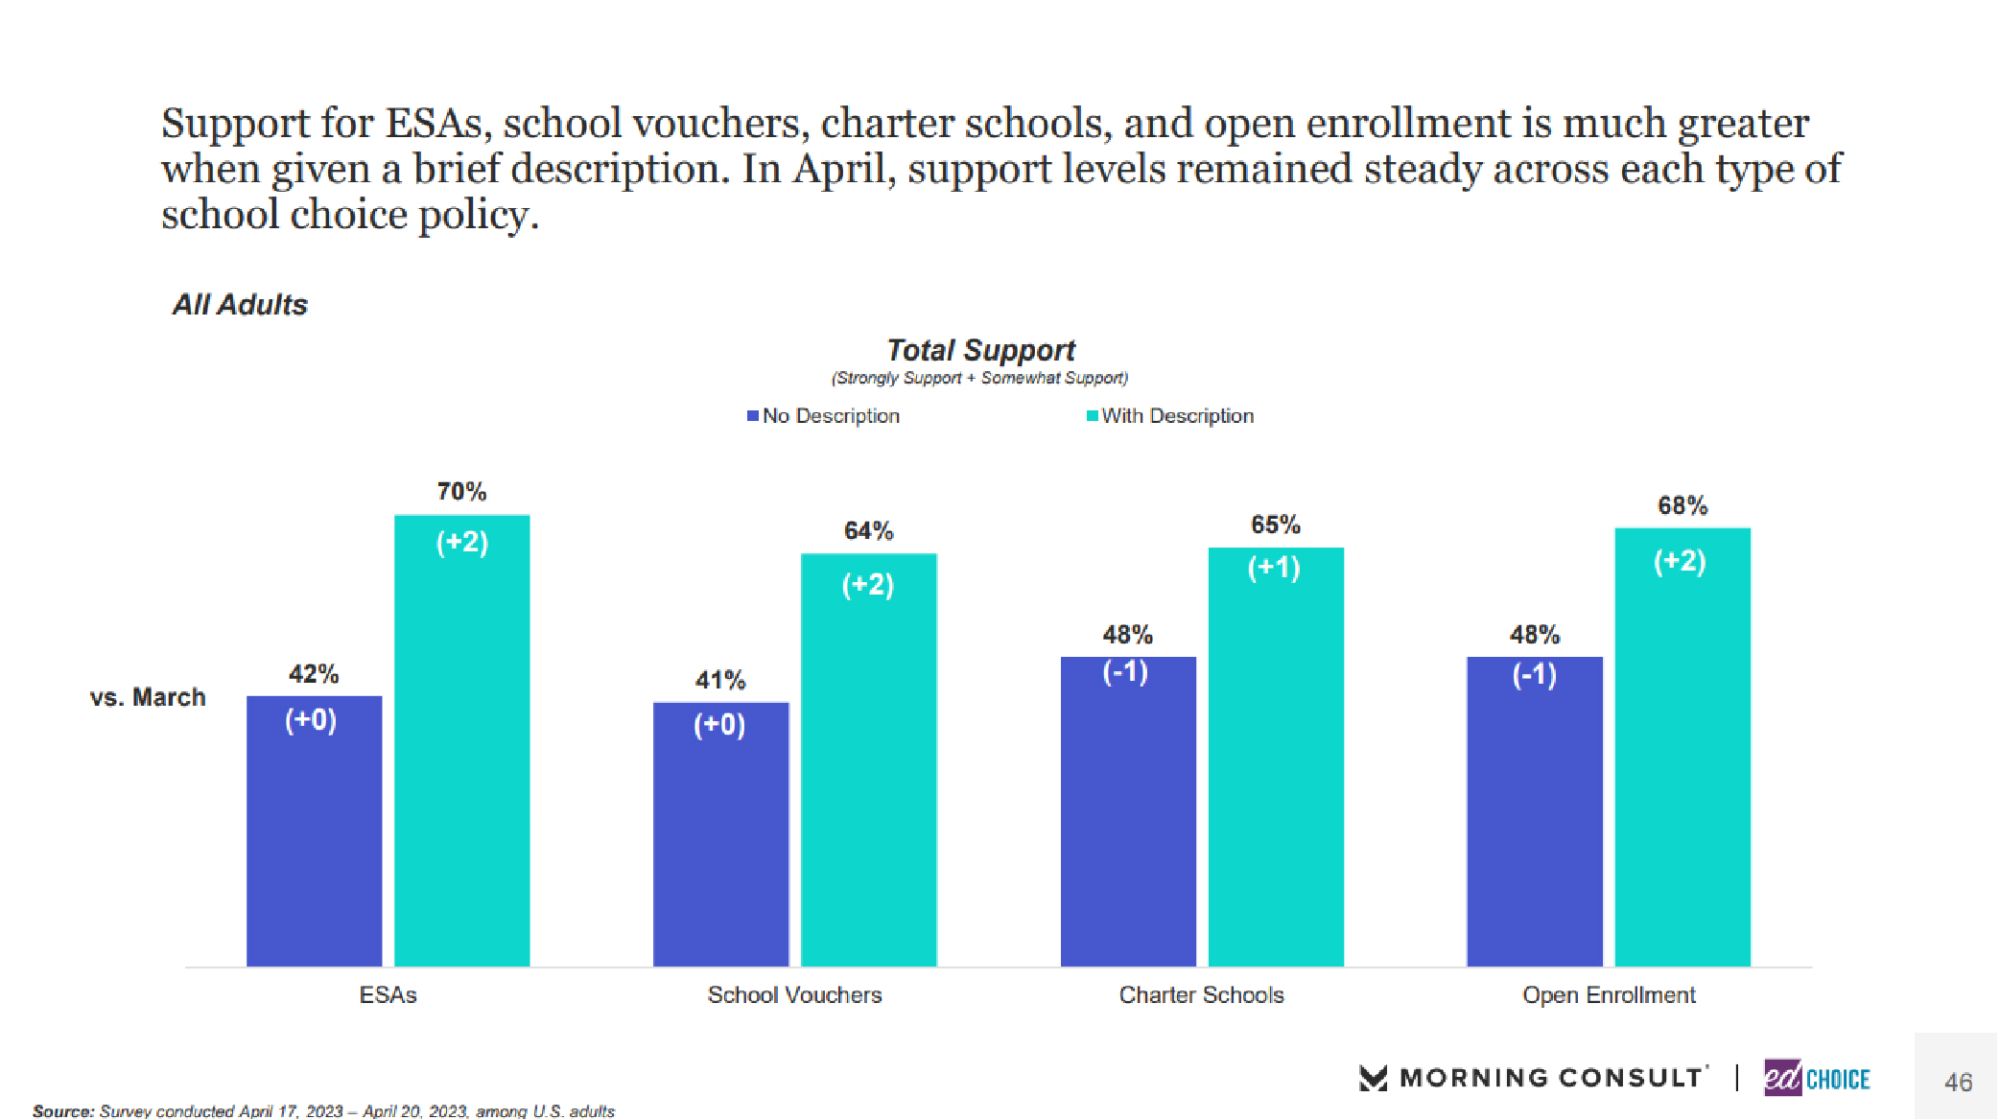
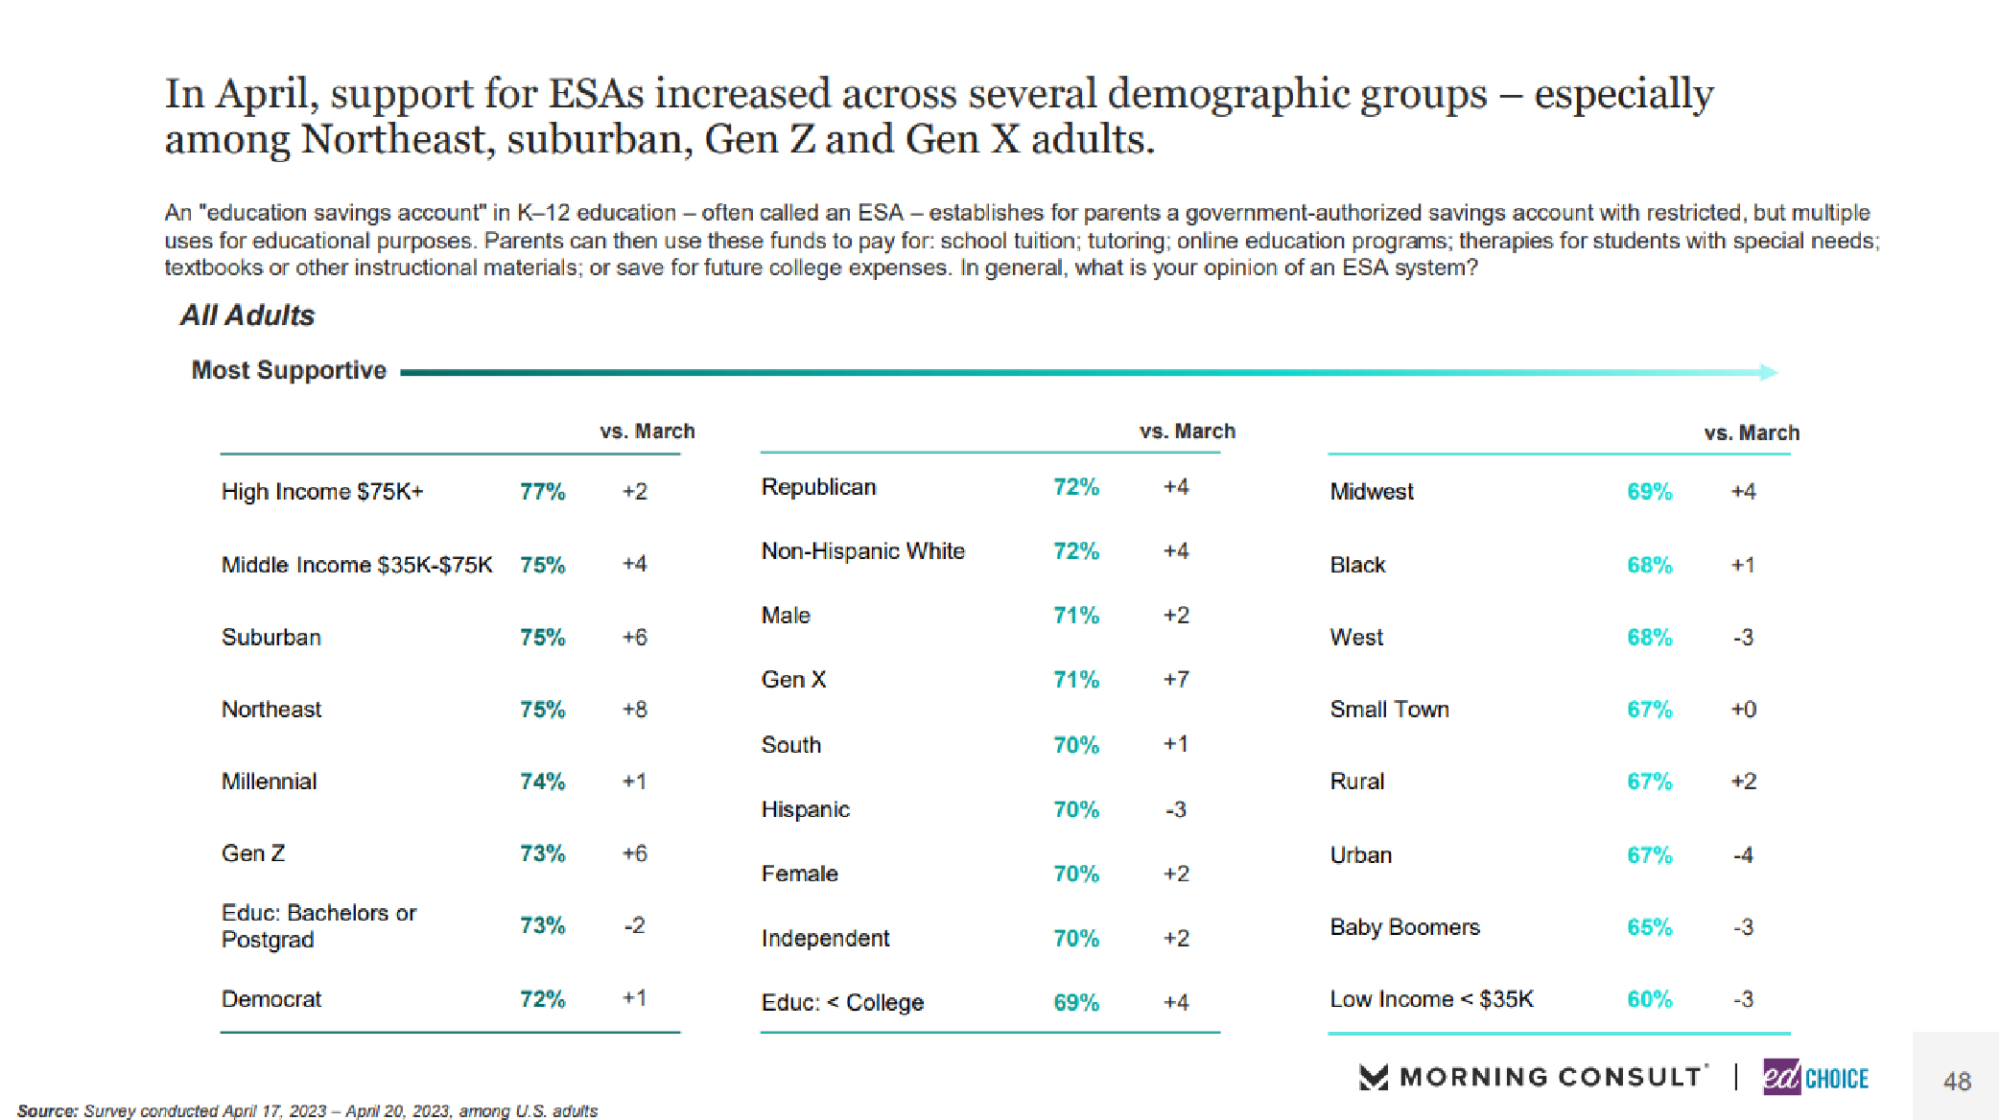
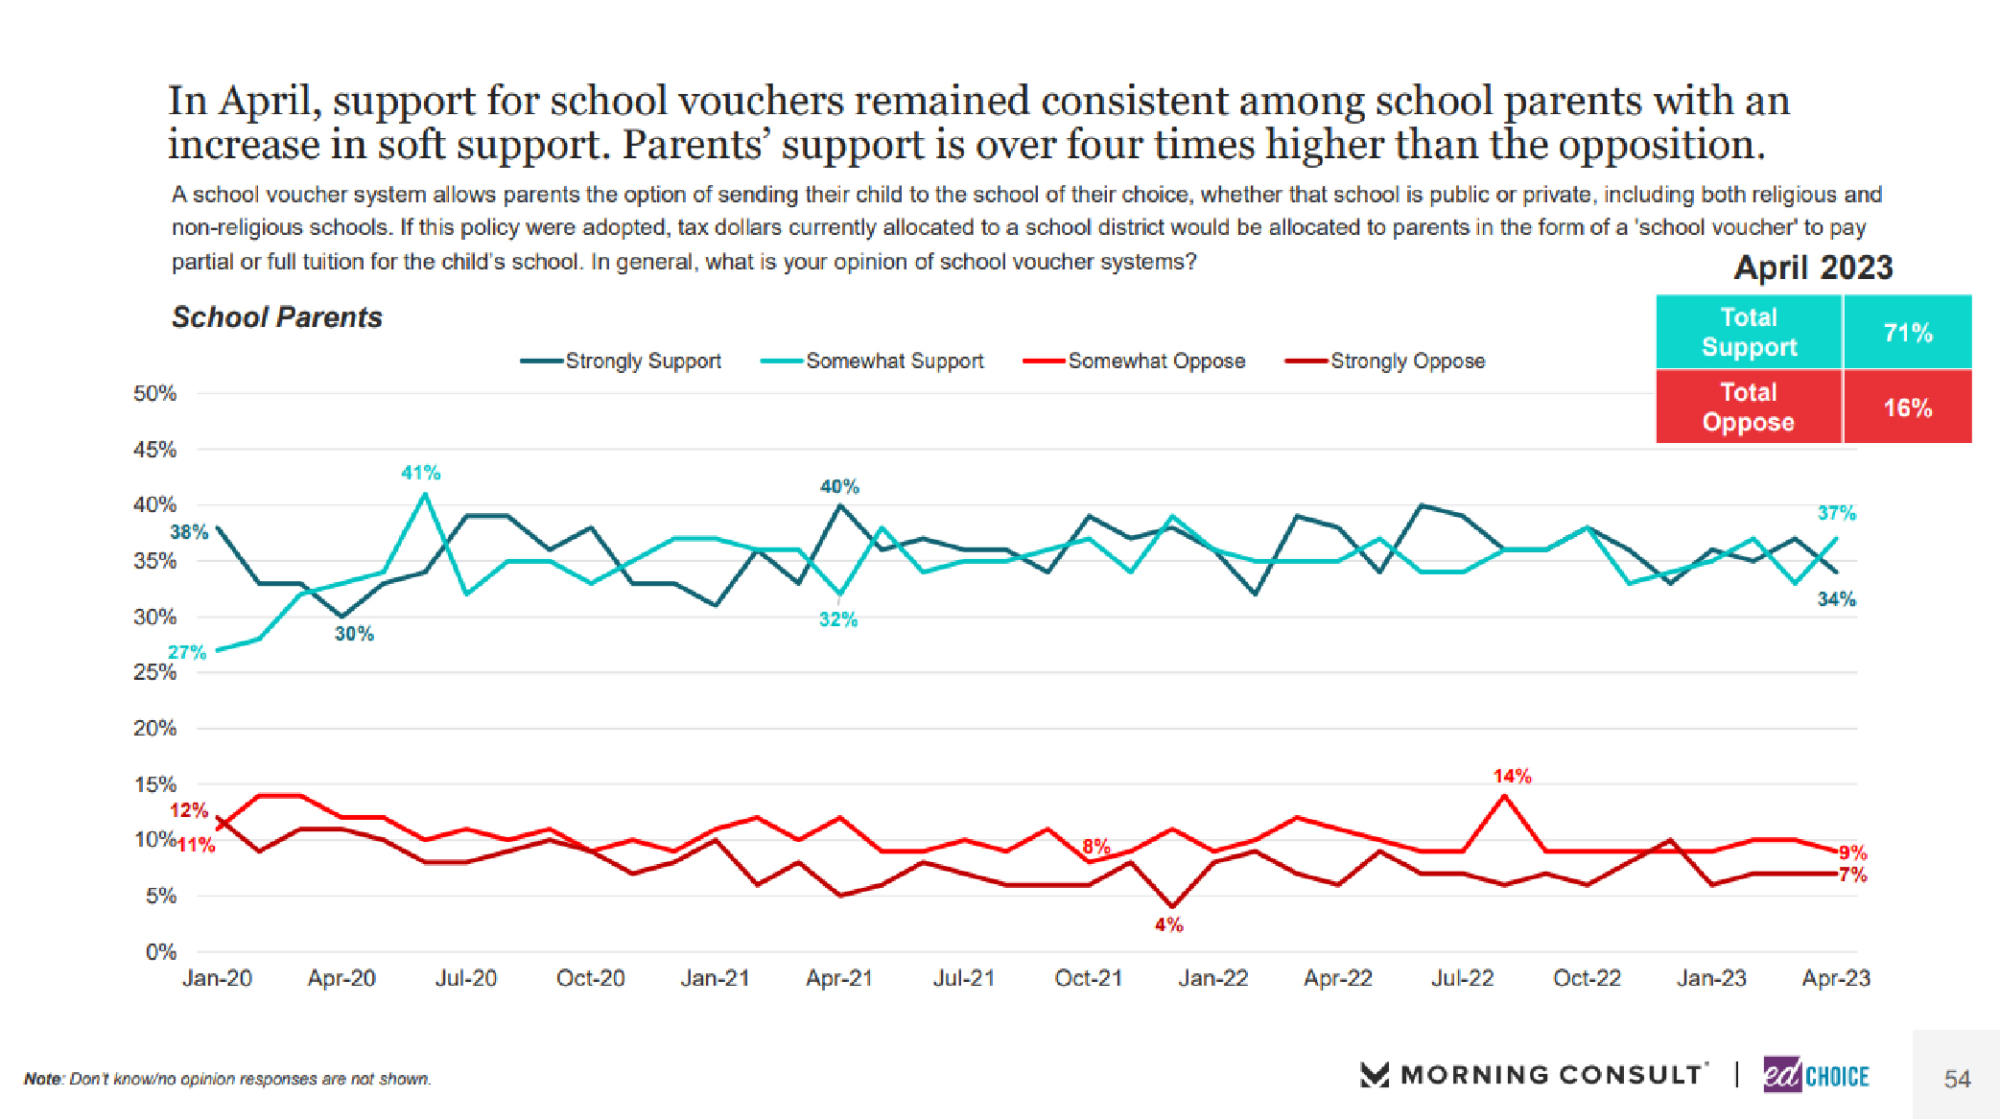
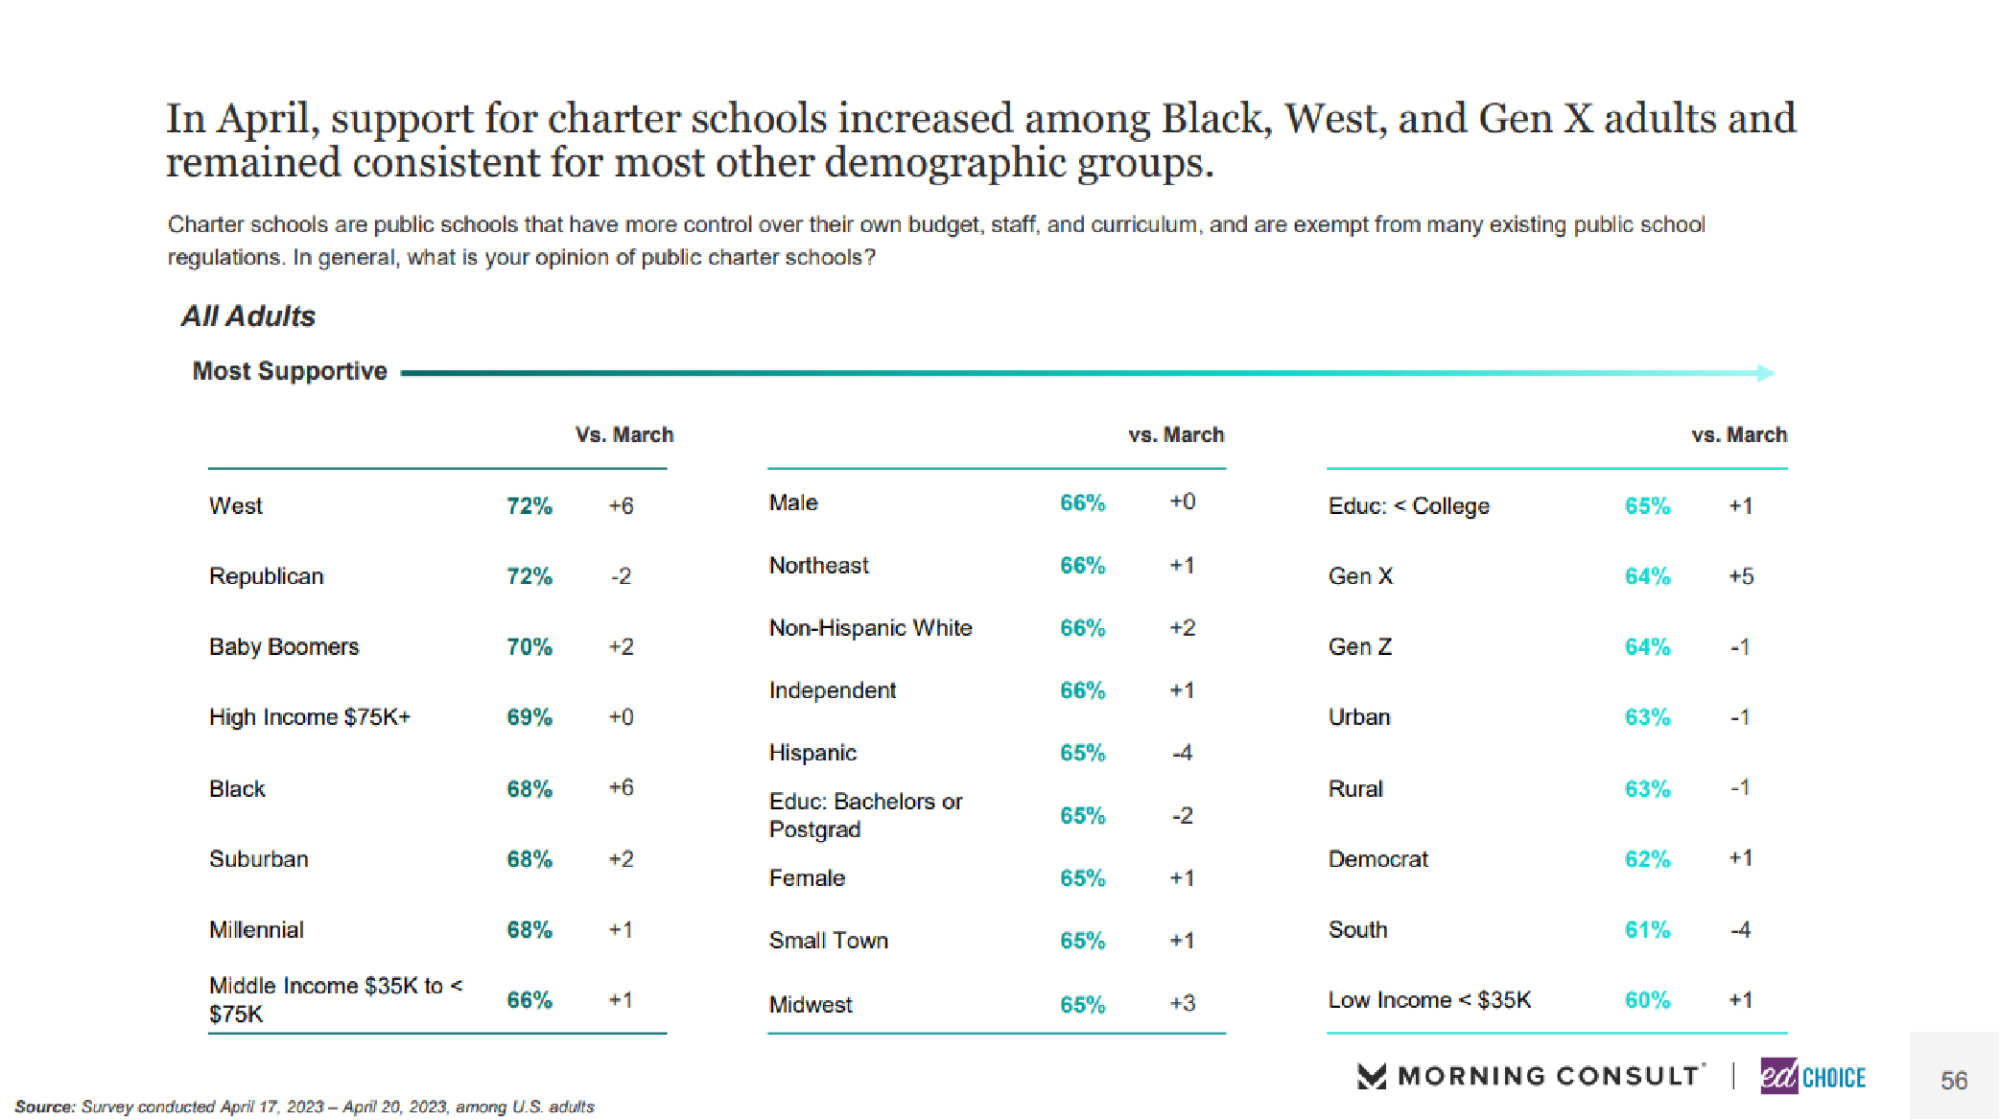
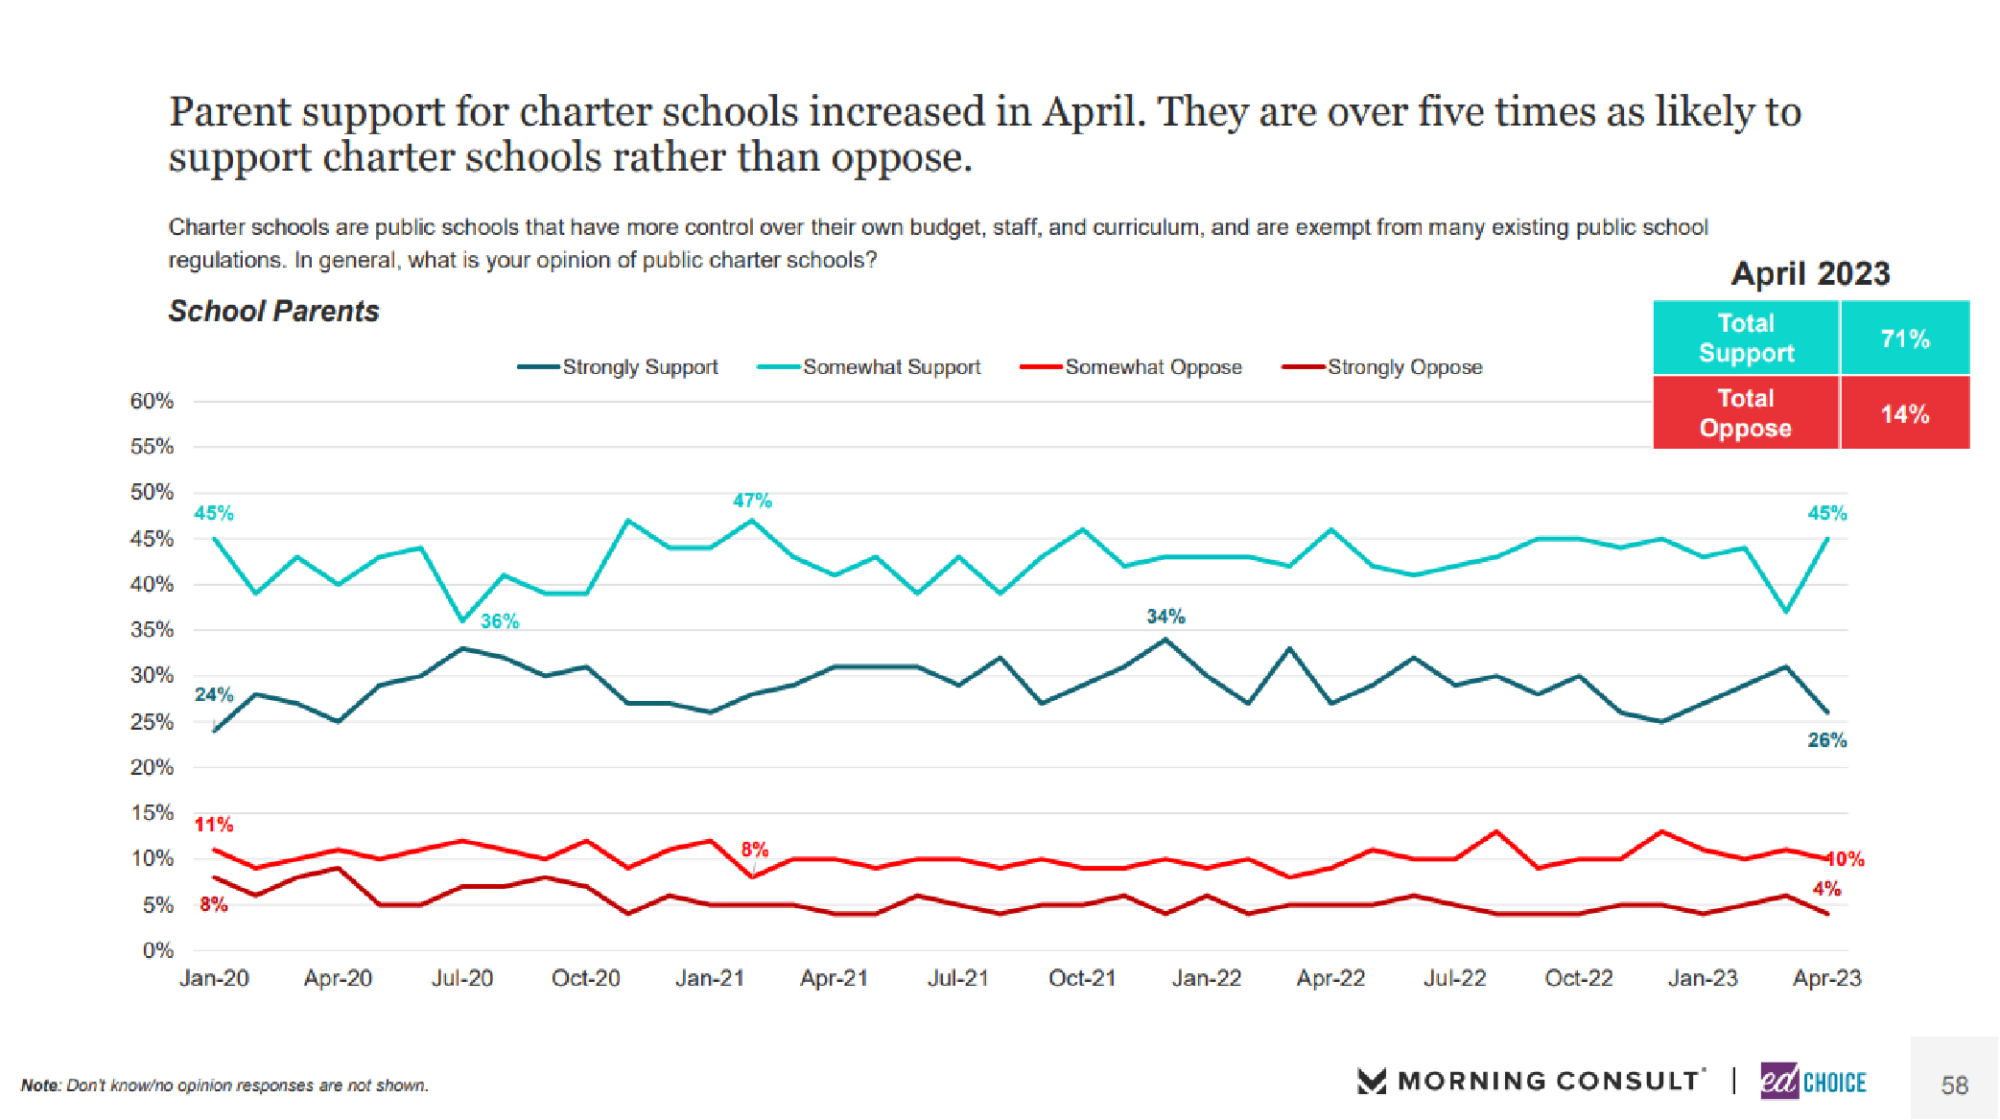
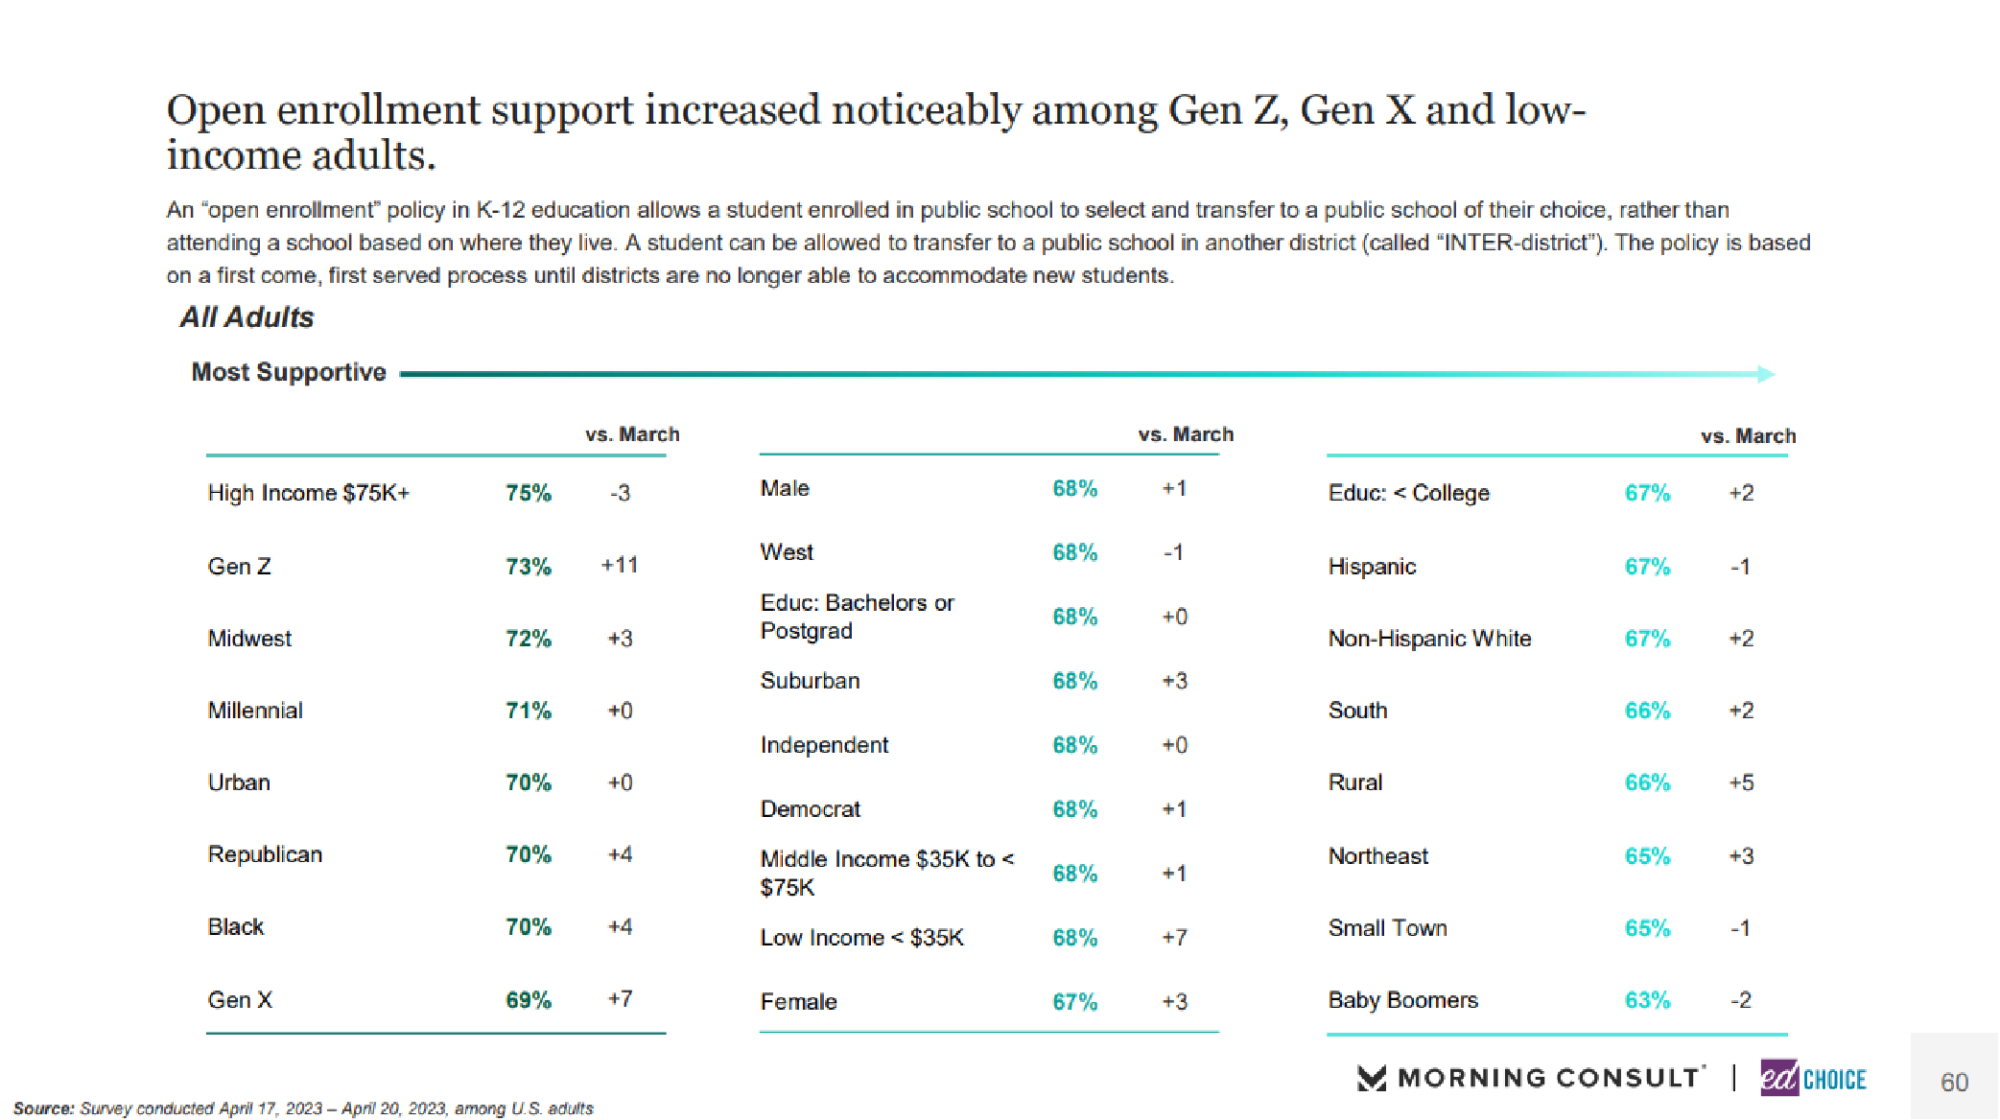
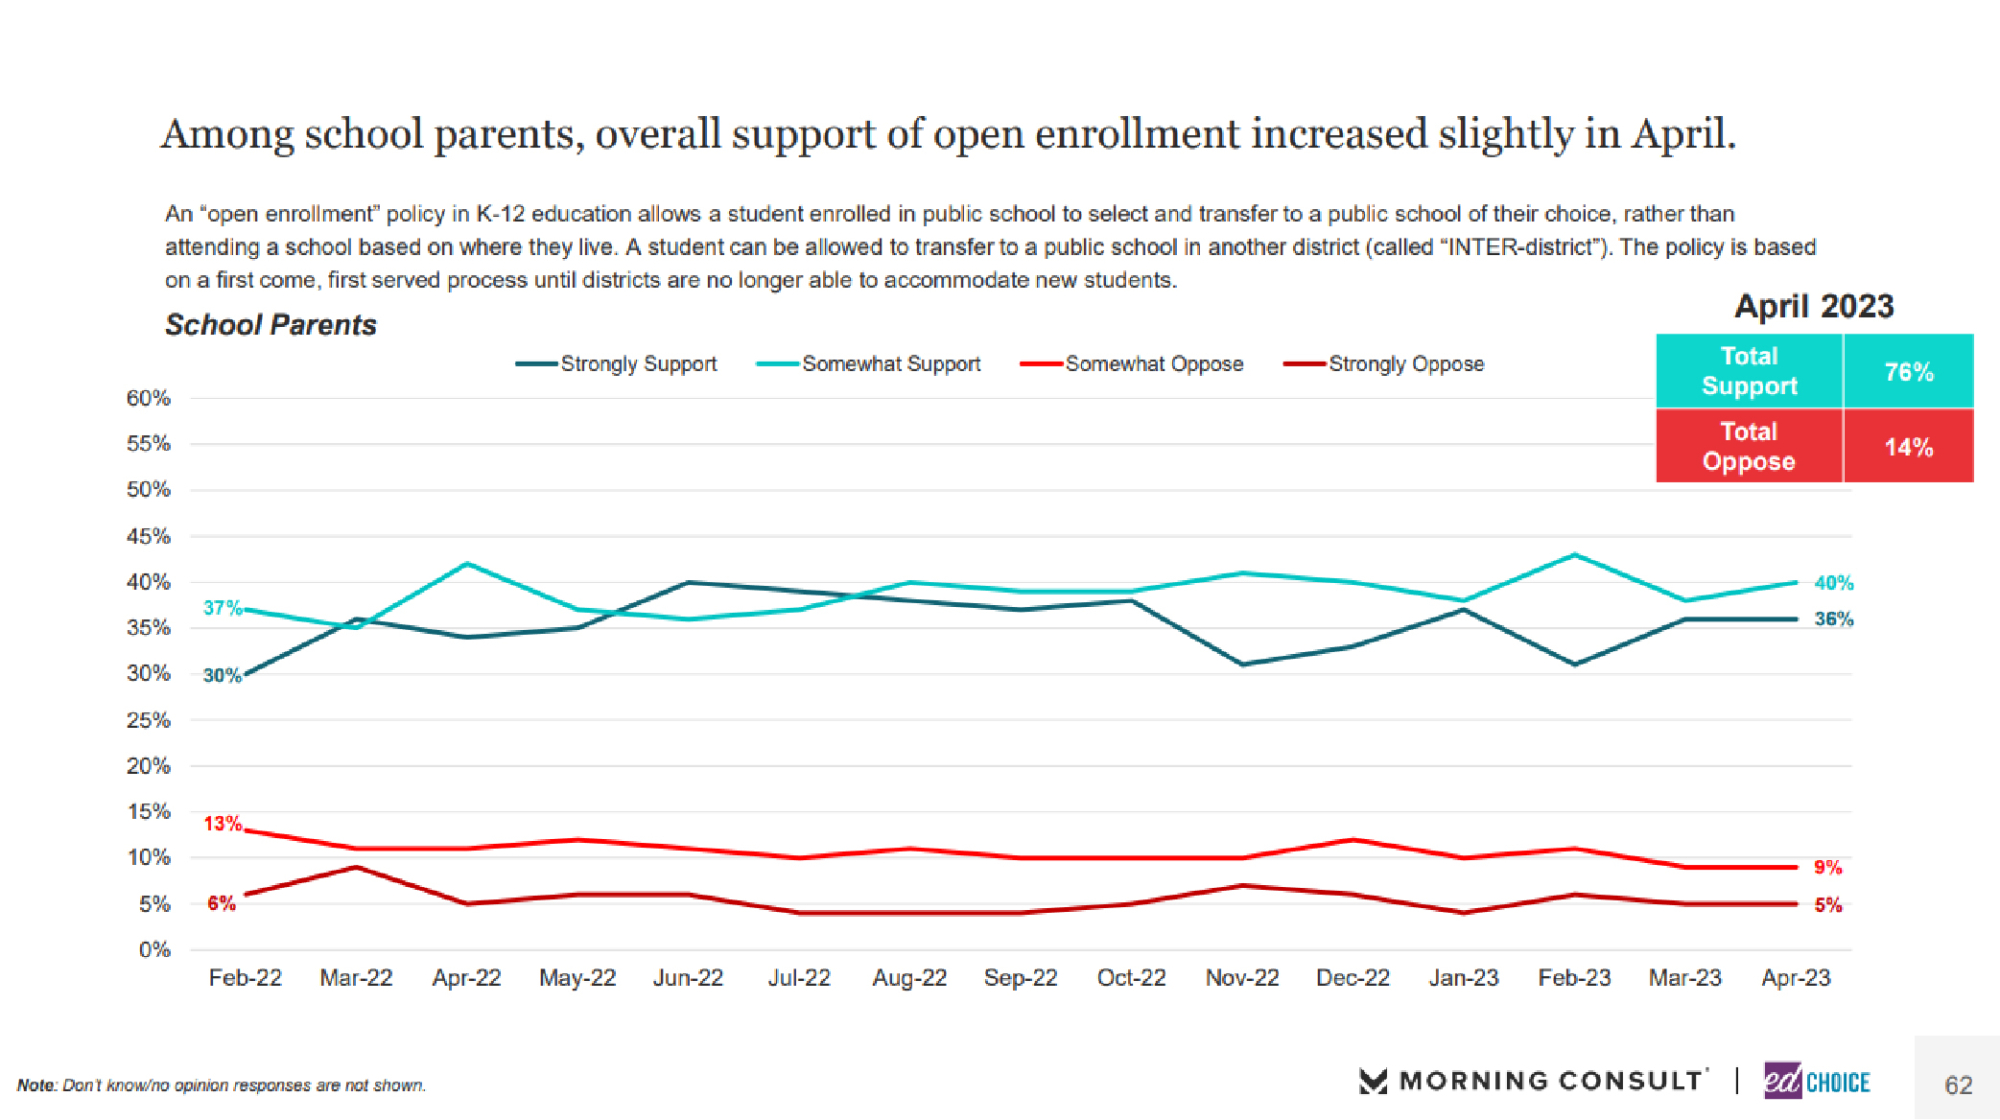
8. Support for school choice policies remains strong in April. The effect of information when it comes to school choice policies remains significant, as well. For example, education savings accounts (ESAs) are supported by 70 percent of Americans when given a brief description of the program, while support drops to 42 percent without any description provided. Nearly four in five parents support ESAs, while roughly three in four parents support vouchers, charter schools, and open enrollment. Dissecting favorability for ESAs, there is a wide range of demographic support for the program. For instance, both democrat and republican respondents show strong support for ESAs (72% for each). The same can be applied to rural and urban respondents, as two-thirds of each group support ESAs.
Visit the EdChoice Public Opinion Tracker site to access past reports, crosstabs, and questionnaires. We update our national and state dashboards every month. We also provide a more in-depth description of our research and survey methods.
Our K–12 education polls archive is updated on a rolling basis, roughly a few times each month. Please don’t hesitate to let us know if we are missing any surveys, or if there are accidental errors.