The Top 10 Findings from EdChoice’s 2021 Schooling in America Survey
Schools sit in the crosshairs of American politics. All eyes turn to the 2021–22 school year as K–12 education institutions across the country enter their third academic year responding to the COVID-19 pandemic. They also emerge out of a summer of bitter conversations about curriculum and the relationship between politics and the classroom.
At EdChoice, we set out to assess what Americans and, in particular, parents of school-age children think about COVID-19, K–12 education, their personal experiences, and public attitudes on policies that affect schooling.
Enter the 2021 edition of our Schooling in America (SIA) survey, conducted in partnership with Braun Research.
Who We Polled
From mid-June to early July, we surveyed the general public and parents of school-age children. We oversampled the latter population as well as had sample size targets for African American and Latino current school parents. As a result, we obtained nationally representative samples of American adults (N = 1,209) and current school parents (N = 1,238). In contrast to last year’s SIA polling, we focused 2021 polling on questions we have been asking for multiple years so we can emphasize the context and trendlines that began before the COVID-19 pandemic.
Schooling in America vs. EdChoice Public Opinion Tracker
Those who follow our monthly polling in collaboration with Morning Consult may wonder how SIA differs from our monthly polling via the EdChoice Public Opinion Tracker.
Loosely speaking, we add and remove several questions from our monthly tracking poll in an effort to survey the K–12 education landscape each month. While we make some modifications to SIA each year, this survey’s primary focus has remained on Americans’ educational priorities, satisfaction with K–12 education and opinions on school choice policies. Narrowing the scope allows us to delve deeper into those issues, painting for a more detailed picture of public opinion on important, evergreen education topics. Because we’ve conducted SIA since 2013, we also are able to evaluate how opinions have evolved over time. Those annual trends allow for broader historical context for us to consider the results we see this year.
Other distinctions involve methods. Our monthly polling with Morning Consult uses a single mode (online), whereas Schooling in America employs a mixed-methods approach using both online and phone. We believe there are advantages of having the surveys differing a bit on methods and conducted by two different, highly reputable survey research partners. That allows us to have a more holistic assessment of common topics and questions found in both surveys.
One Point of Clarification
We need to add one point of clarification before moving on to some key findings from 2021. In 2020, there were two waves of Schooling in America surveys. We conducted the first wave in Spring 2020, from May 17 through June 2, and the second wave later that fall, from September 30 to October 20. When we illustrate trend data below and in this years’ report, the year 2020 always references that Fall wave.
Top 10 Key Findings
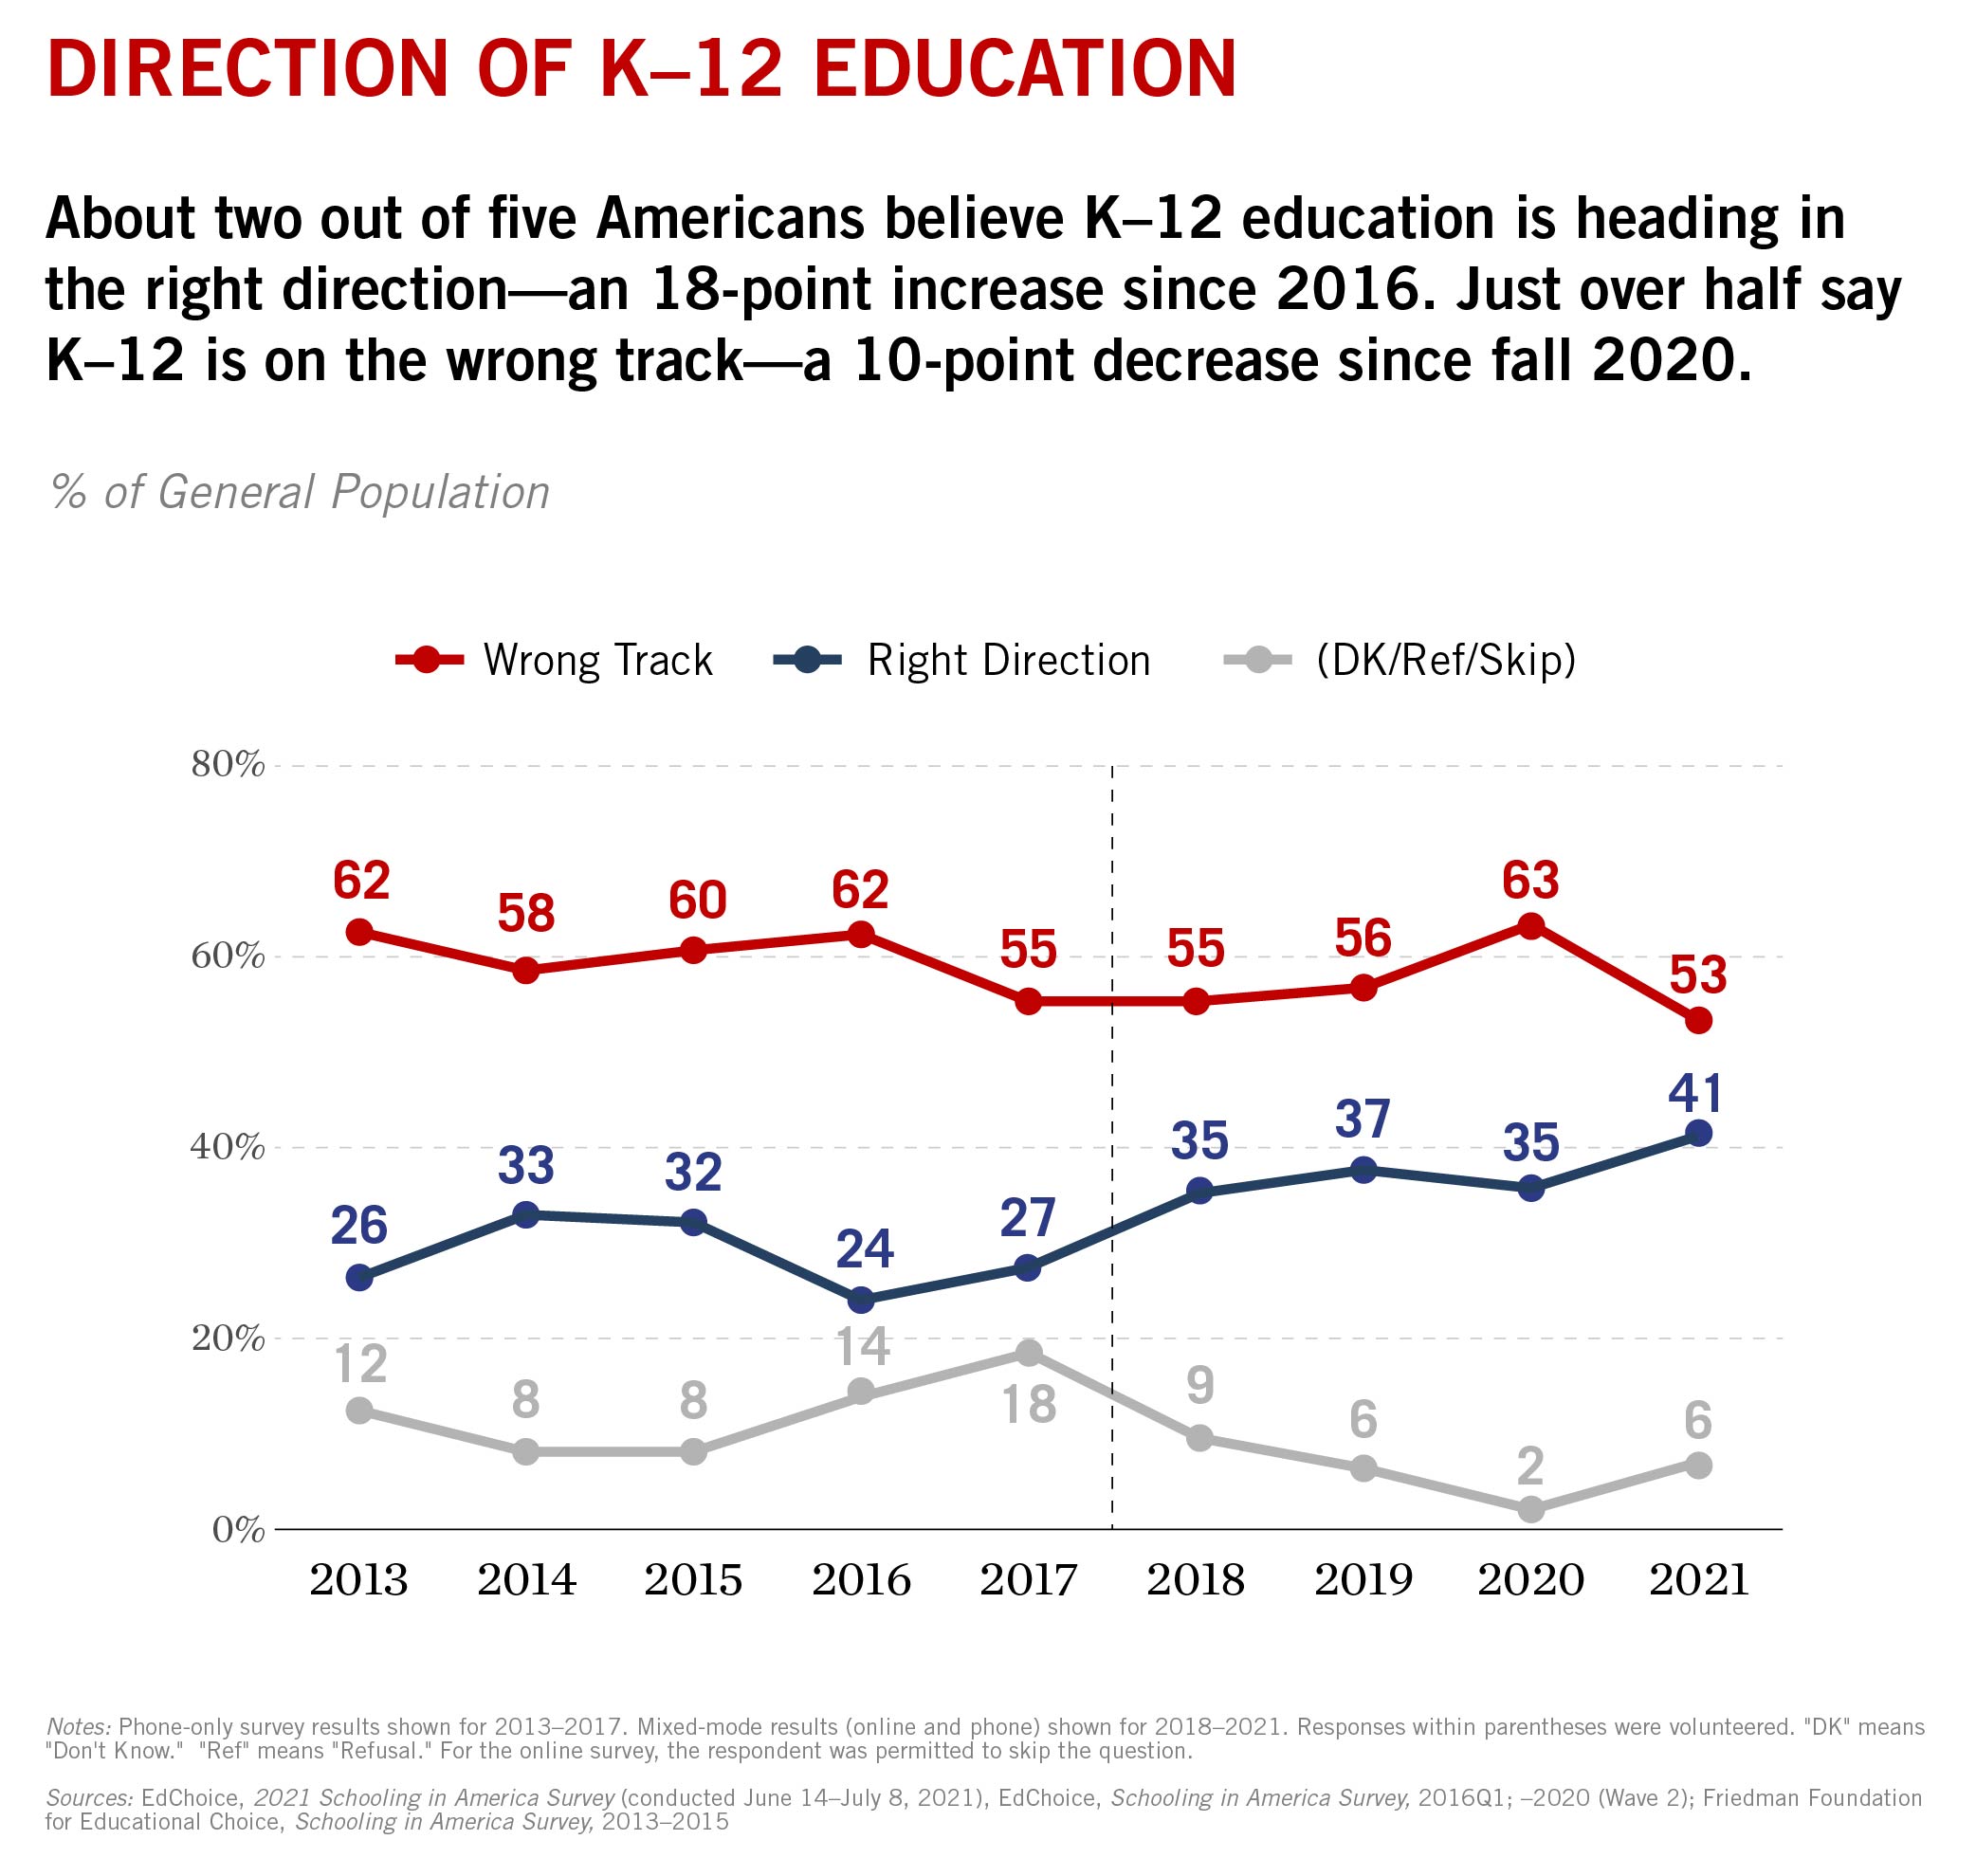
1. The general public is more optimistic about the direction of K–12 education than it was last year, but parents have a slightly more pessimistic outlook.
We asked parents and the general public about their perspective of the K–12 education generally. Forty-one percent of the general public said K–12 education was heading in the right direction, while 53 percent said it was off on the wrong track. This year marks the highest positivity and lowest pessimism about the direction of K–12 education among the general public since we began SIA.
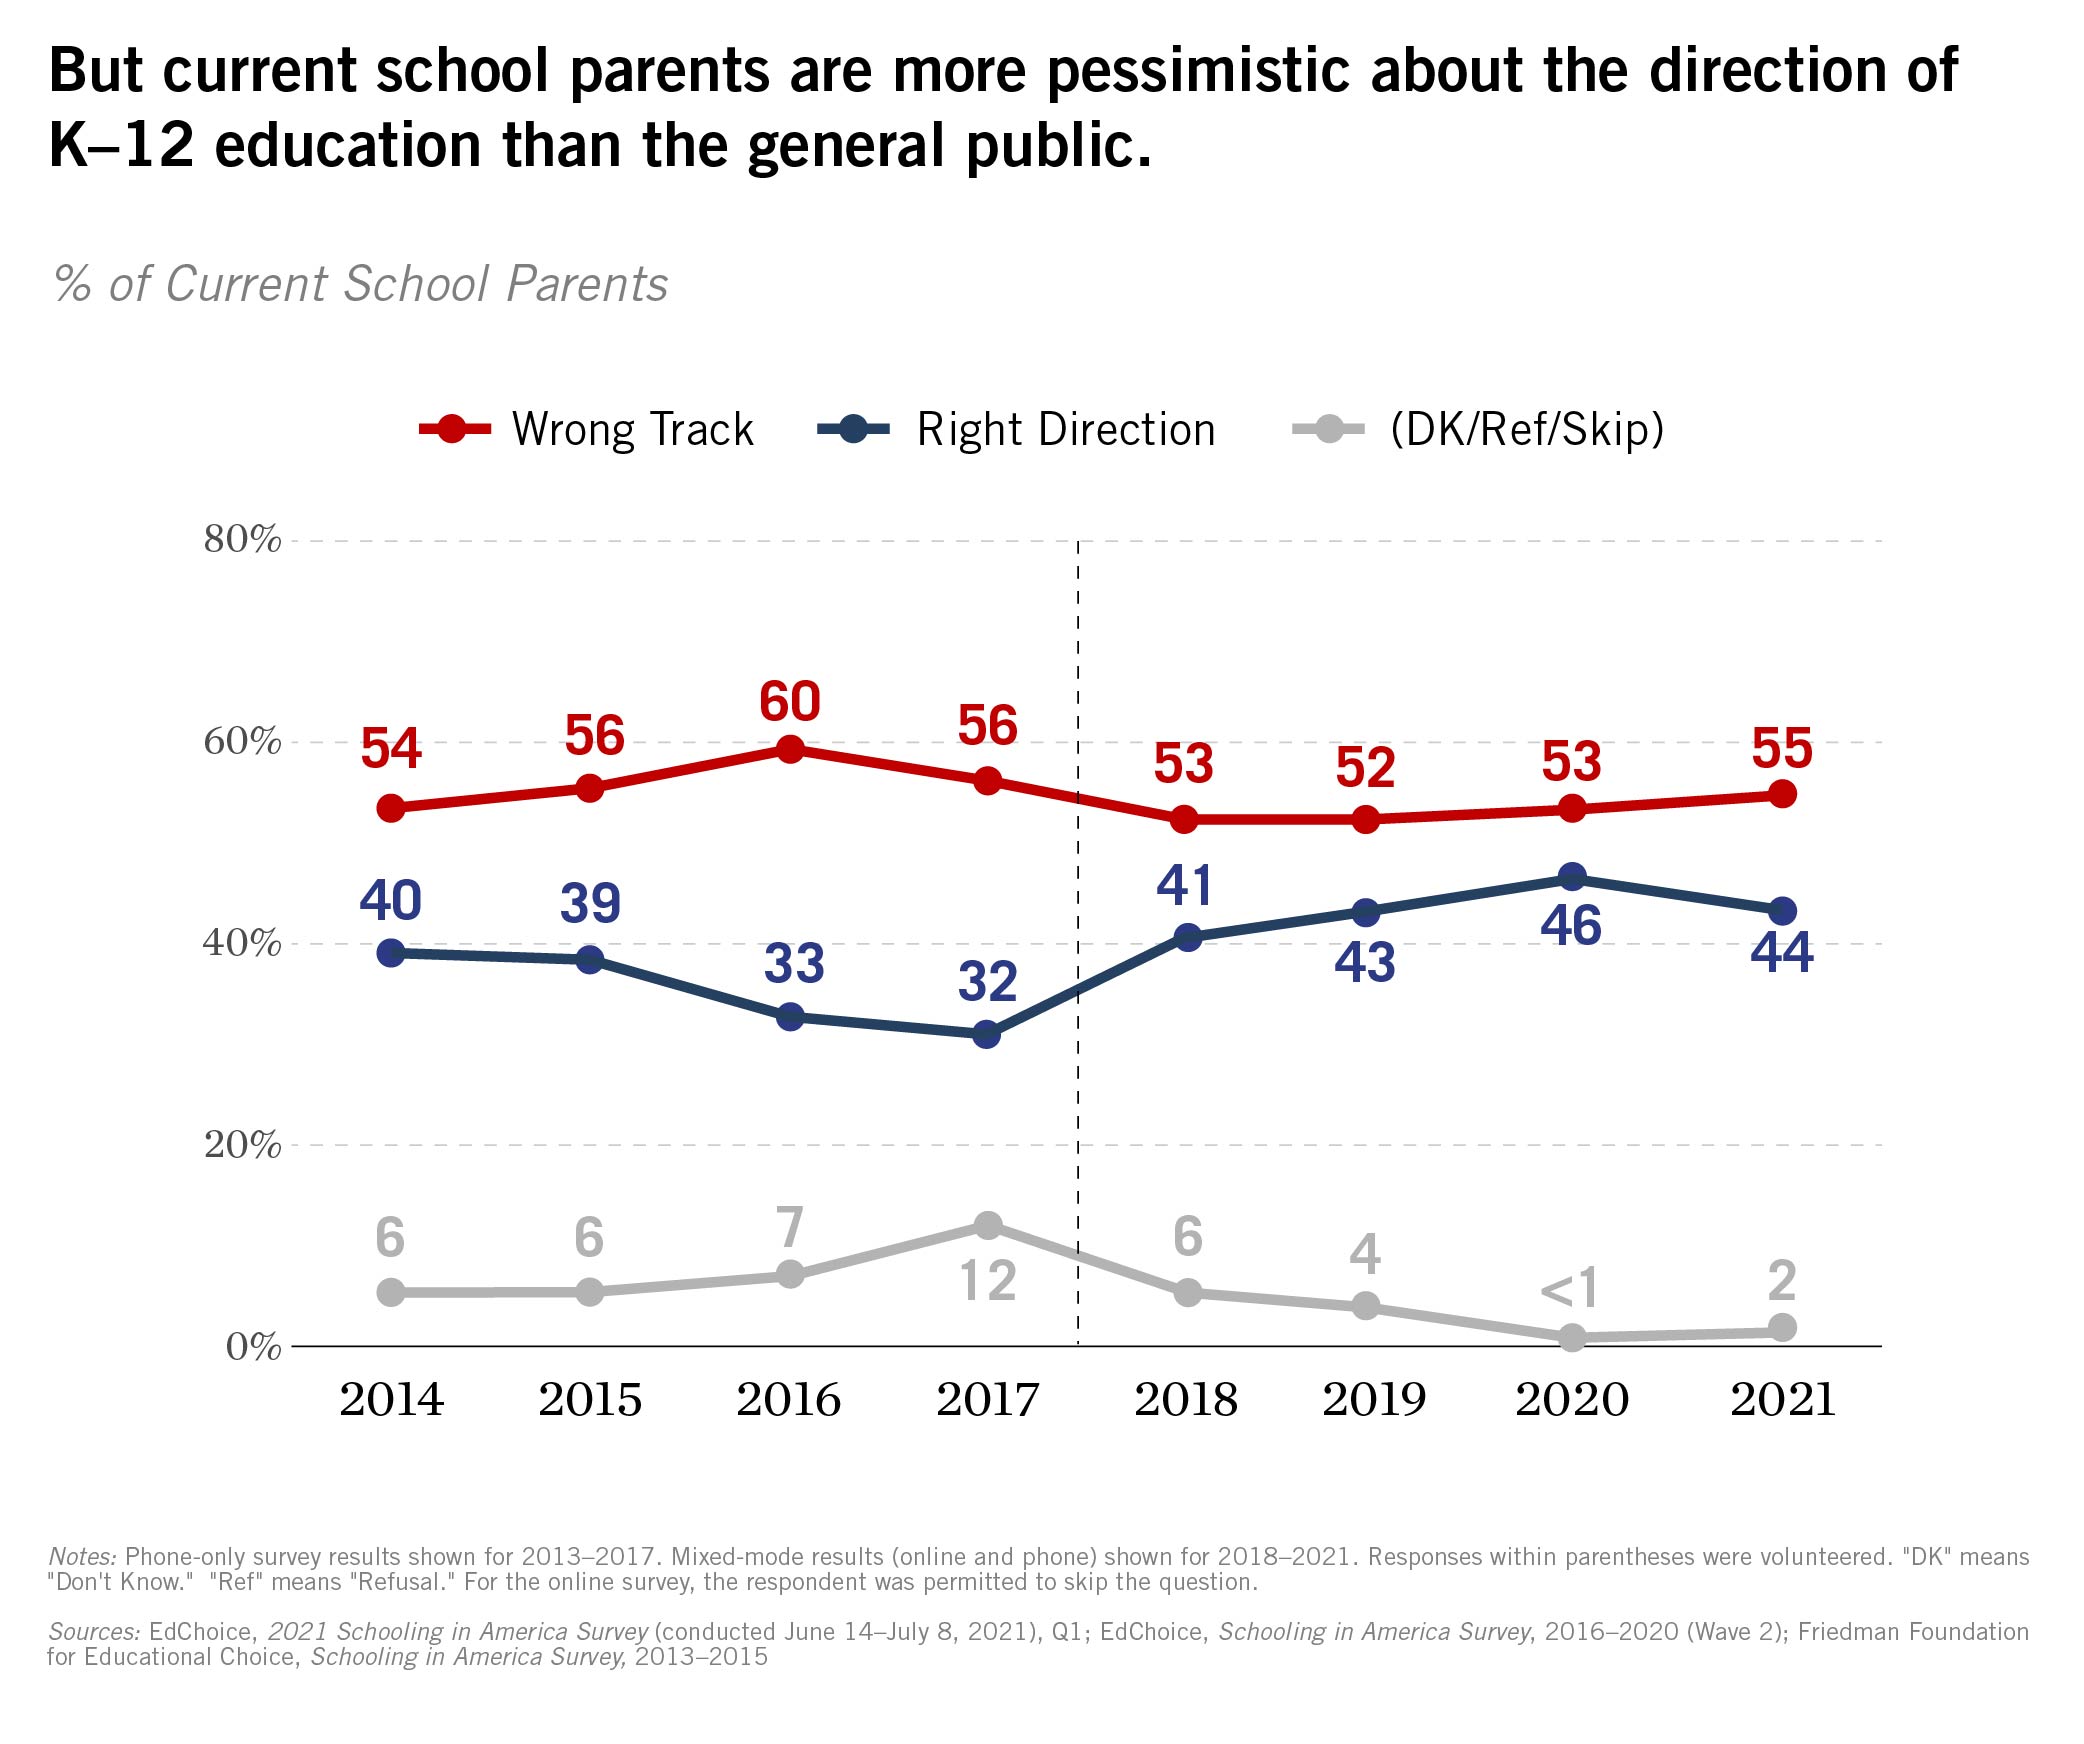
Parents were more polarized. More of them said education was heading in the right direction (44%) and that it was off on the wrong track (55%) than the general public. Compared to the general population, parents’ feelings on the overall direction of K–12 education has remained relatively consistent, especially over the last five years. That said, while the general population saw a sizable 10-point decrease in “Wrong Track” answers, parents had a slight two-point uptick.
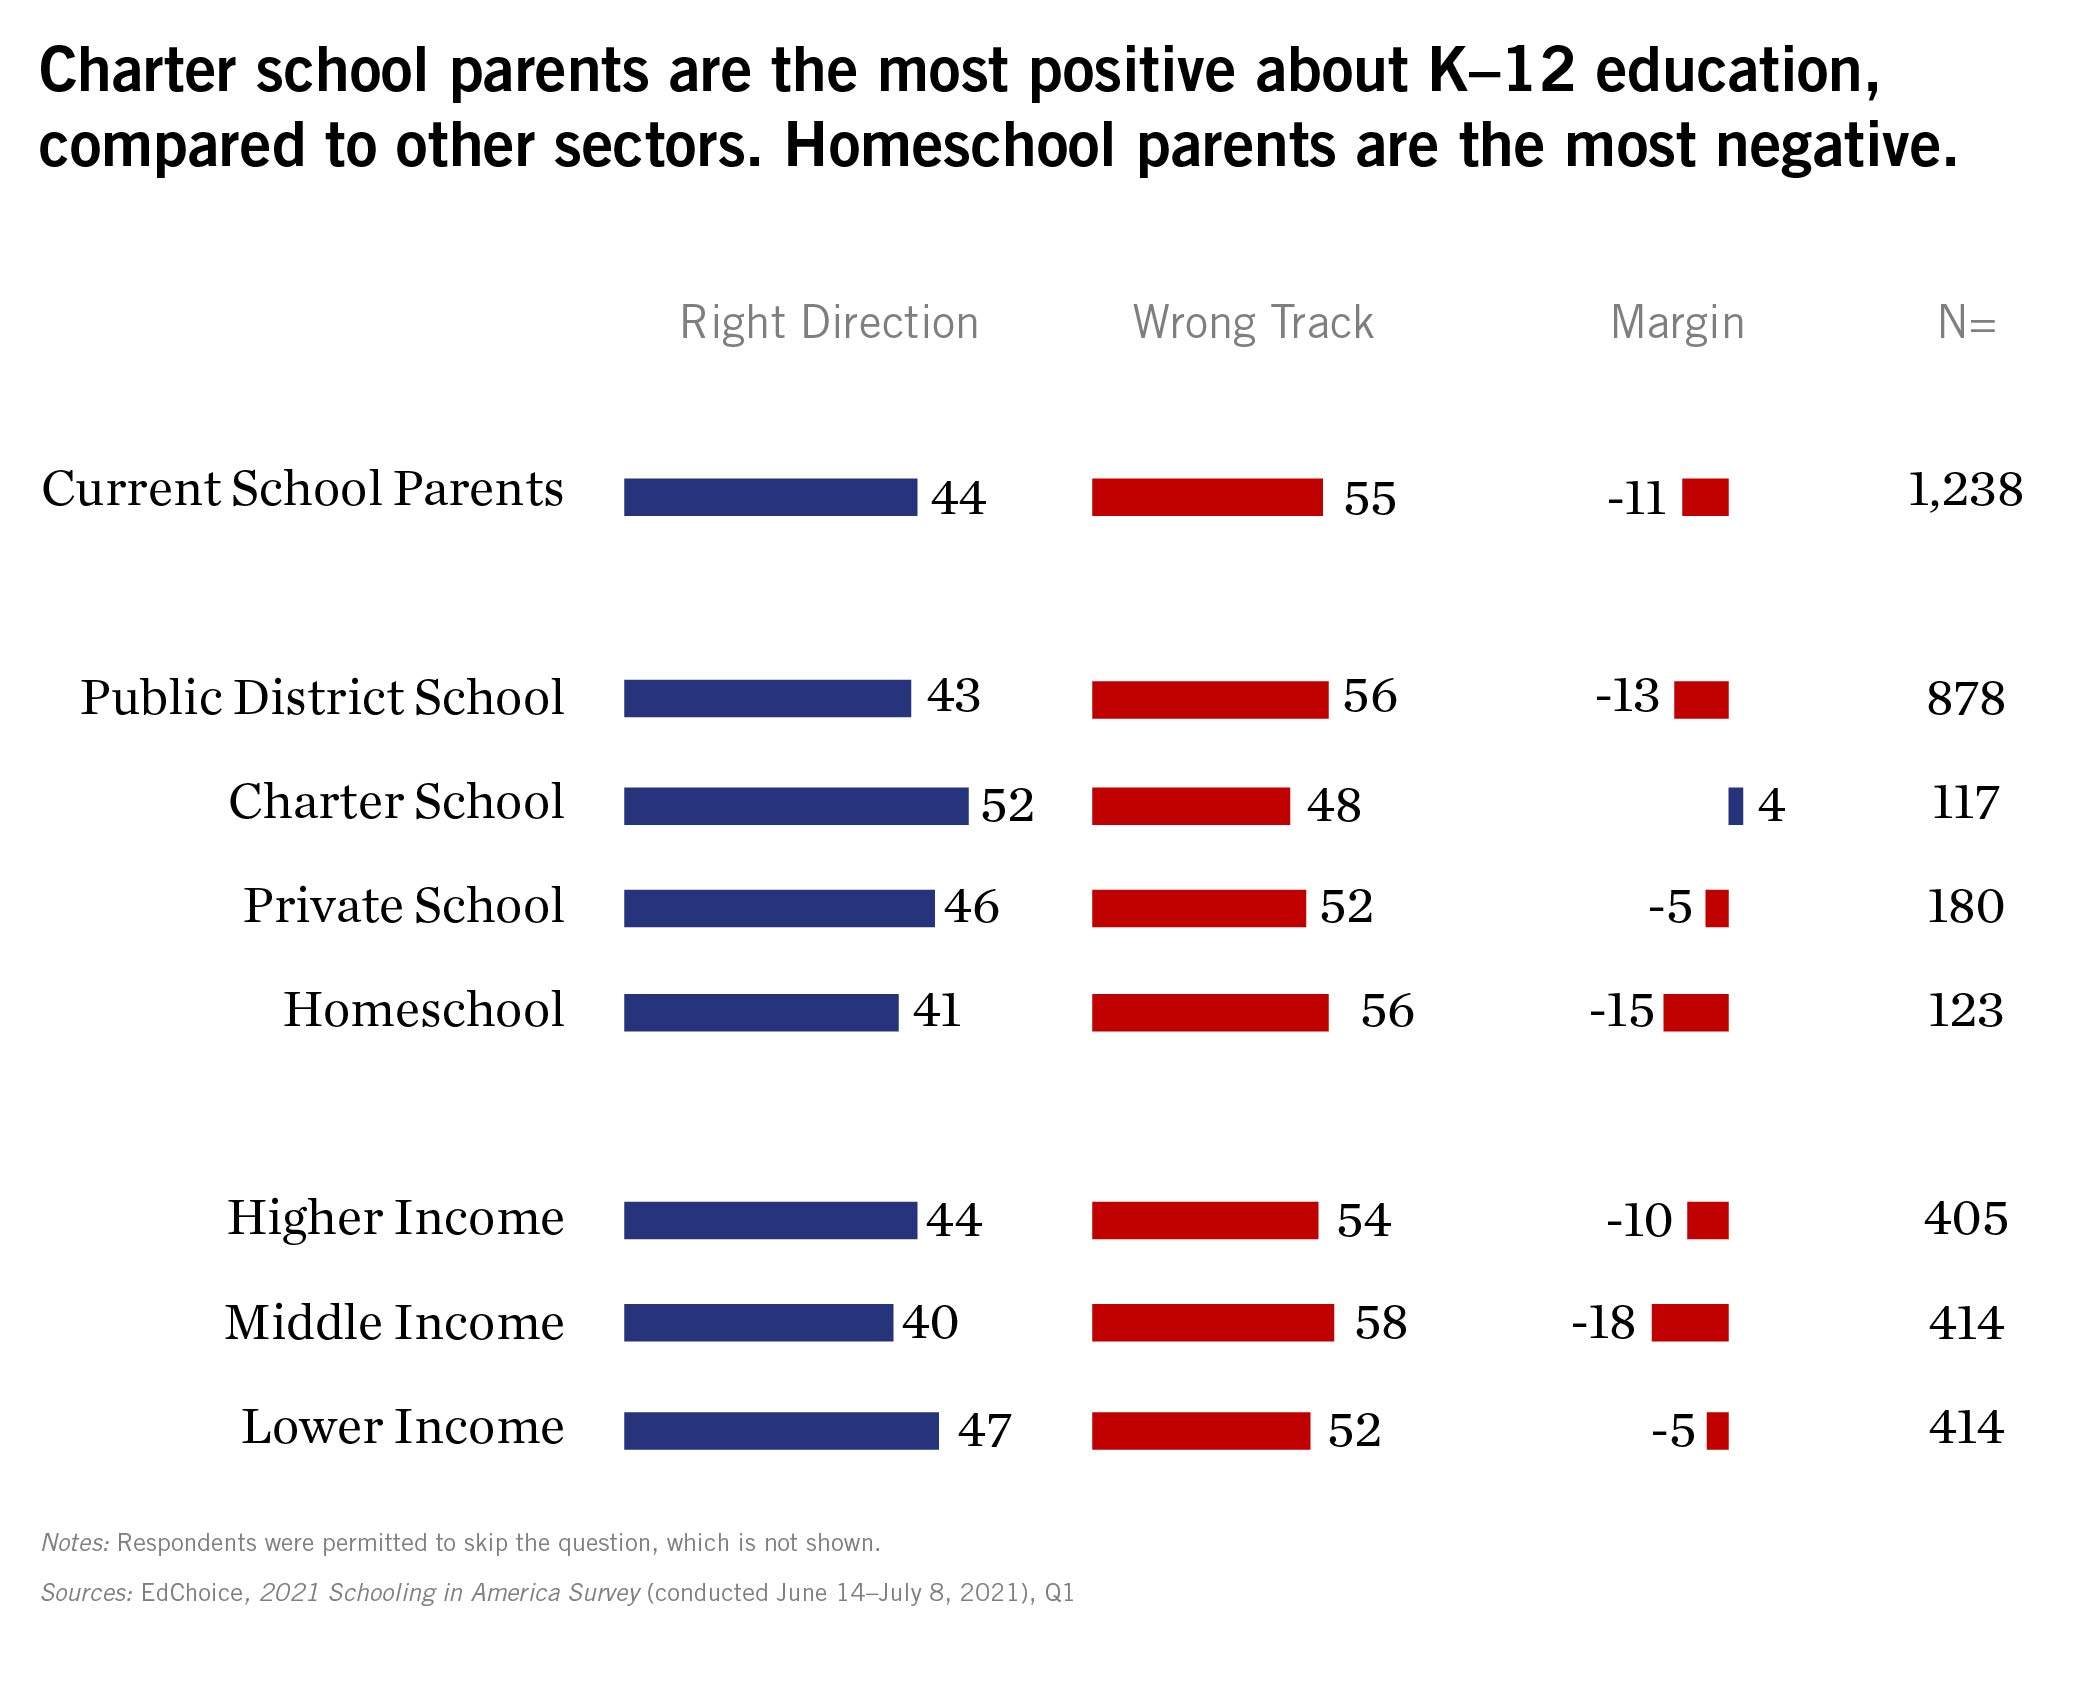
The type of schools children attended appeared to have an effect on parents’ perception of K–12 education. Charter school parents were more likely to be optimistic than district school and homeschooling parents.
2. School type preferences are very different than historical enrollment patterns.
The pandemic disrupted school enrollments and expectations. Some public schools lost large numbers of students and home schooling rates soared to new heights. While the National Center for Education Statistics does not have last school year’s enrollment numbers yet, it is useful to compare parents’ preferences to previous enrollments from a couple years ago.
Eighty-three percent of children were enrolled in public district schools in school year 2018–19. Less than half of that share of parents said district schools were their preferred school type. Eight percent of students were enrolled in private schools; 6 percent in public charter schools; and 3 percent were homeschooled. In comparison, 36 percent of parents ideally preferred private schooling for their children; 14 percent preferred charter schools; and 12 percent preferred homeschooling.

Homeschooling was most likely to be preferred by a lower-income parent. Middle-income parents favored private schooling notably more than other school types, and higher-income parents preferred district schools and private schools almost equally.
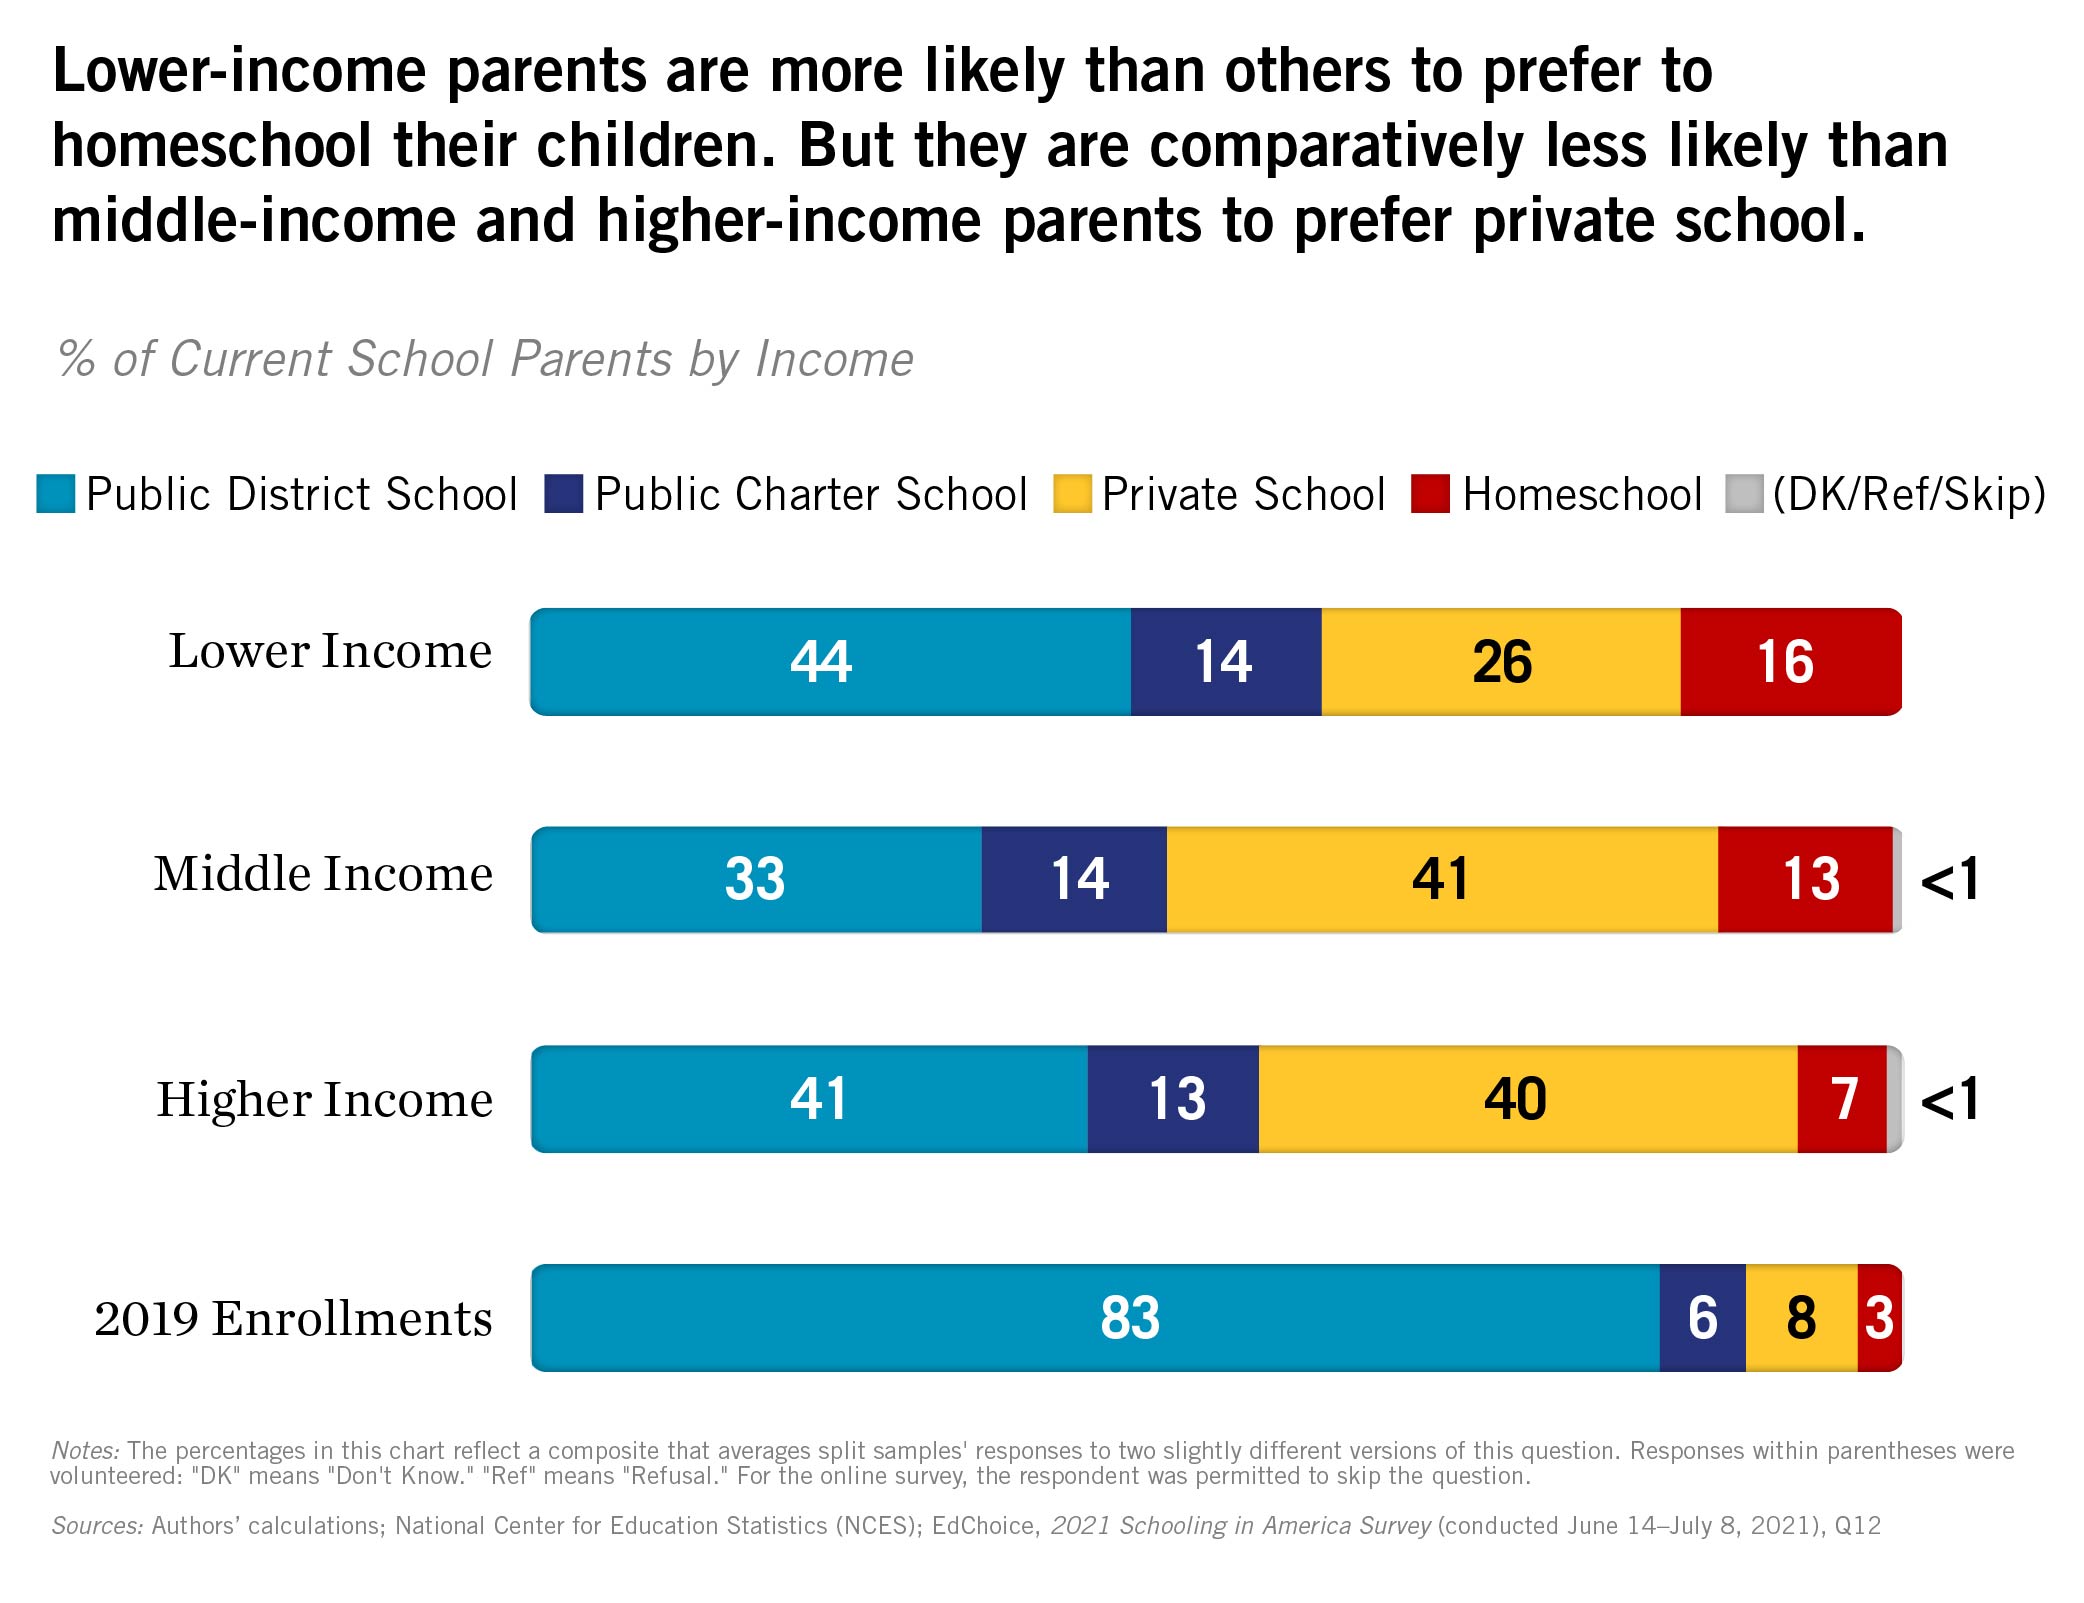
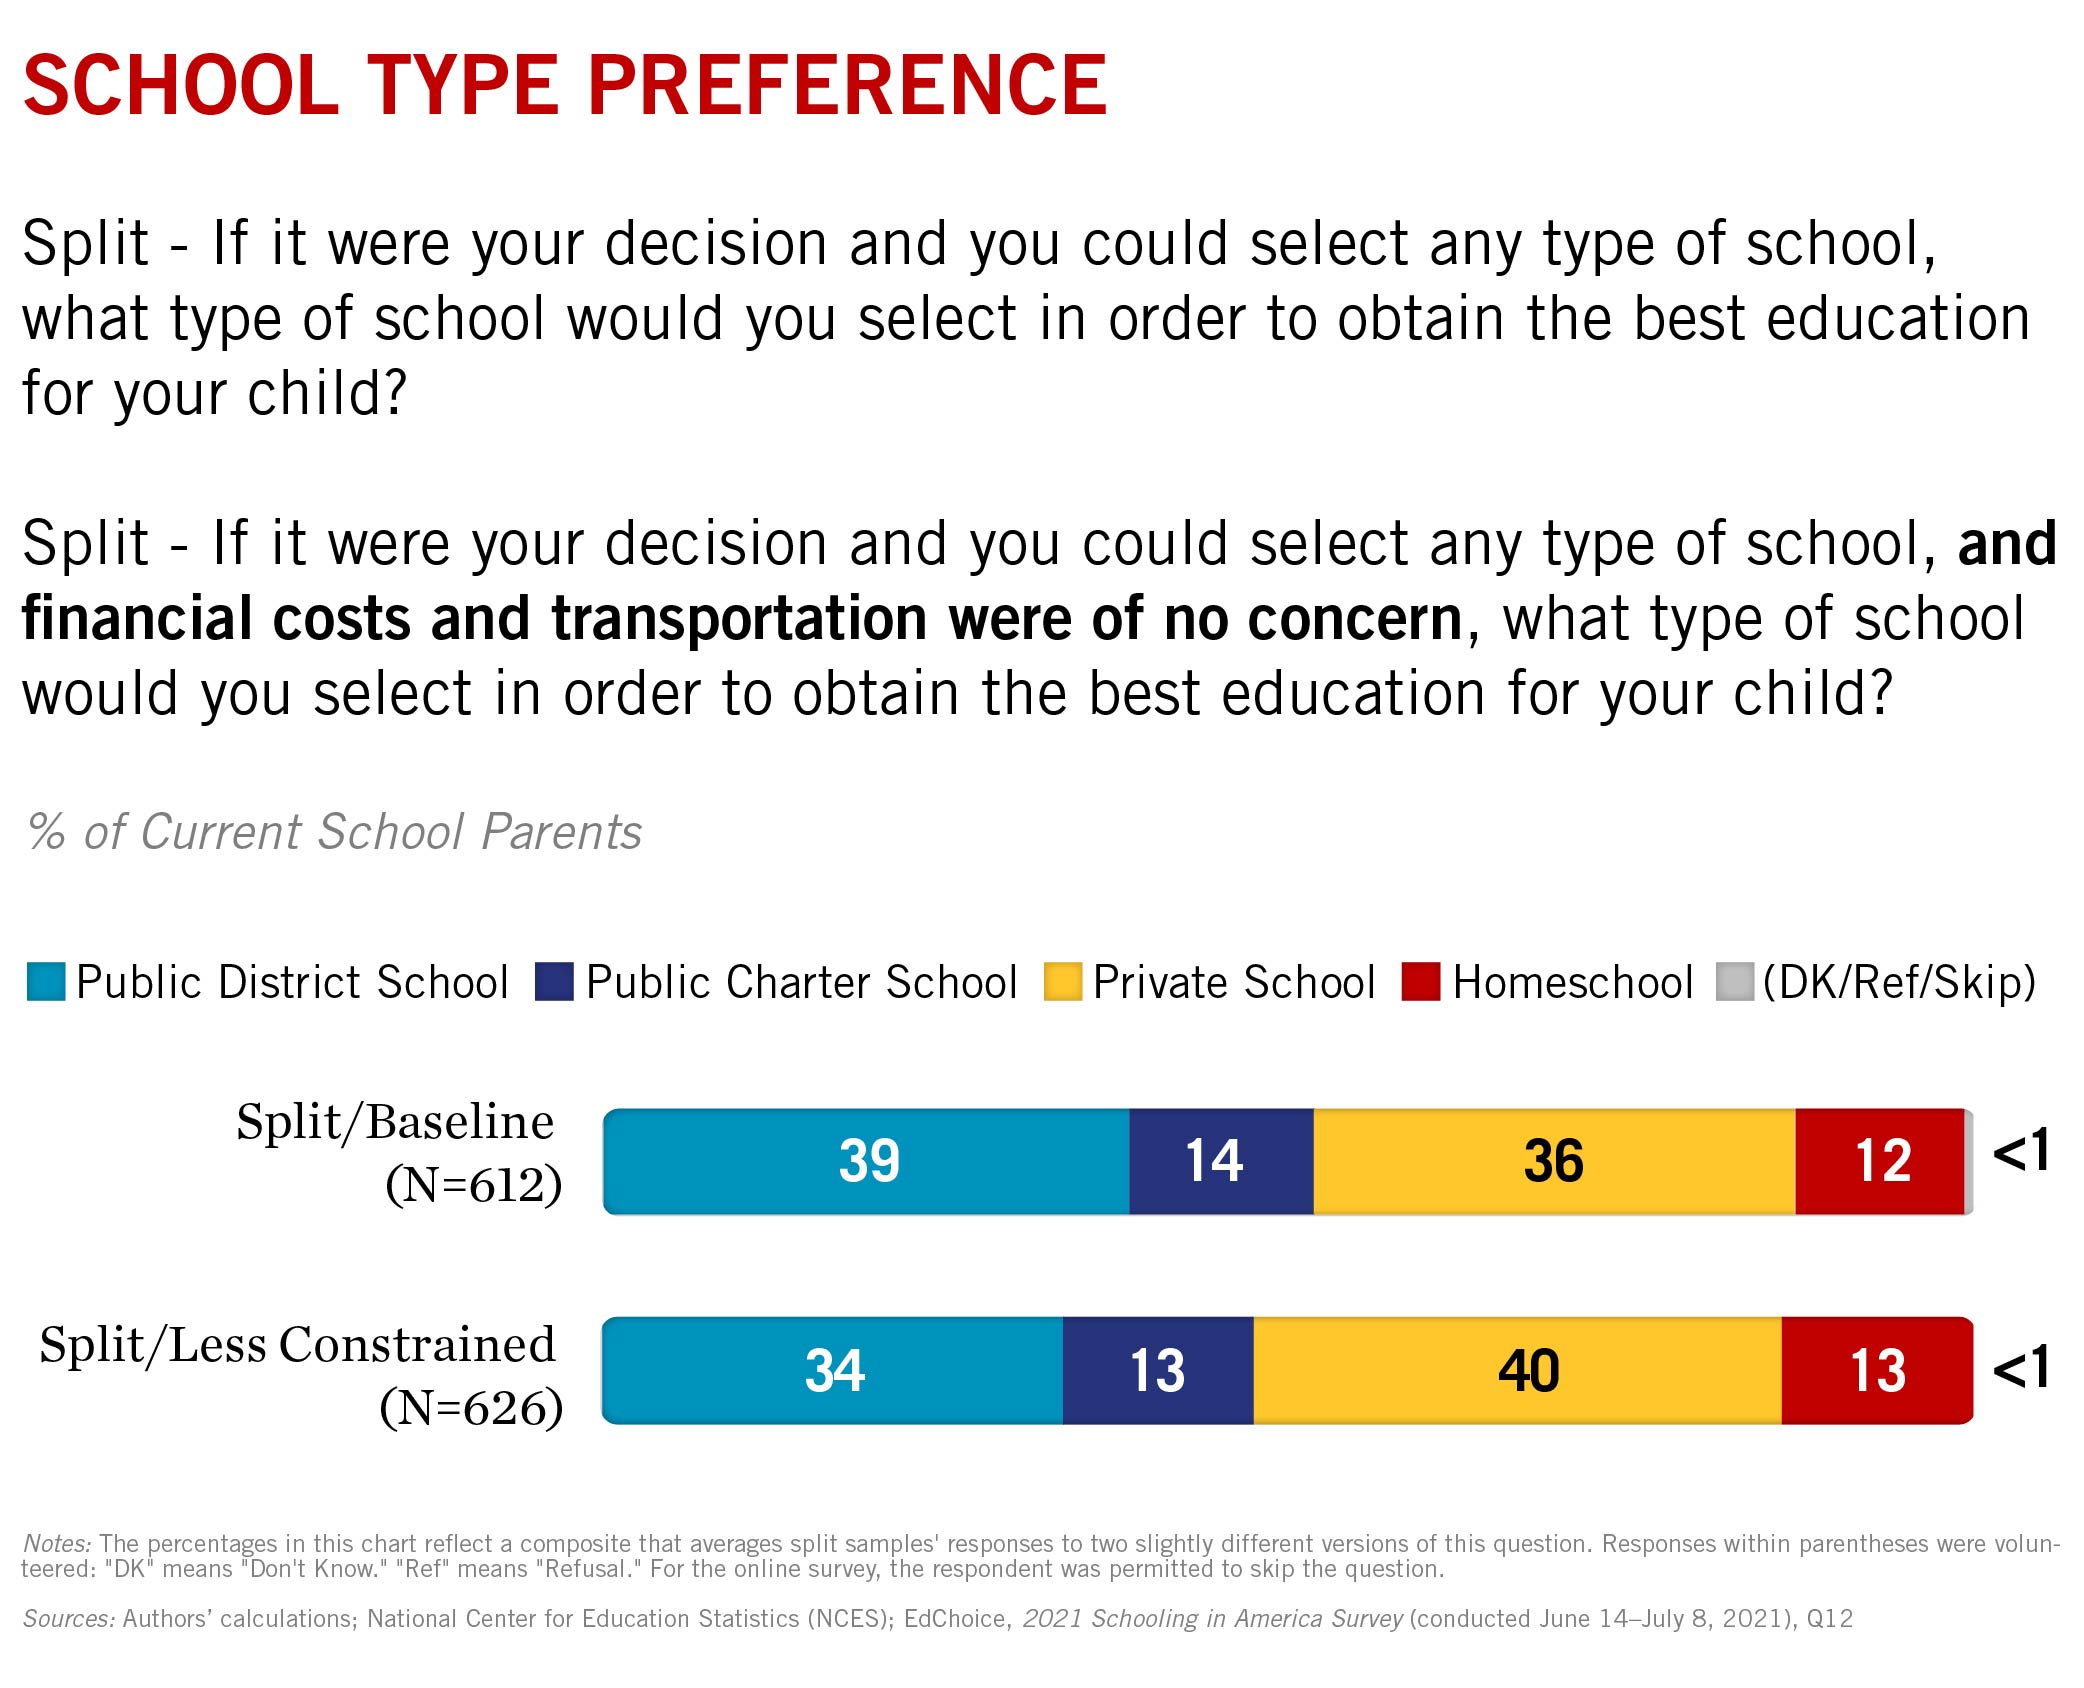
In a split-sample experiment, we learned parents were more likely to choose a private school or homeschooling when explicitly discounting financial costs and transportation.
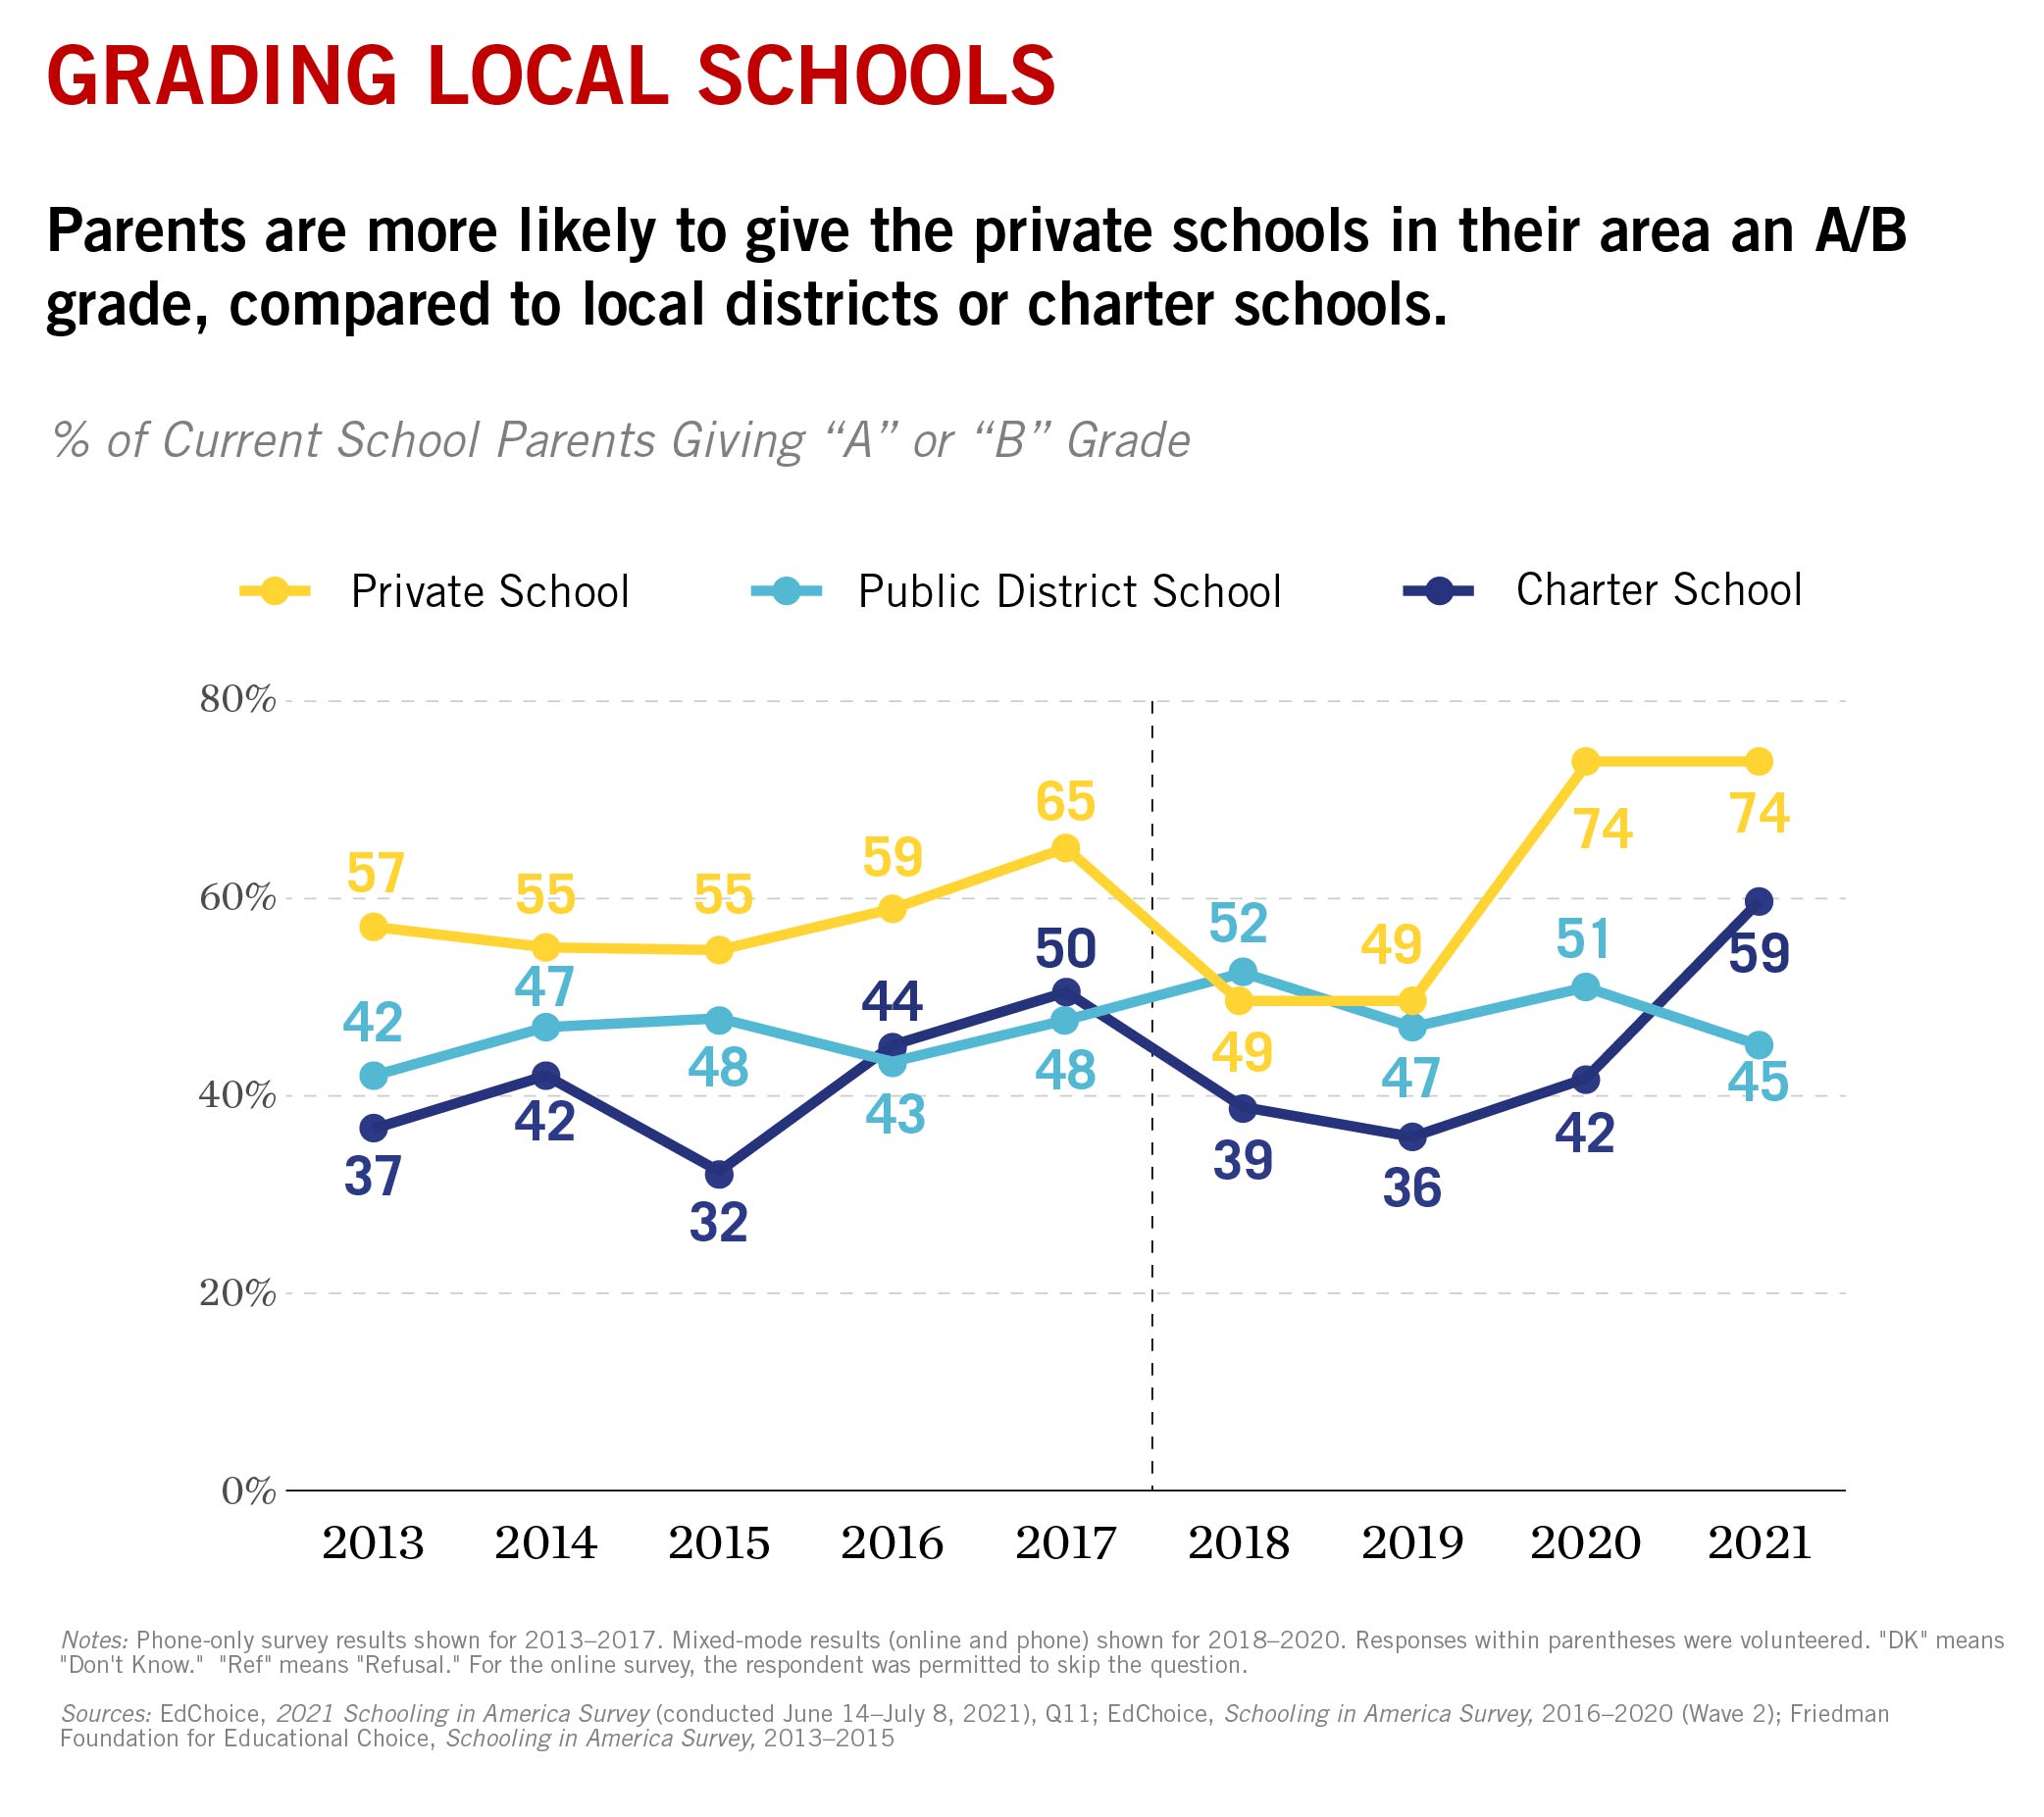
The disproportionate selection of private schools relative to public schools may be explained partially by how parents view the quality of schools in their area.
In another question we asked parents what grade they would give their local schools, as applicable (A through F). Parents were most praiseworthy of their local private schools, with 74 percent of applicable parents giving an “A” or “B.” Fifty-nine percent of applicable parents gave the same grades to charter schools, a significant jump from their 2020 results. Less than half of district schools received an “A” or “B,” substantially lower than last year.
3. Parents priorities differ based on the type of school their child attends—public district, charter, private or homeschool.
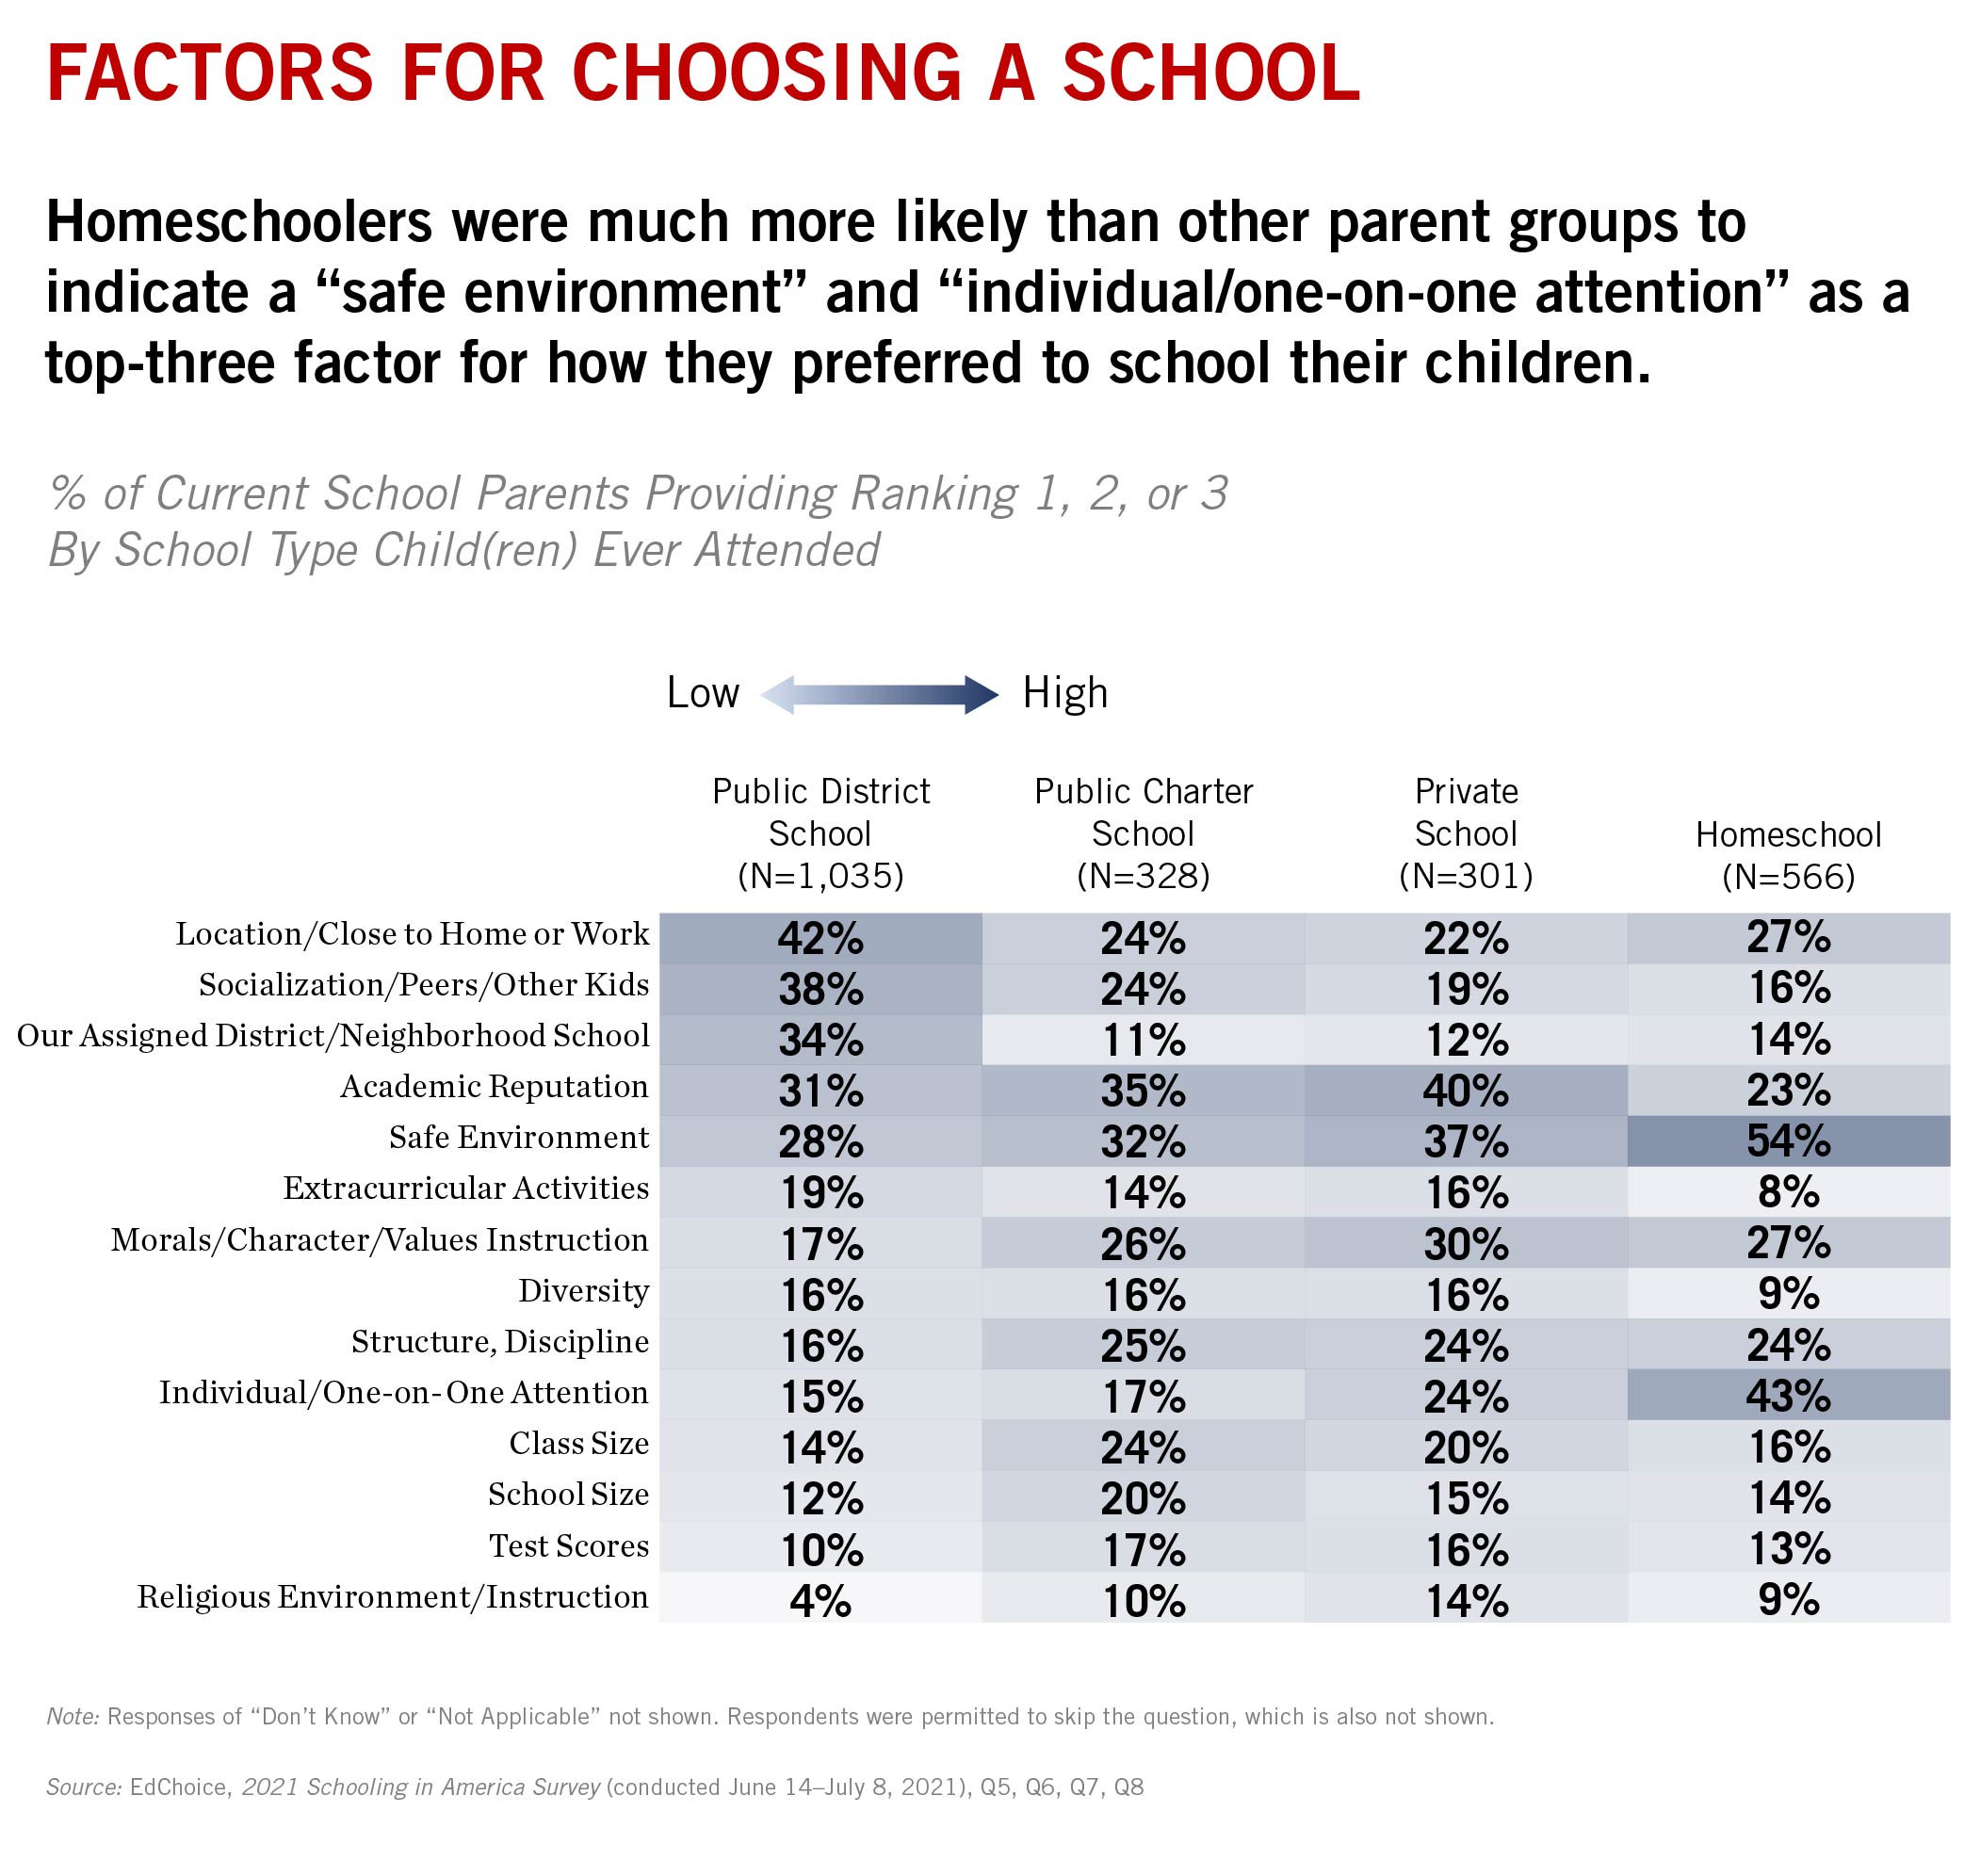
We asked parents to name the three most important factors when choosing a school. When we sorted their responses by the kind of school their children attend, we found some distinct patterns. Parents with children in district schools were most likely to mention location as a top priority for selecting a school, nearly twice the rate of private school parents. Socialization was the second most-cited reason parents select district schools, followed closely by noting that the school was assigned to their family.
Private school parents and charter school parents signaled that academic reputation was the most important aspect, followed by a safe environment and morals/character/values instruction. Homeschooling parents heavily valued a safe environment, with more than half of them placing it in their top three. Individualized attention was a clear second for homeschooling parents, while location and moral instruction were a tight third and fourth.
Despite their differences, all parents appeared to hold some values in common. At least a quarter of parents in all four categories placed safety in their top three factors for choosing a school. Academic reputation was also important across all school parents. Test scores, however, were not very important to any of the four groups.
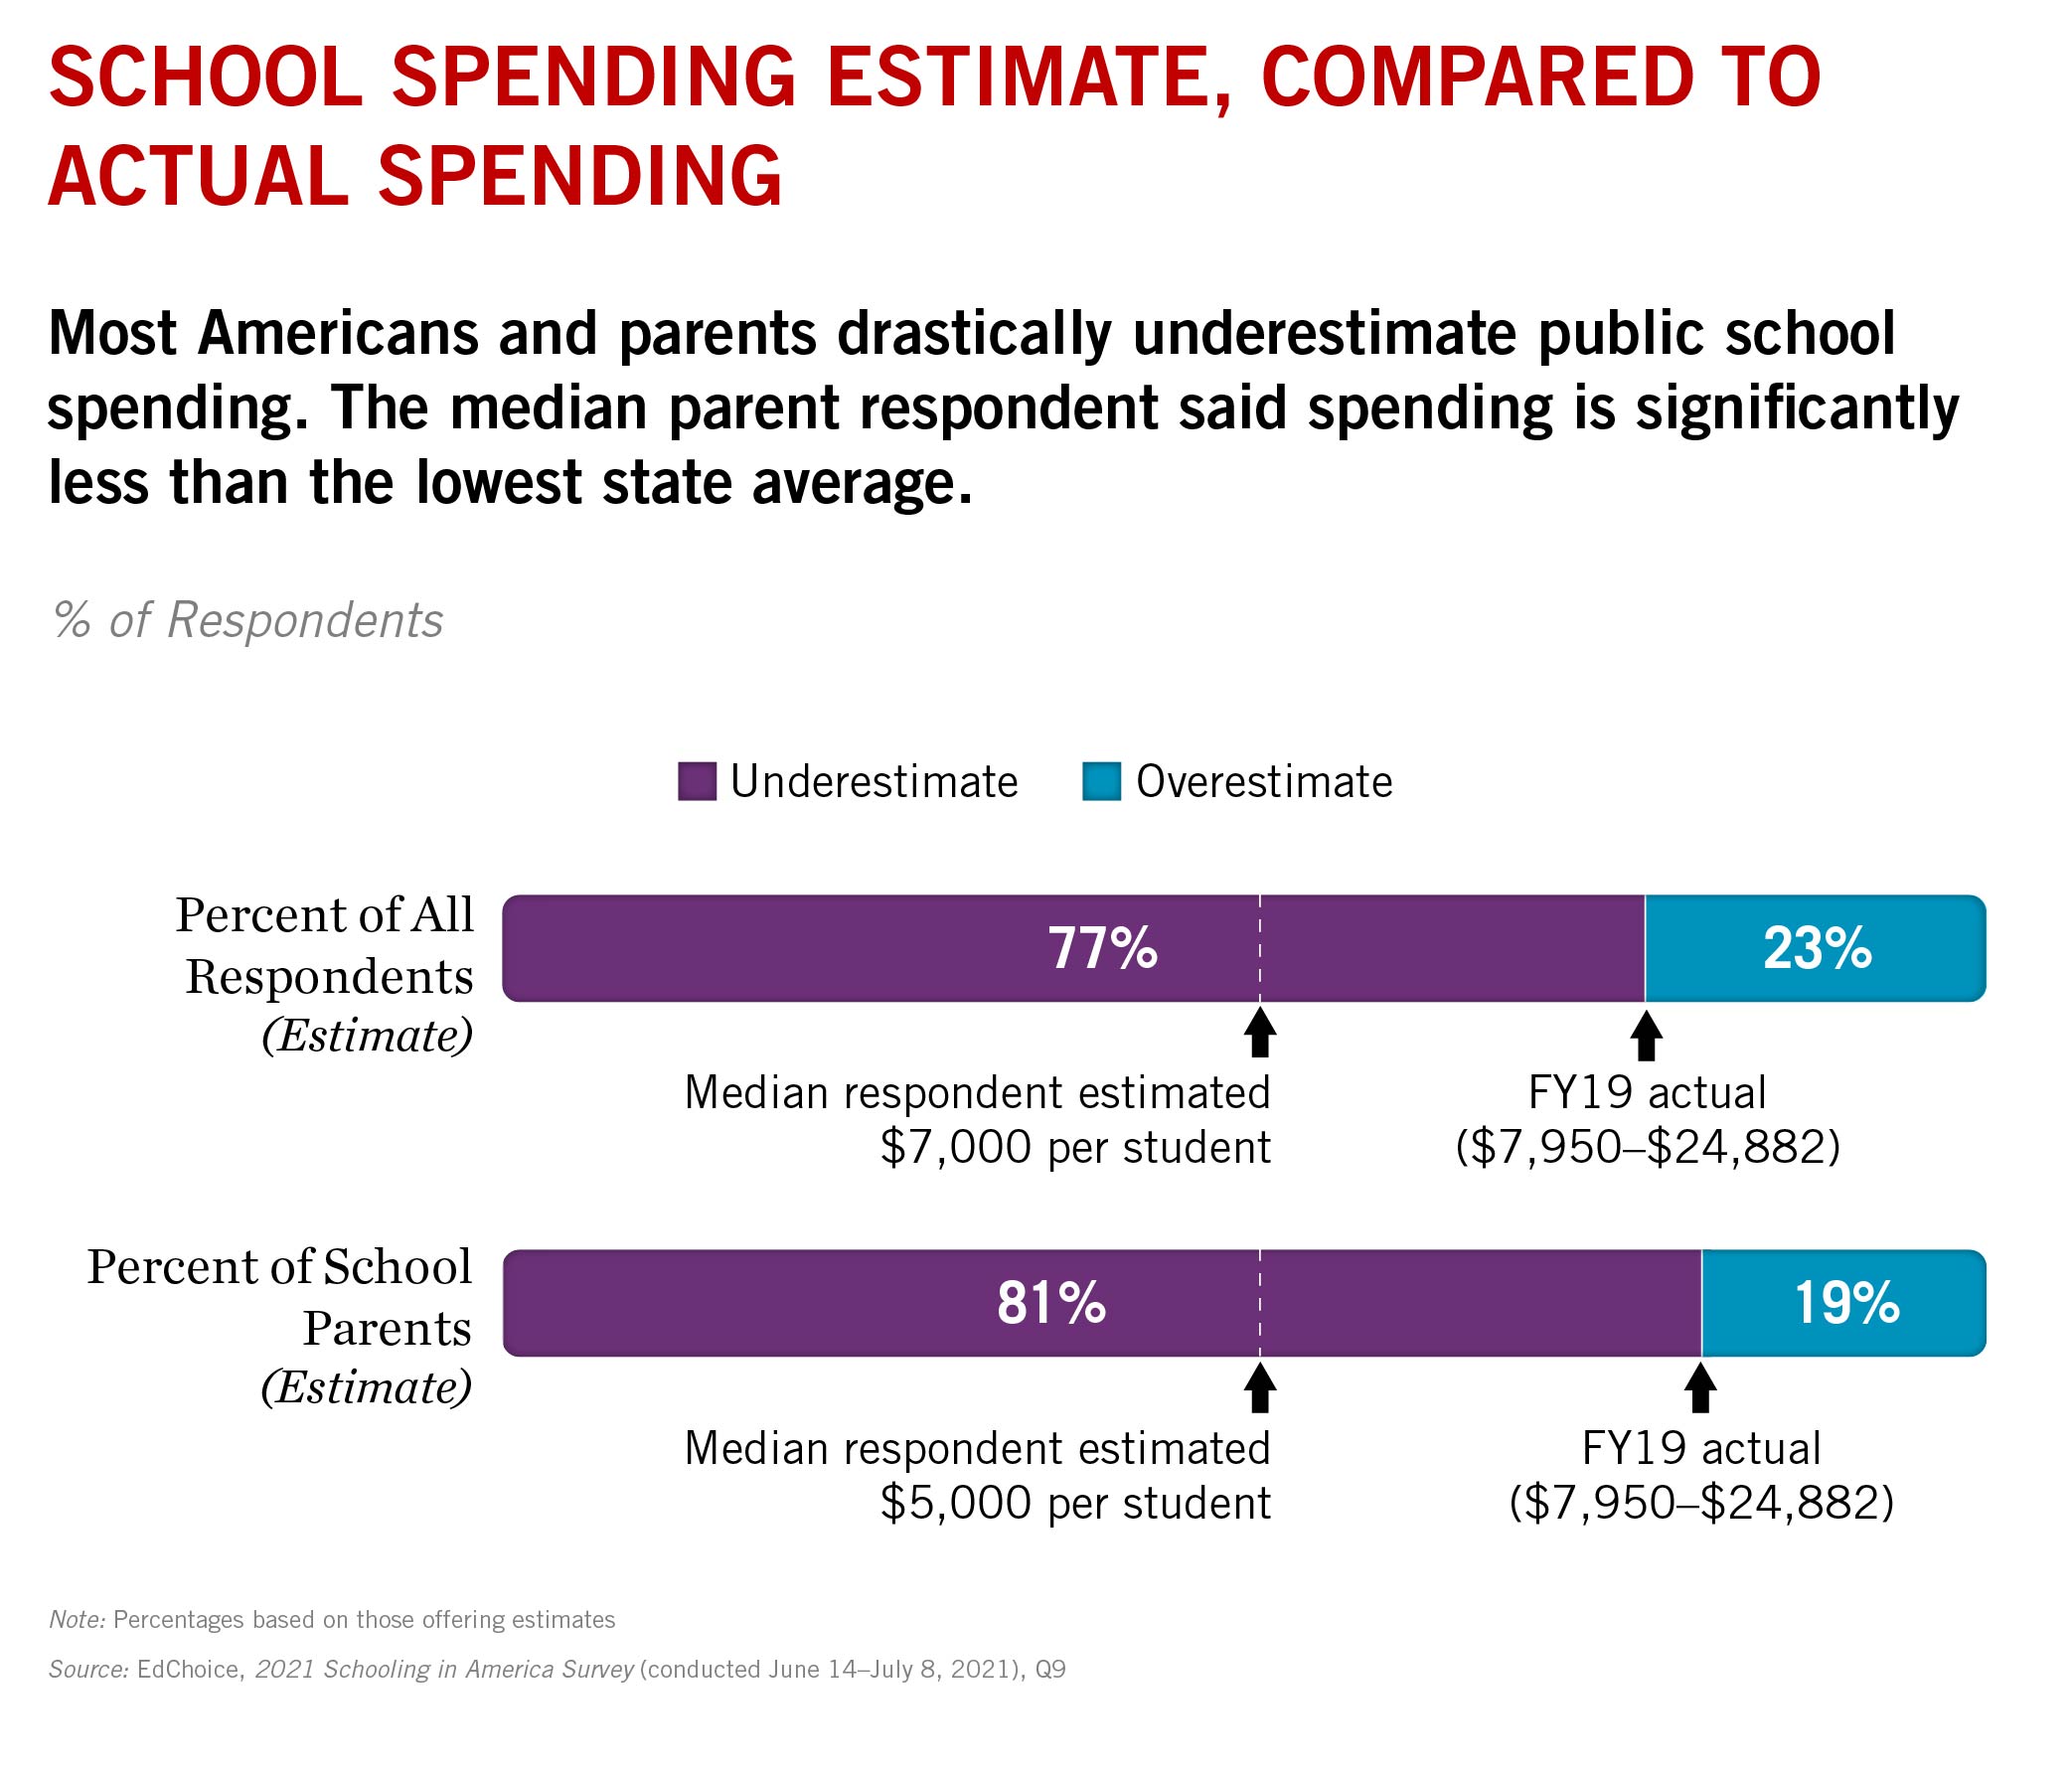
4. The vast majority of Americans underestimate how much money public schools spend.
We asked both parents and the general public to estimate how much public schools in their state spend, on average. The median person guessed $7,000 per student per year, while the median parent guessed $5,000. Taking into account the state where each respondent resides, 77 percent of Americans and 81 percent of school parents underestimated how much public schools actually spend.
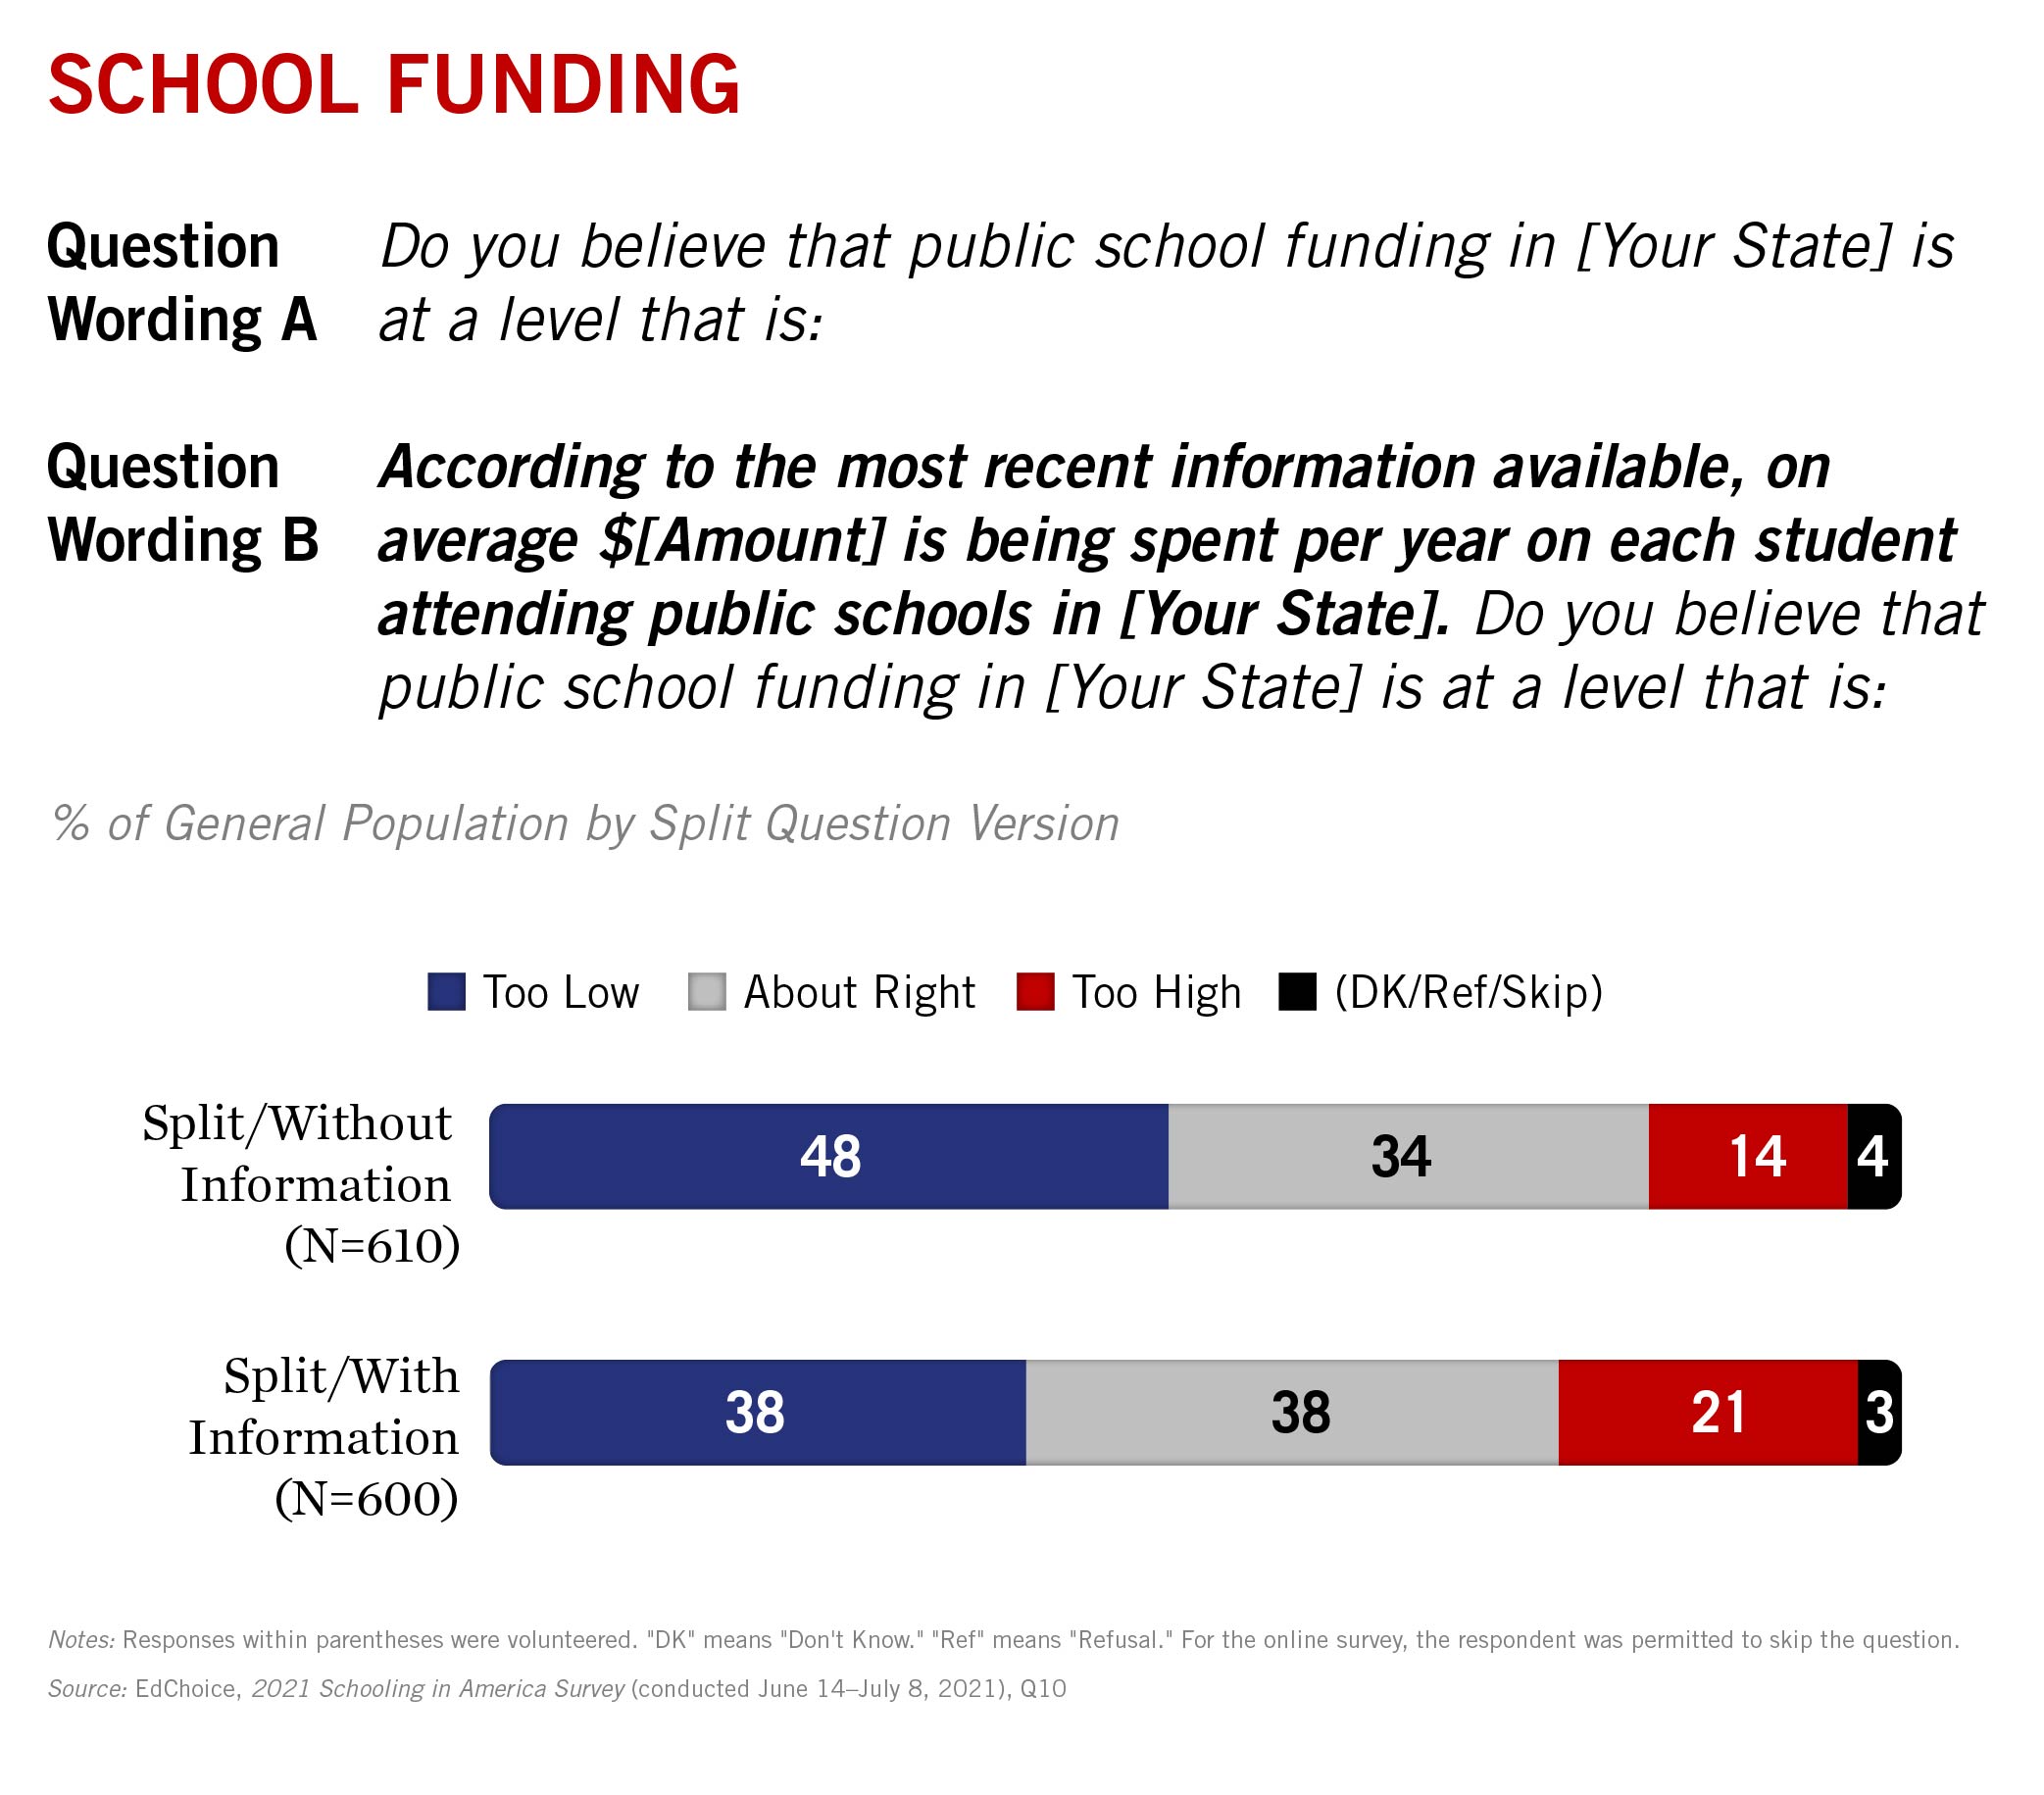
Learning the state’s actual per-student spending average appears to have some effect on people’s perceptions of school funding policy.
Our survey contained a split-sample question asking whether current school spending was too low, too high or about right. We randomized whether a respondent would learn the actual spending totals before answering. Of those who were not given per-student spending numbers, just under half said they thought school spending was “too low;” 14 percent thought it was “too high;” and 34 percent said it was “about right.” Those who saw the actual per-student spending numbers were less generous: 38 percent said “too low;” 21 percent said “too high;” and 38 percent said “about right.”
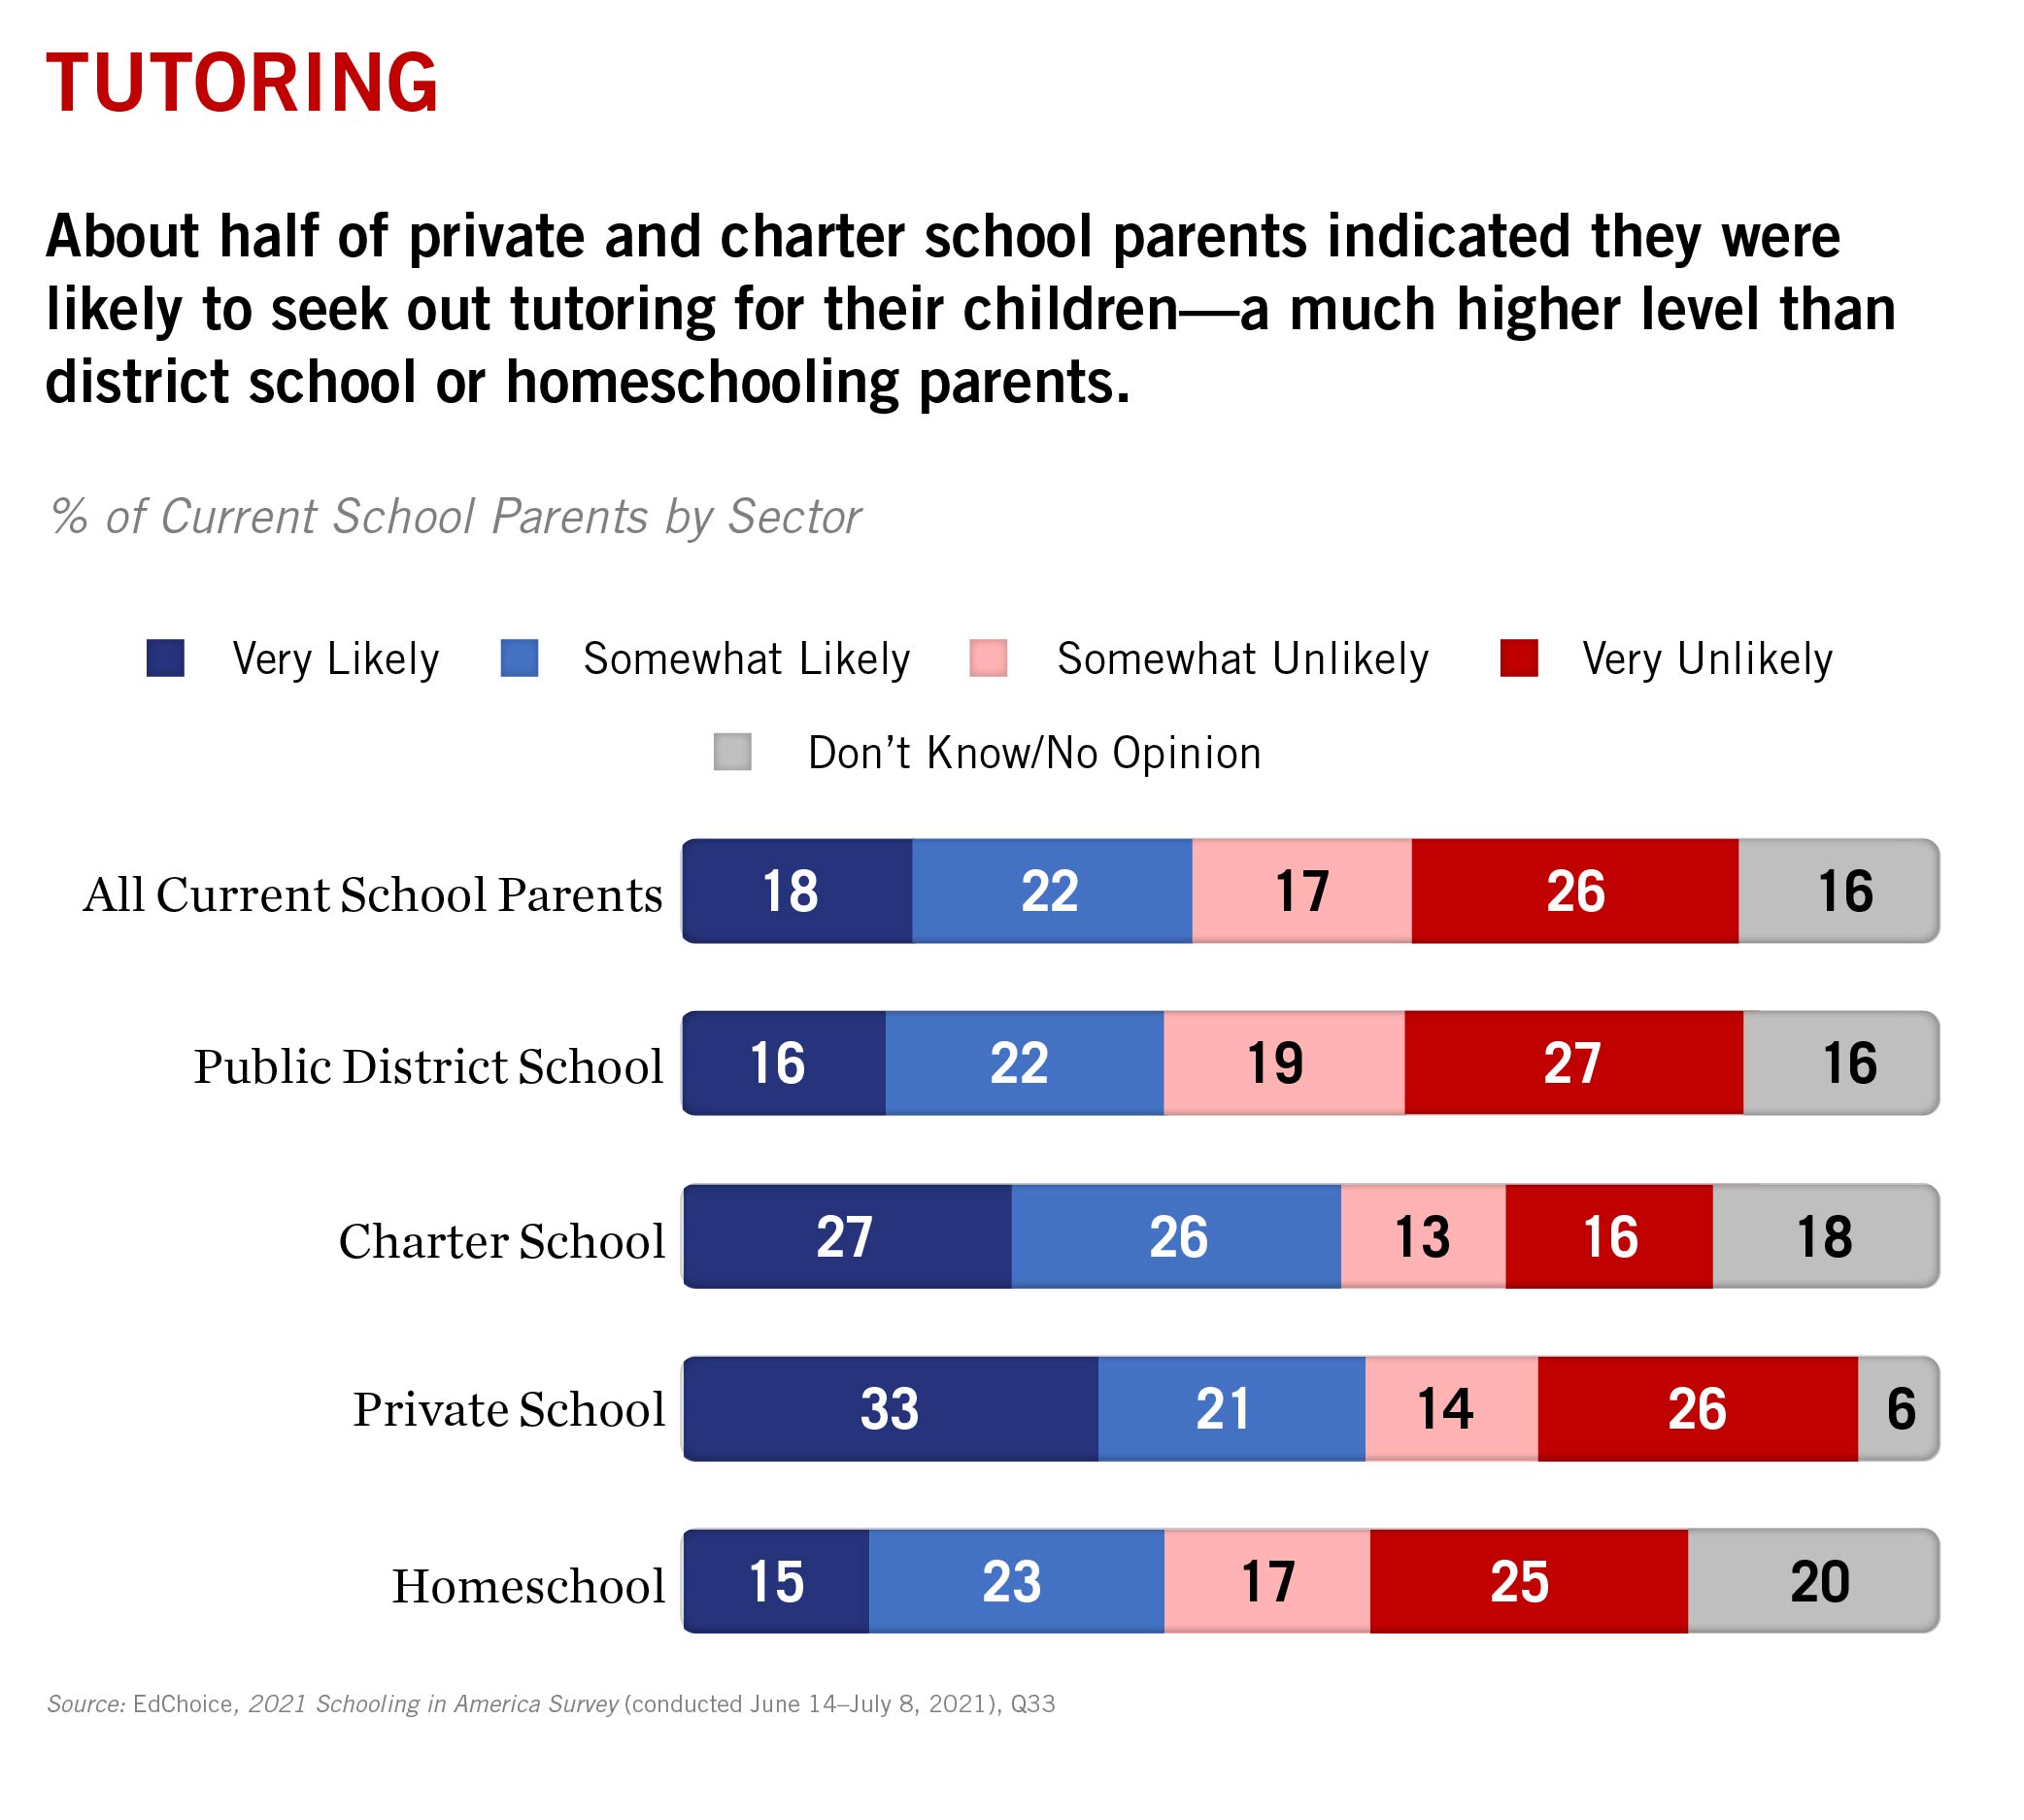
5. Many parents are seeking tutoring or learning pods.
Learning loss concerns are prevalent after a school year full of disruptions and shifts back-and-forth between remote, hybrid and in-person learning. So we wanted to know how much parents were interested in supplemental or alternative education this year.
Two-fifths of parents said they were at least somewhat likely to seek tutoring for their children this year, though charter and private school parents were noticeably more likely to say they may seek tutoring.
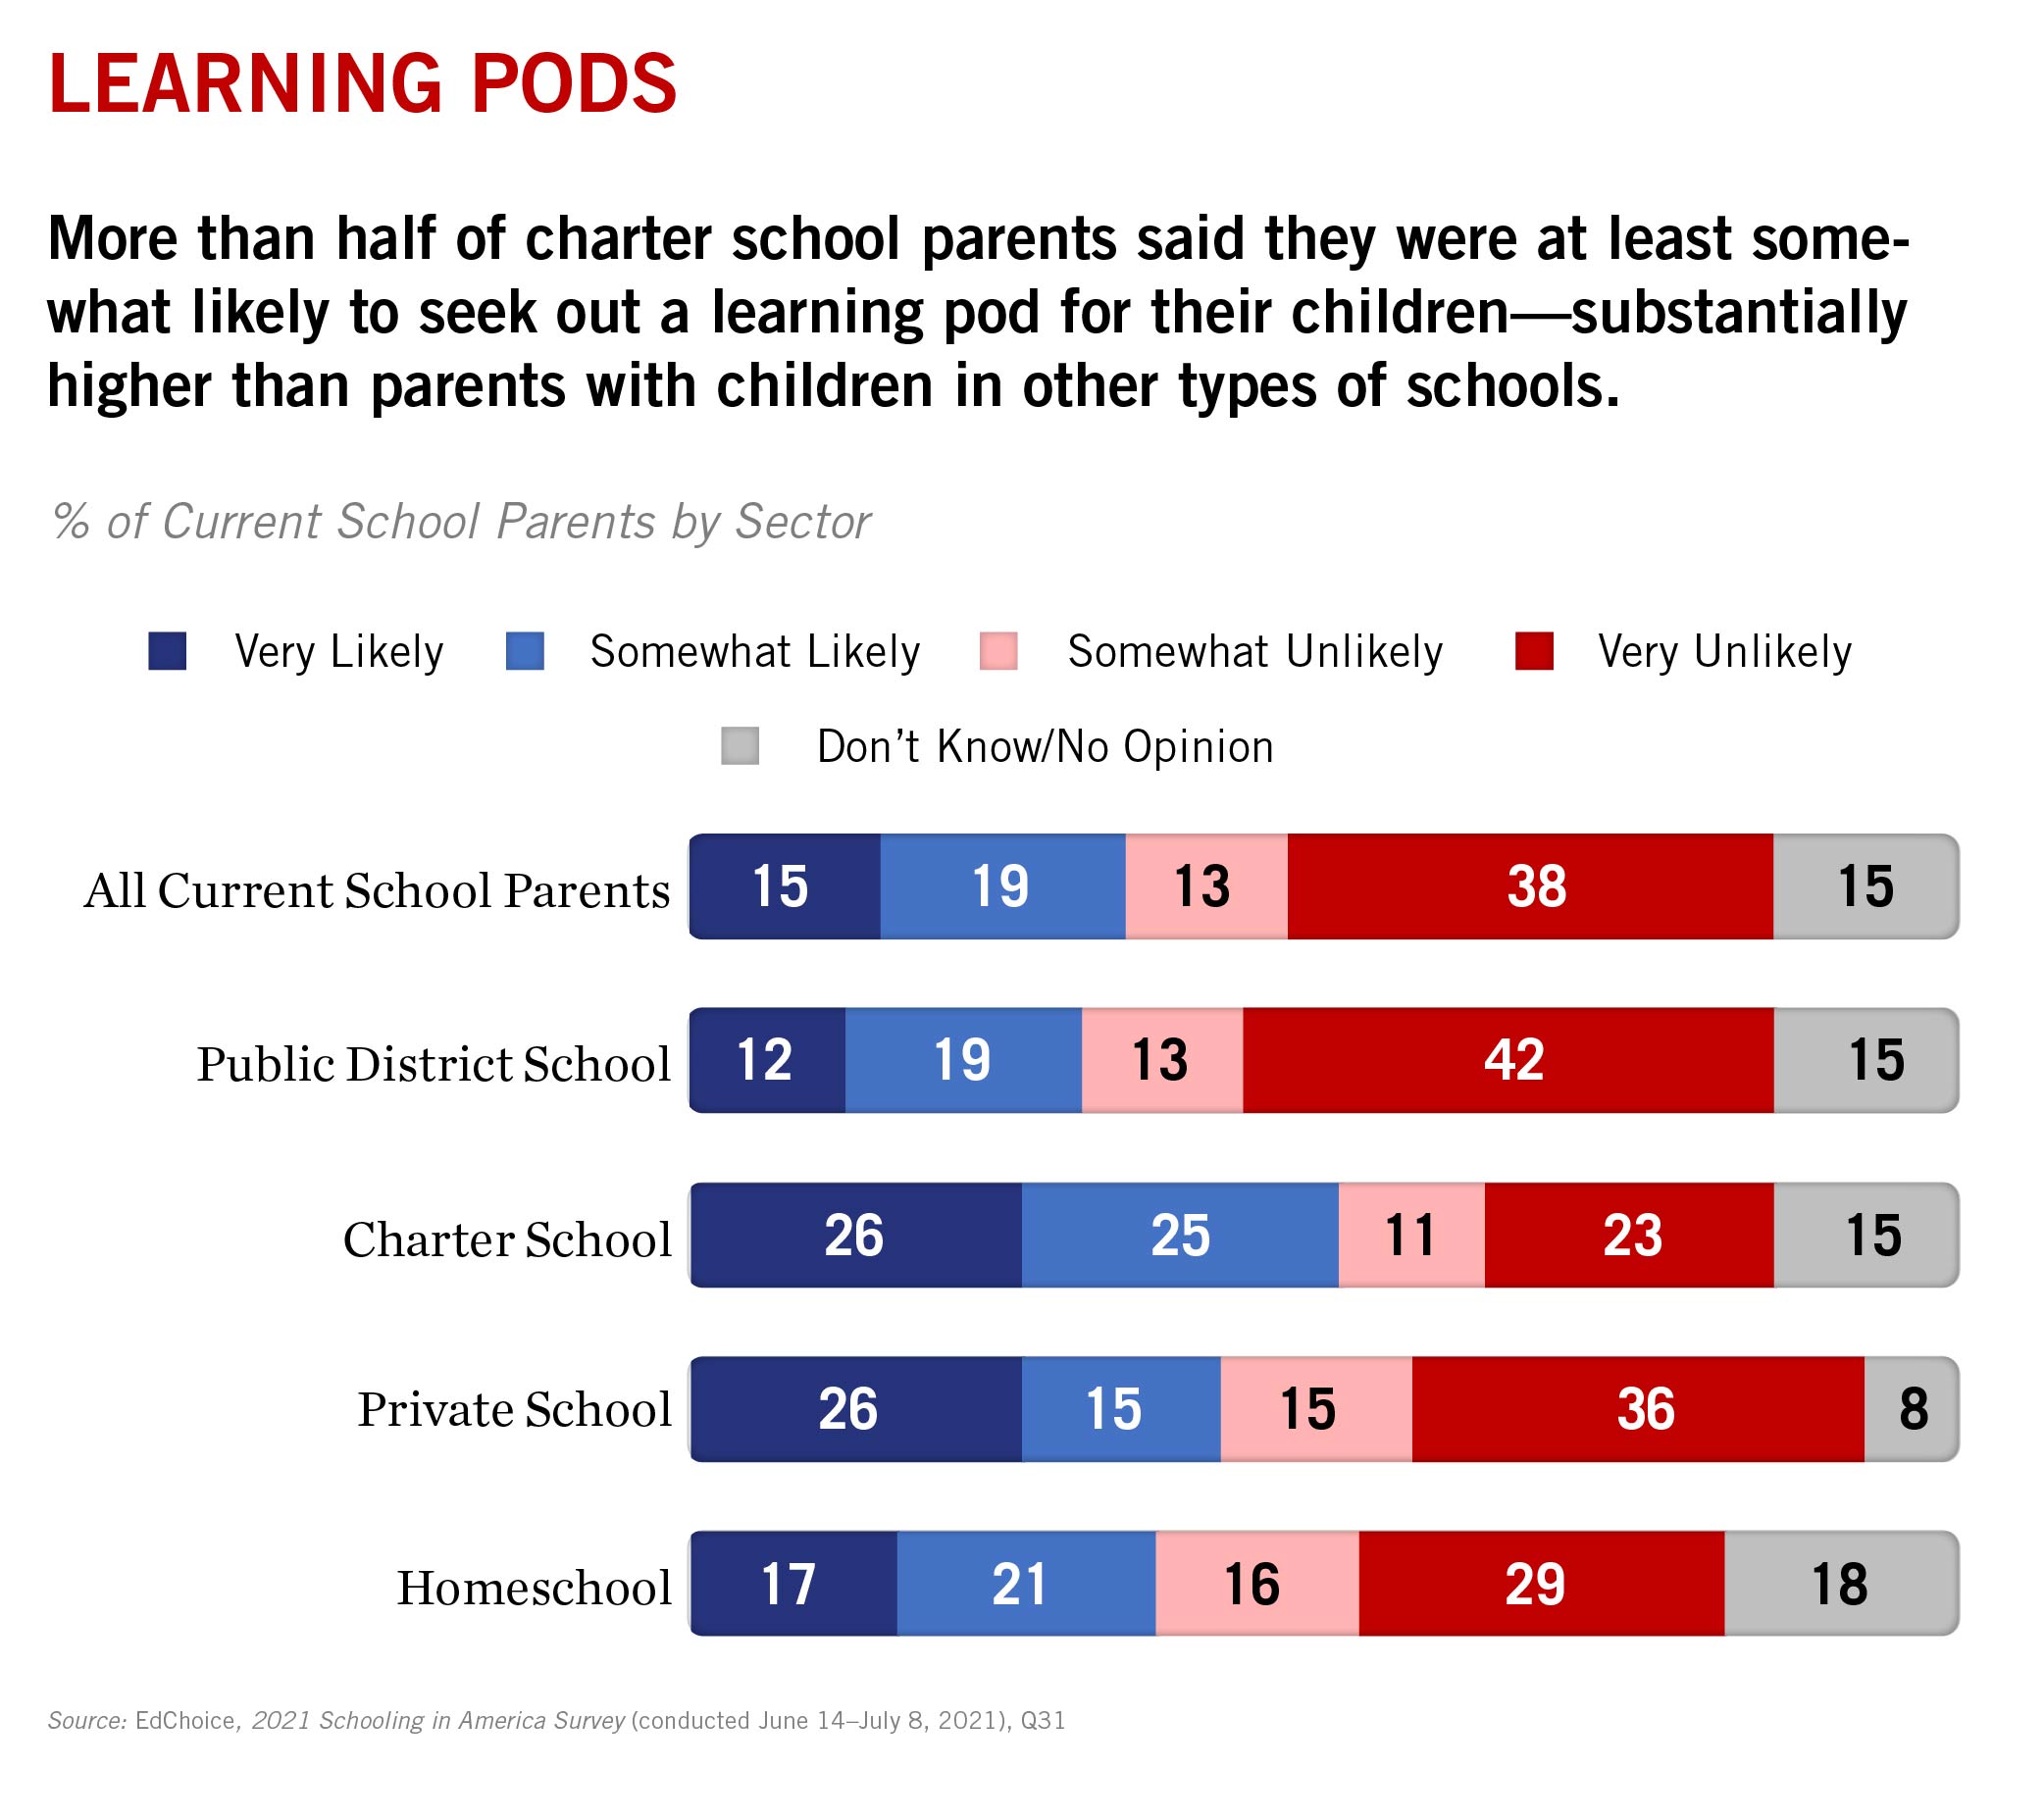
Learning pods gained attention over the course of the pandemic, but 31 percent of parents said they were at least somewhat likely to seek out learning pod opportunities for their children this year, including more than half of charter school parents. (Based on our monthly polling with Morning Consult, the vast majority of parents interested in learning pods consider them as supplemental to regular schooling, so these results could reflect a desire to overcome learning loss.)
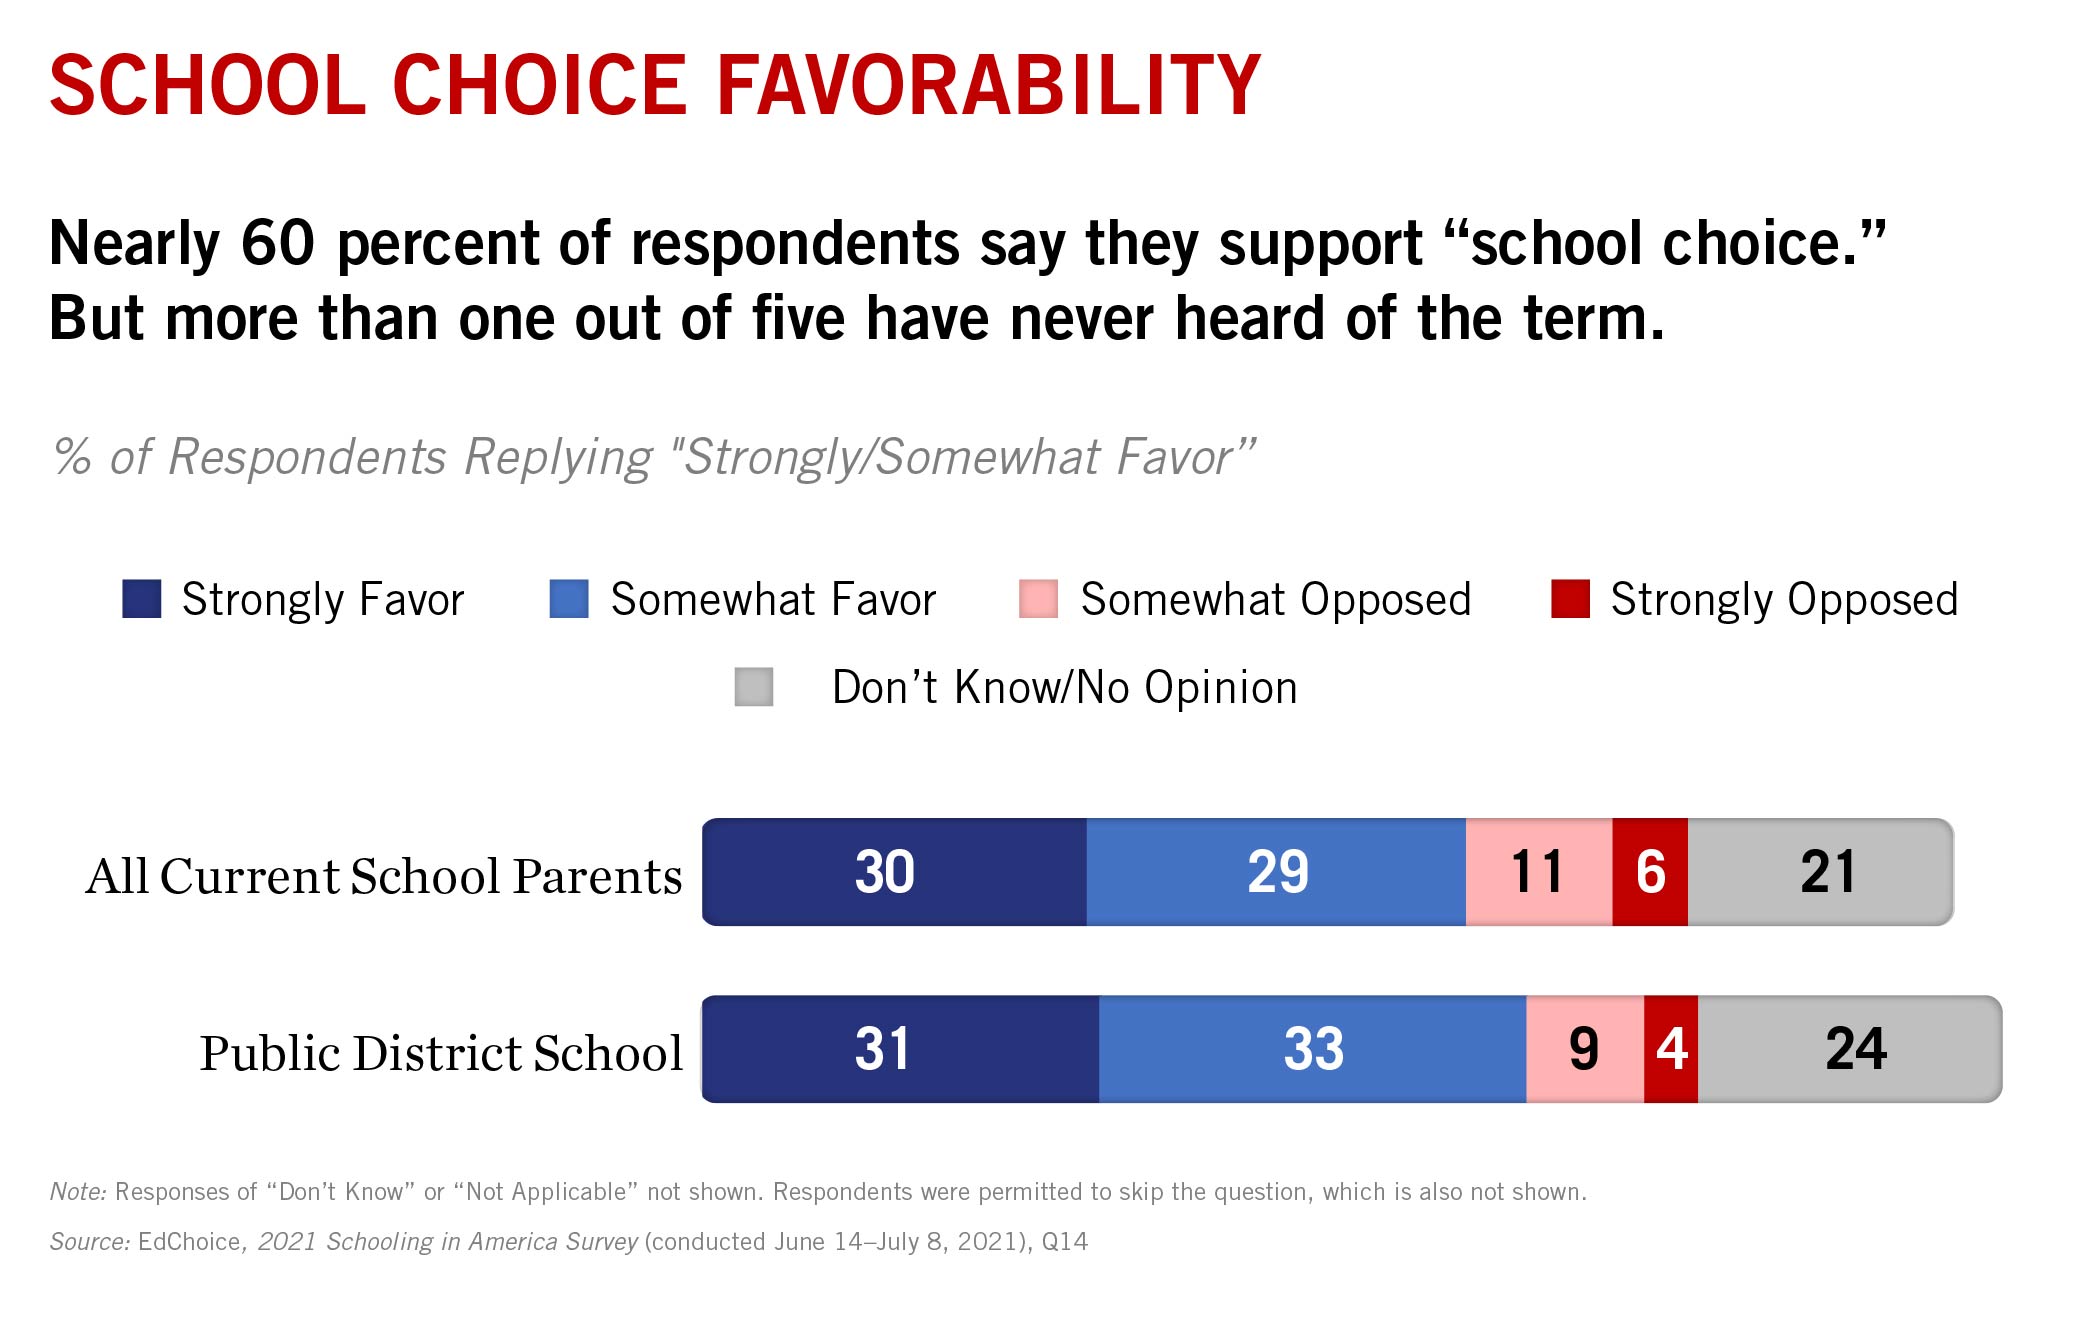
6. One in five Americans have not heard of school choice.
For the first time, we asked SIA respondents their opinion on school choice generally, without providing a definition. The majority of parents and the general population said they supported school choice. Seventeen percent of the general public and 13 percent of parents said they oppose it. A fifth of the general population and a quarter of parents said they had never heard of school choice.
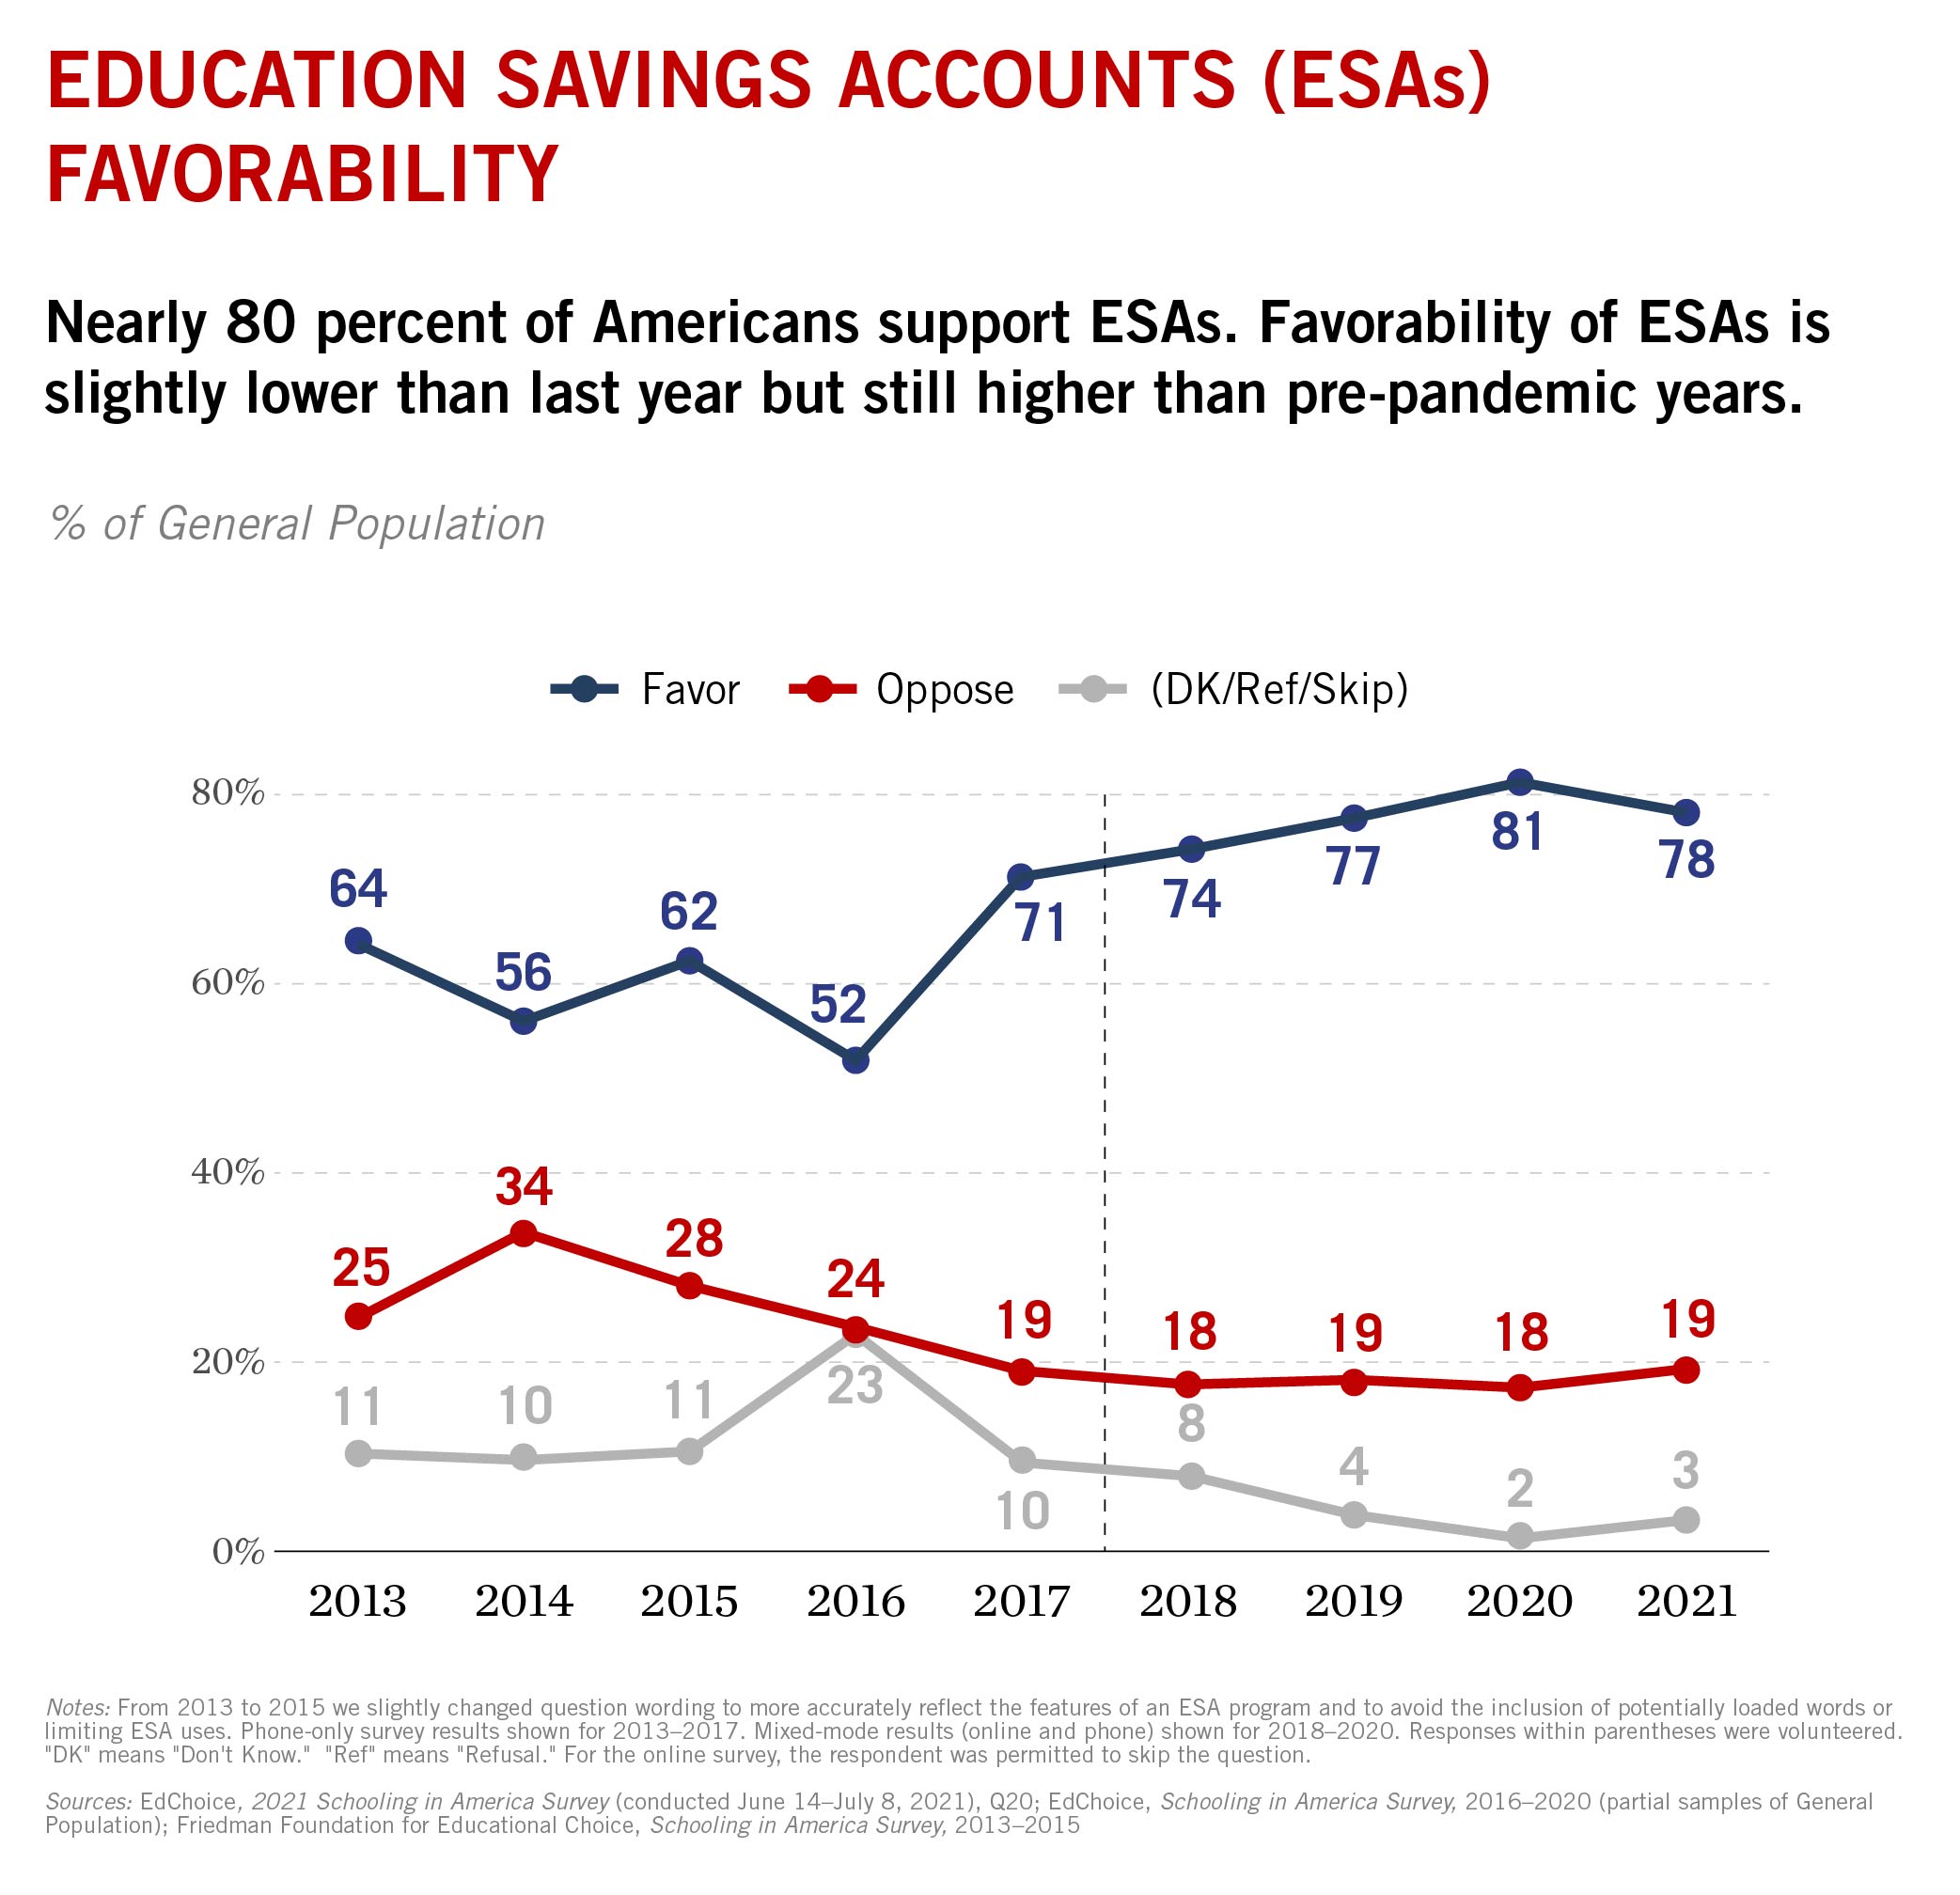
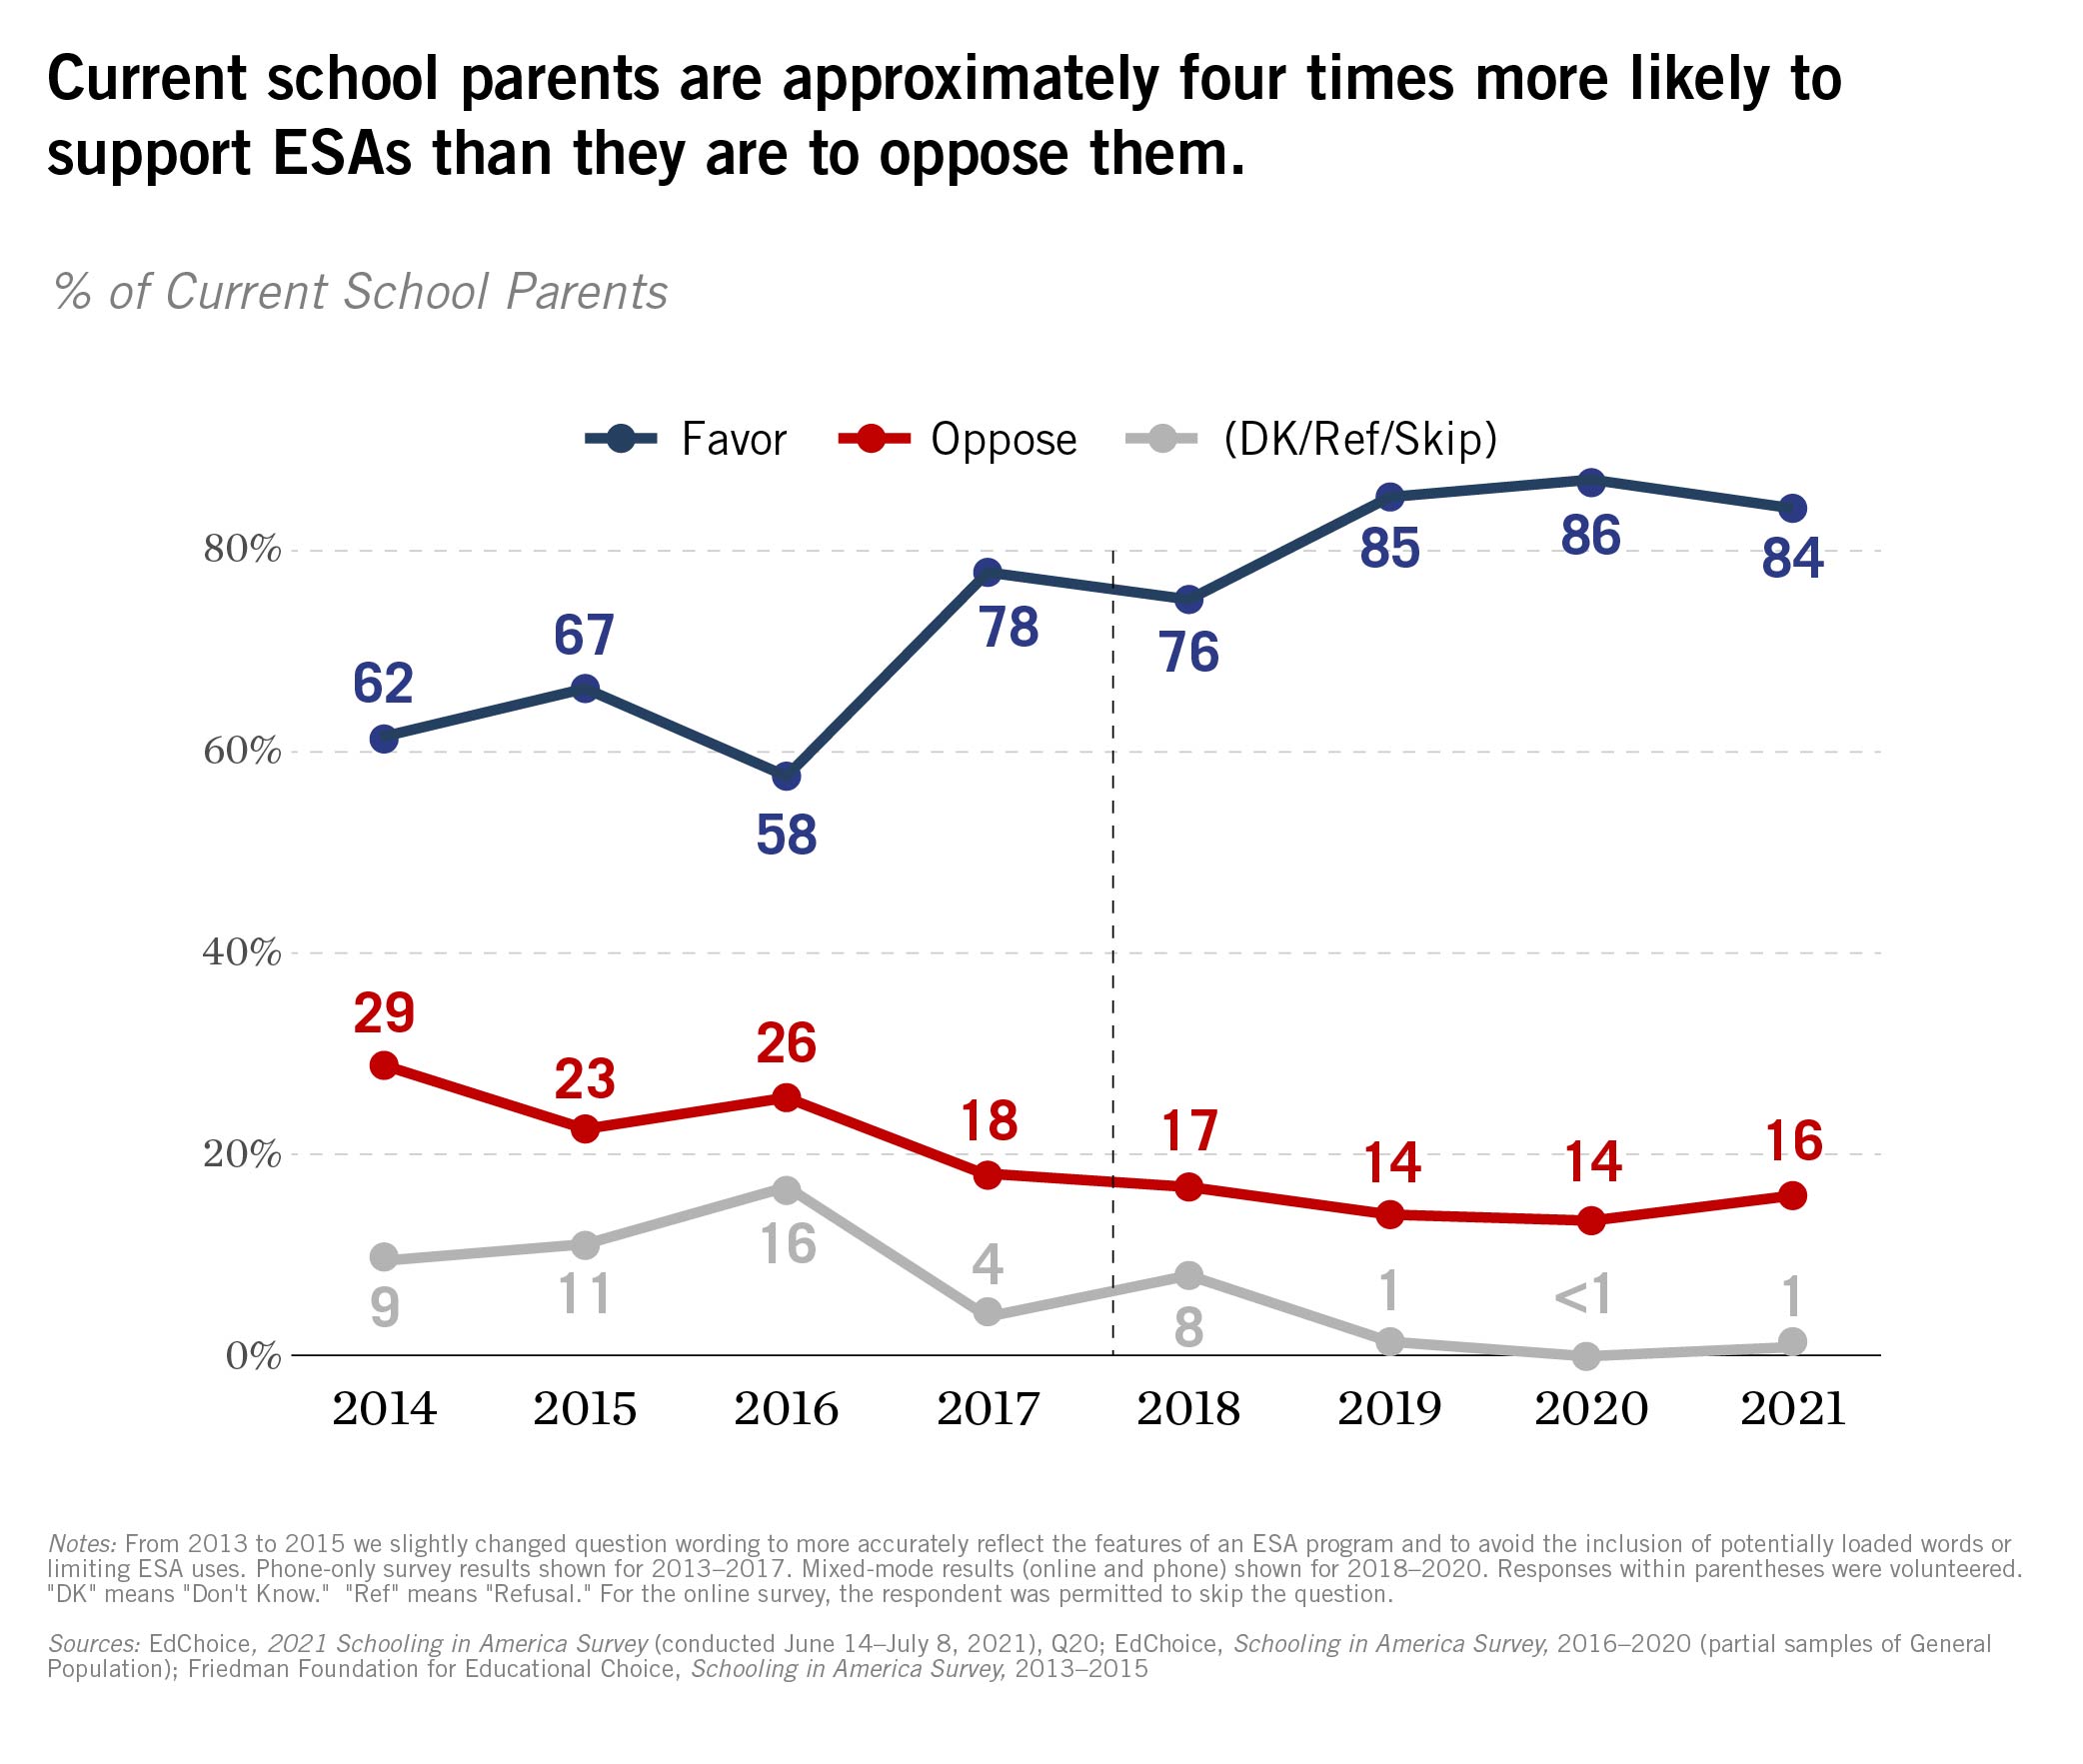
7. Education savings accounts (ESAs) remain very popular.
We observed small decreases in support for ESAs among parents and the general public since last year—drops of two points and three points, respectively. However, more than three-fourths of both groups indicated support for ESAs. Parents were about four times as likely to support ESAs than they were to oppose them.
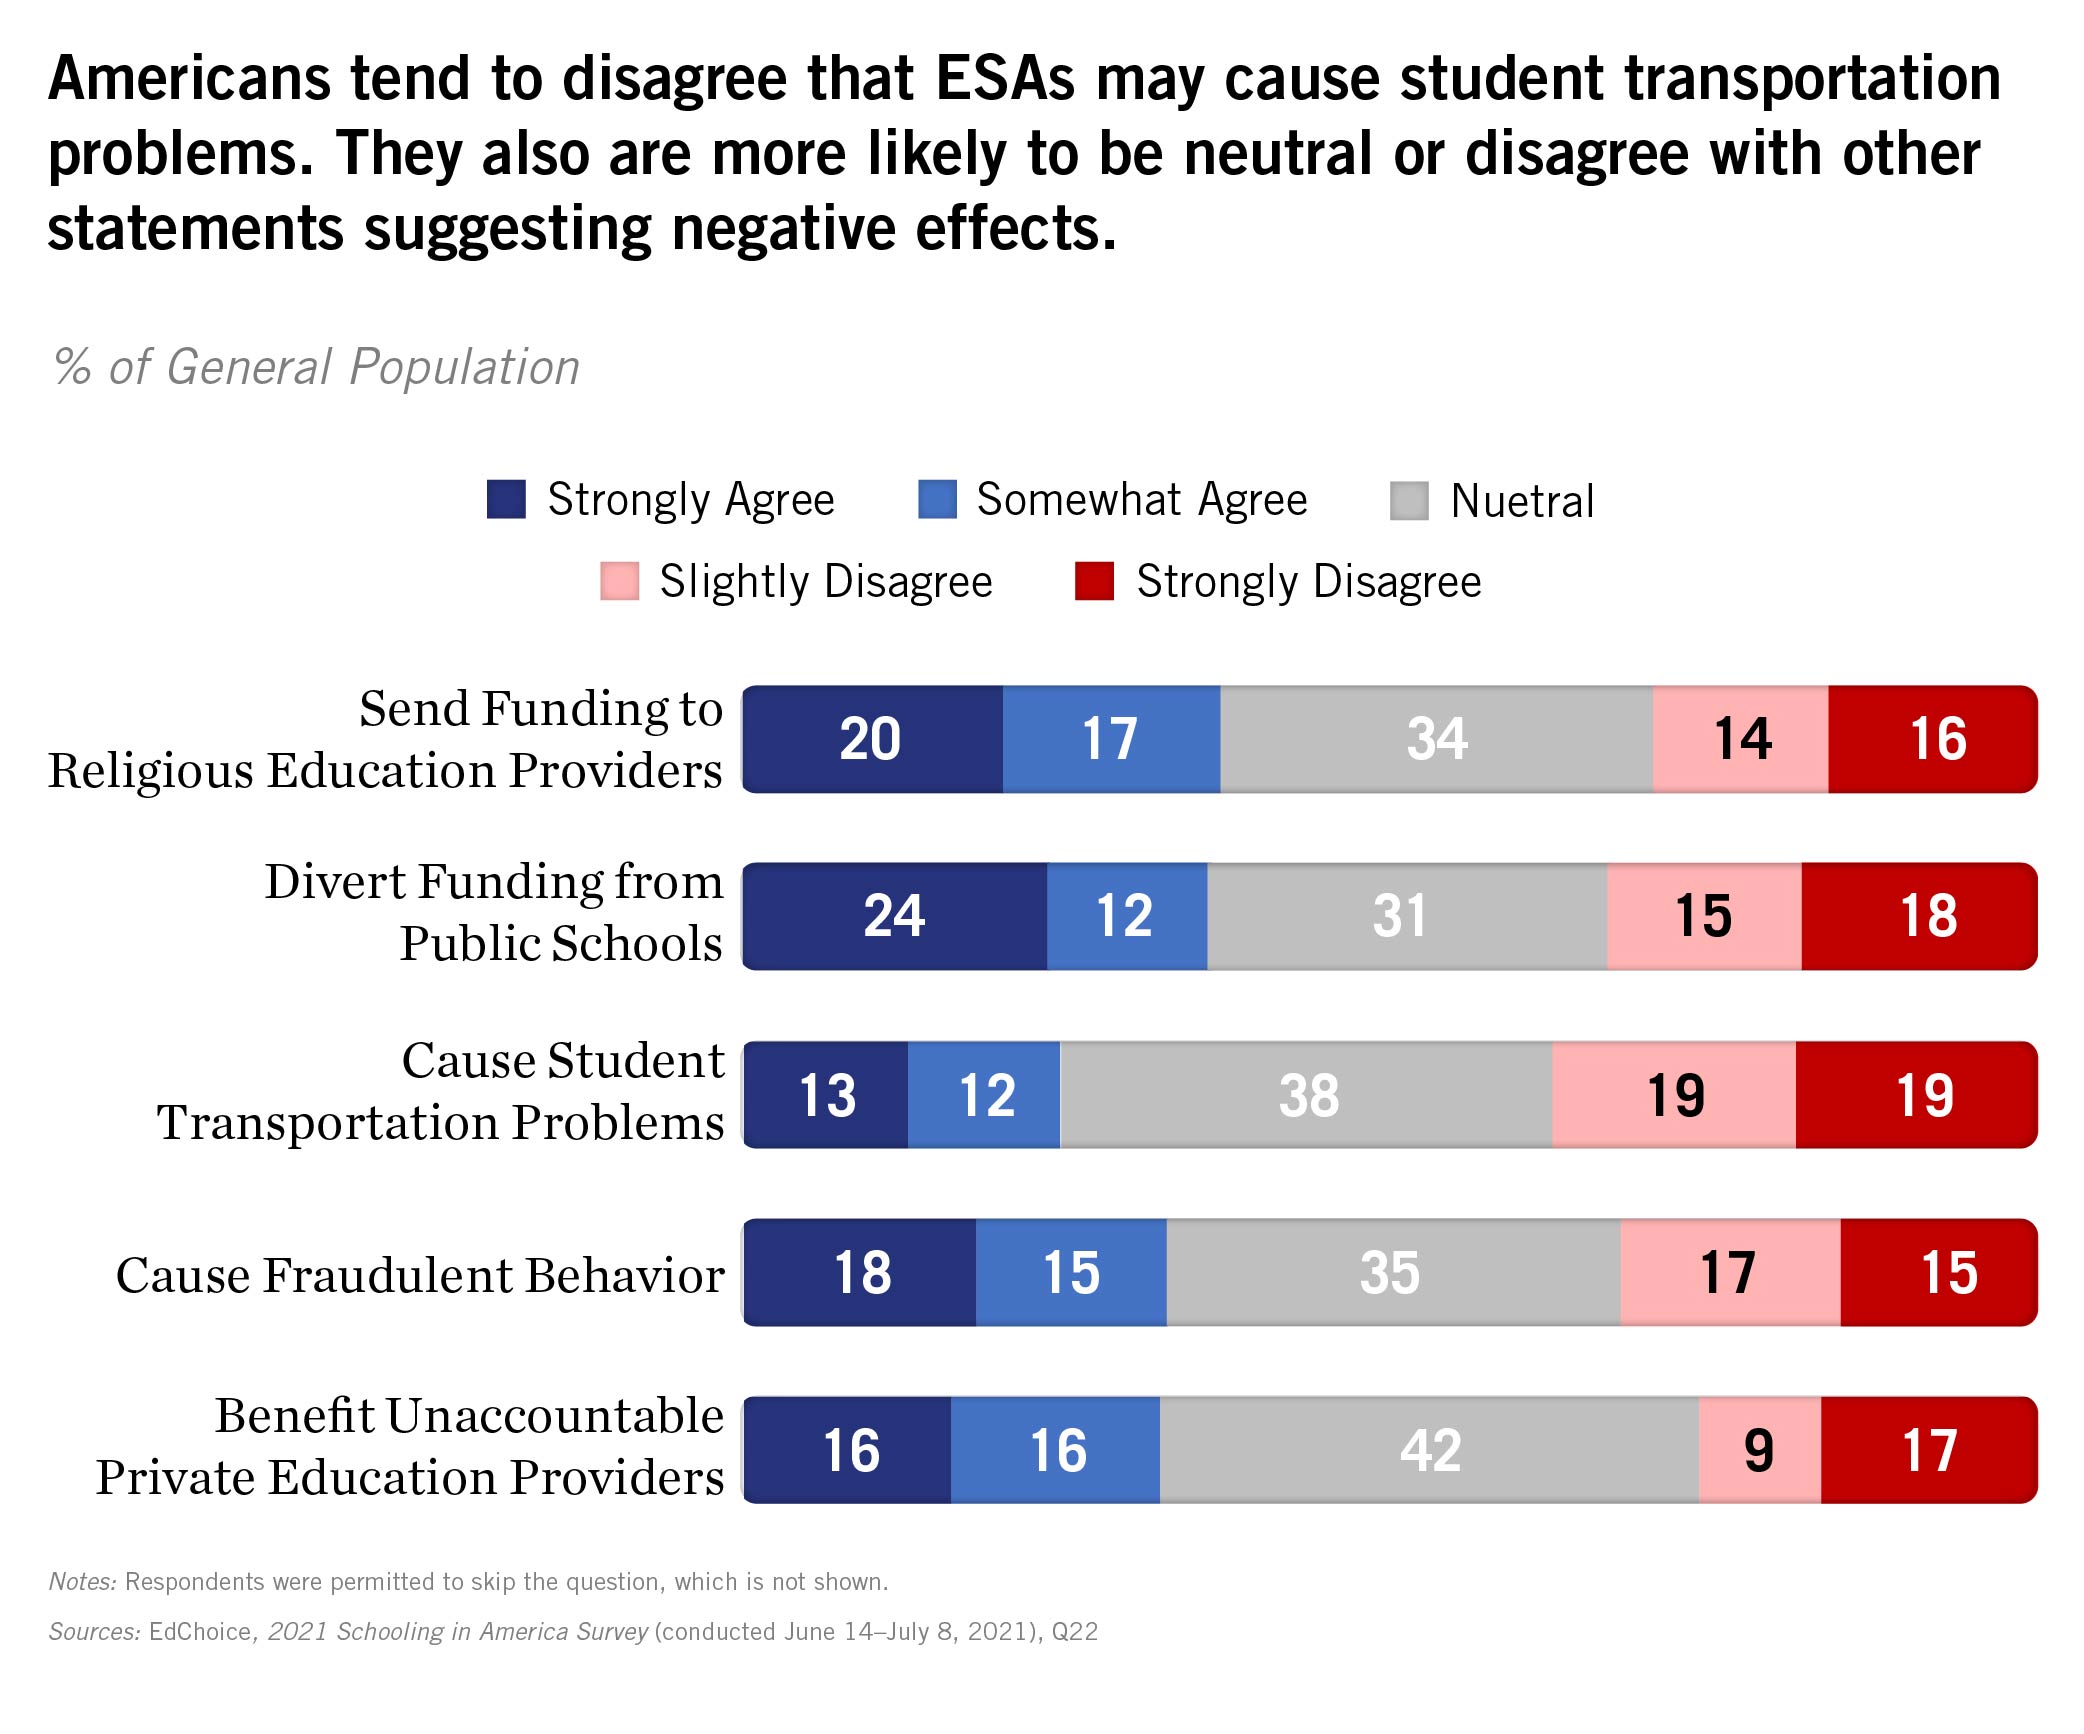
Four of the five positive ESA arguments received solid majority levels of agreement from the general public. Five negative ESA arguments received noticeably less support.

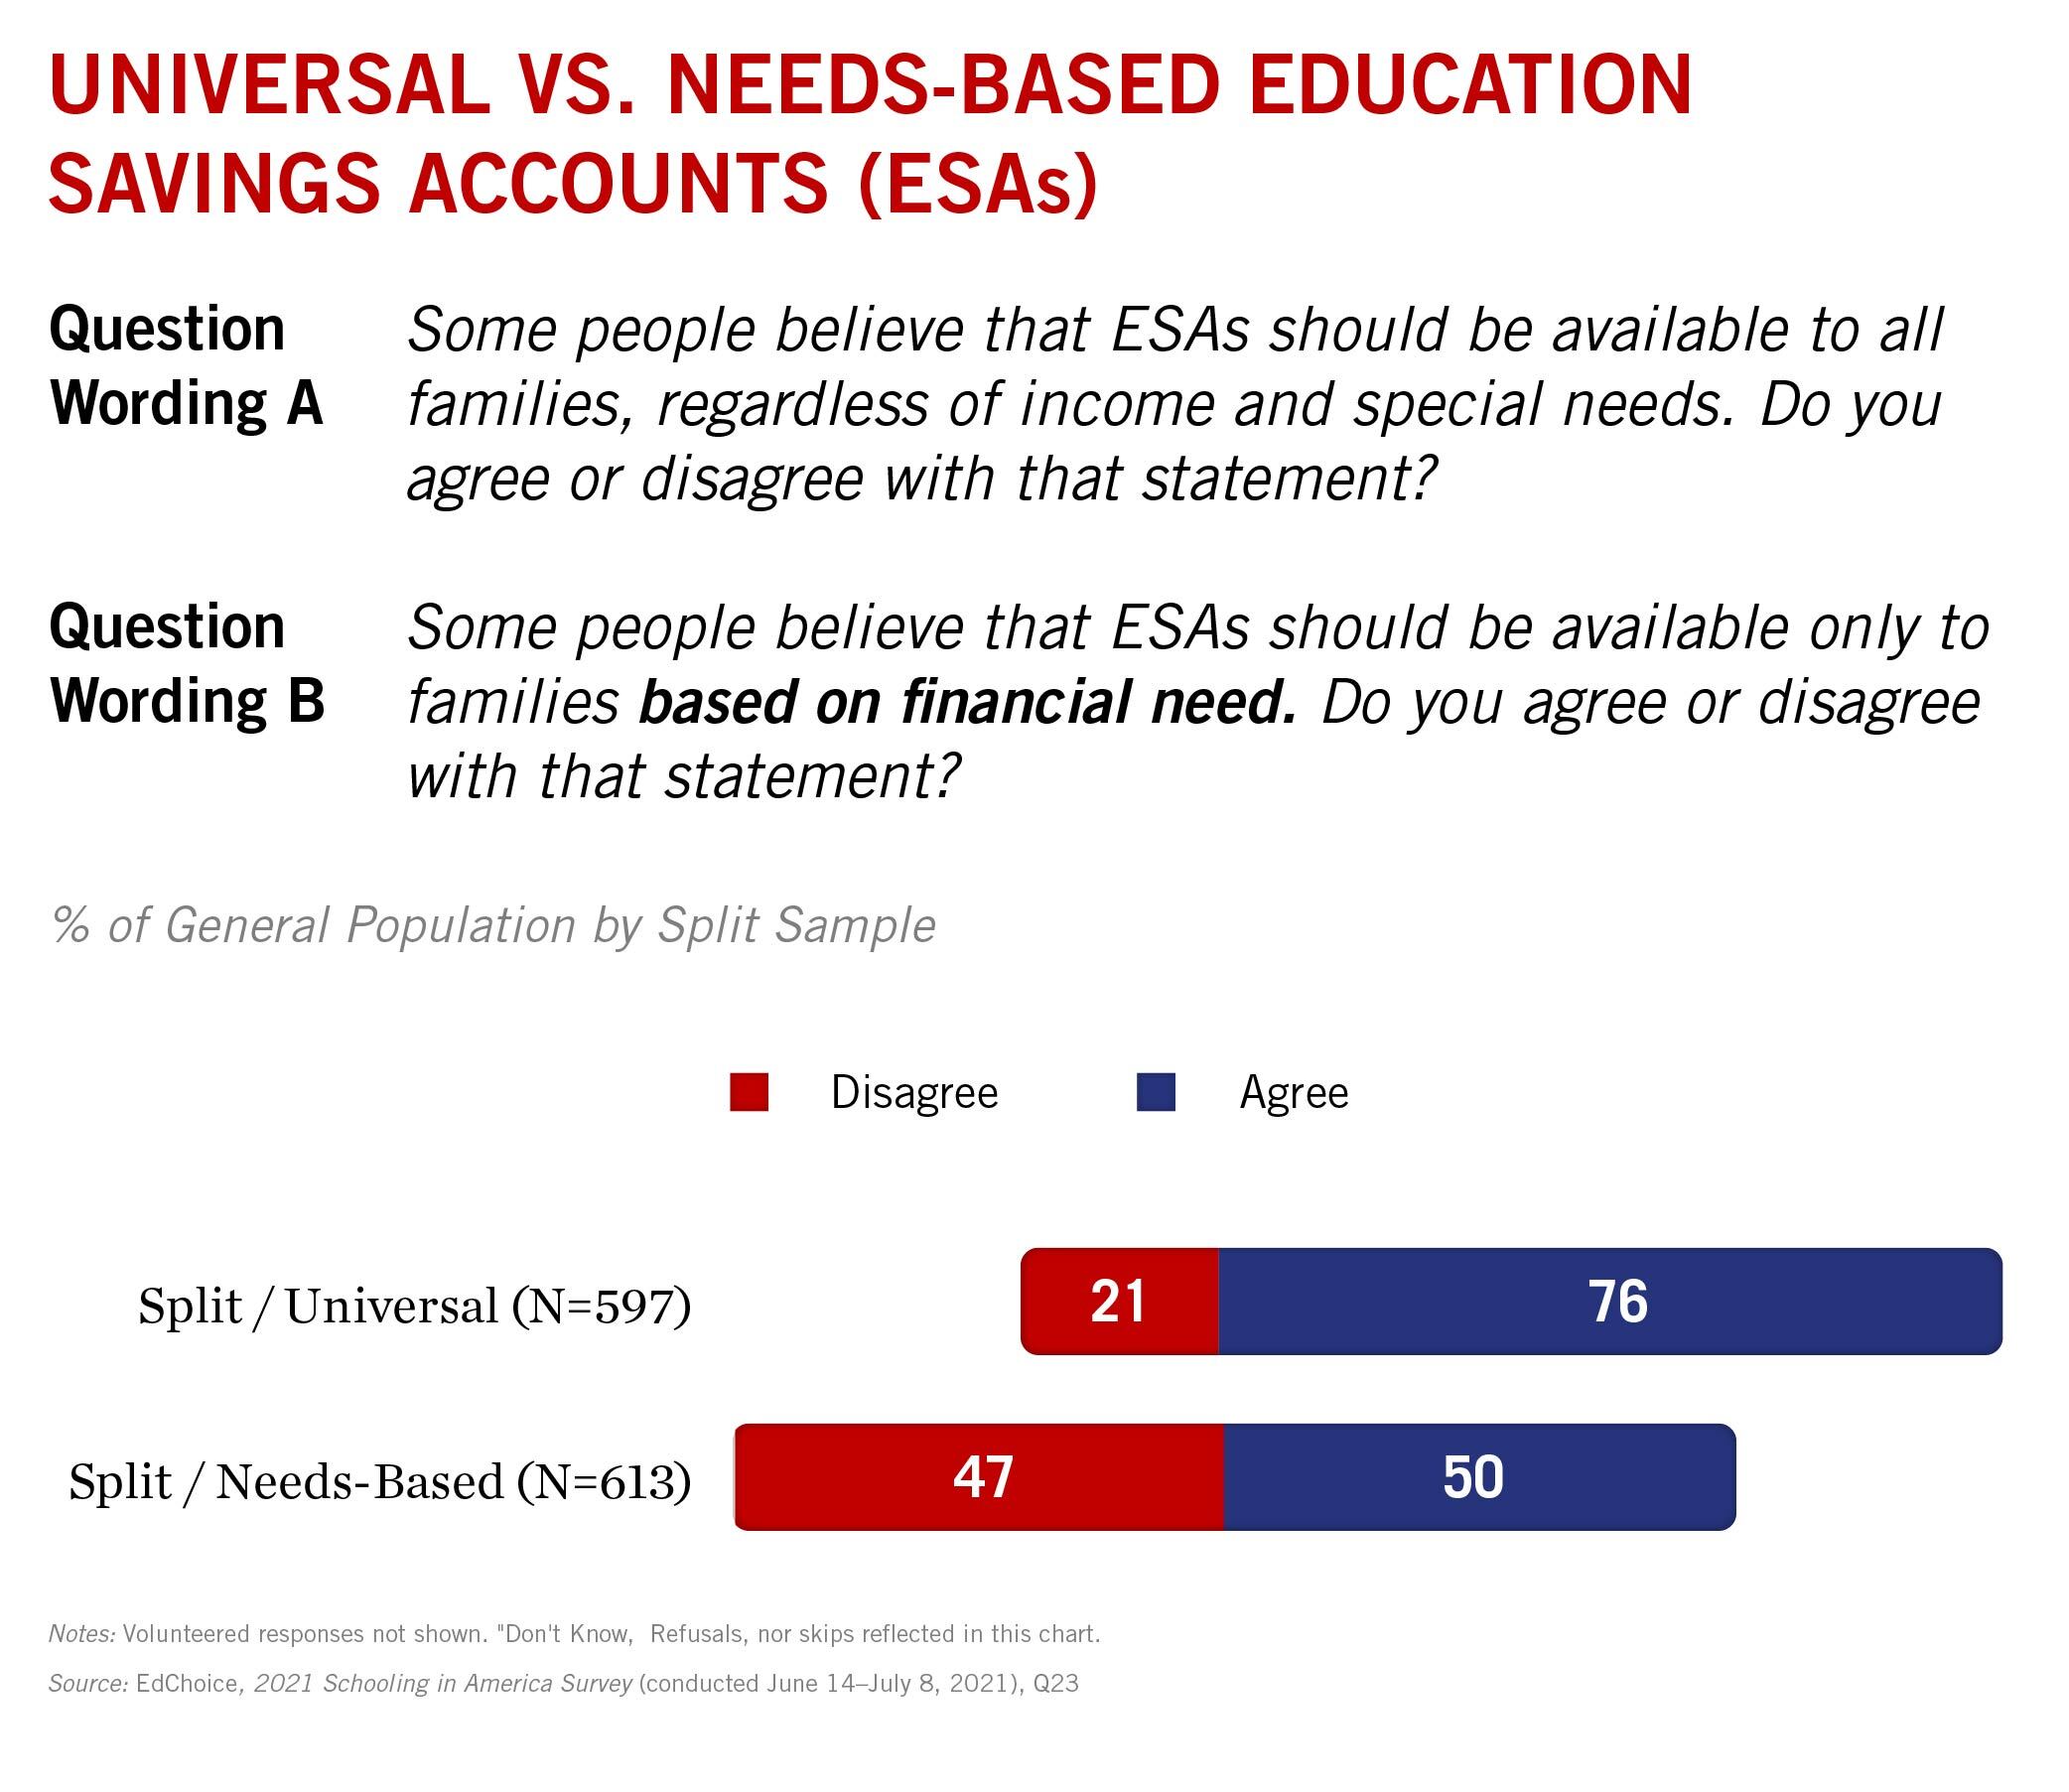
Expansive ESA policies have been enacted in 2021. Each year for SIA, we conduct a split-sample question about whether ESA eligibility should be needs-based or universal. We randomized whether people saw a question asking if they agreed with needs-based or universal eligibility language. Those who saw the question asking whether they agreed with universal ESA eligibility were much more likely to agree with universal ESA eligibility compared needs-based eligibility.
8. Policies that give greater access to schooling options receive strong majorities of support.
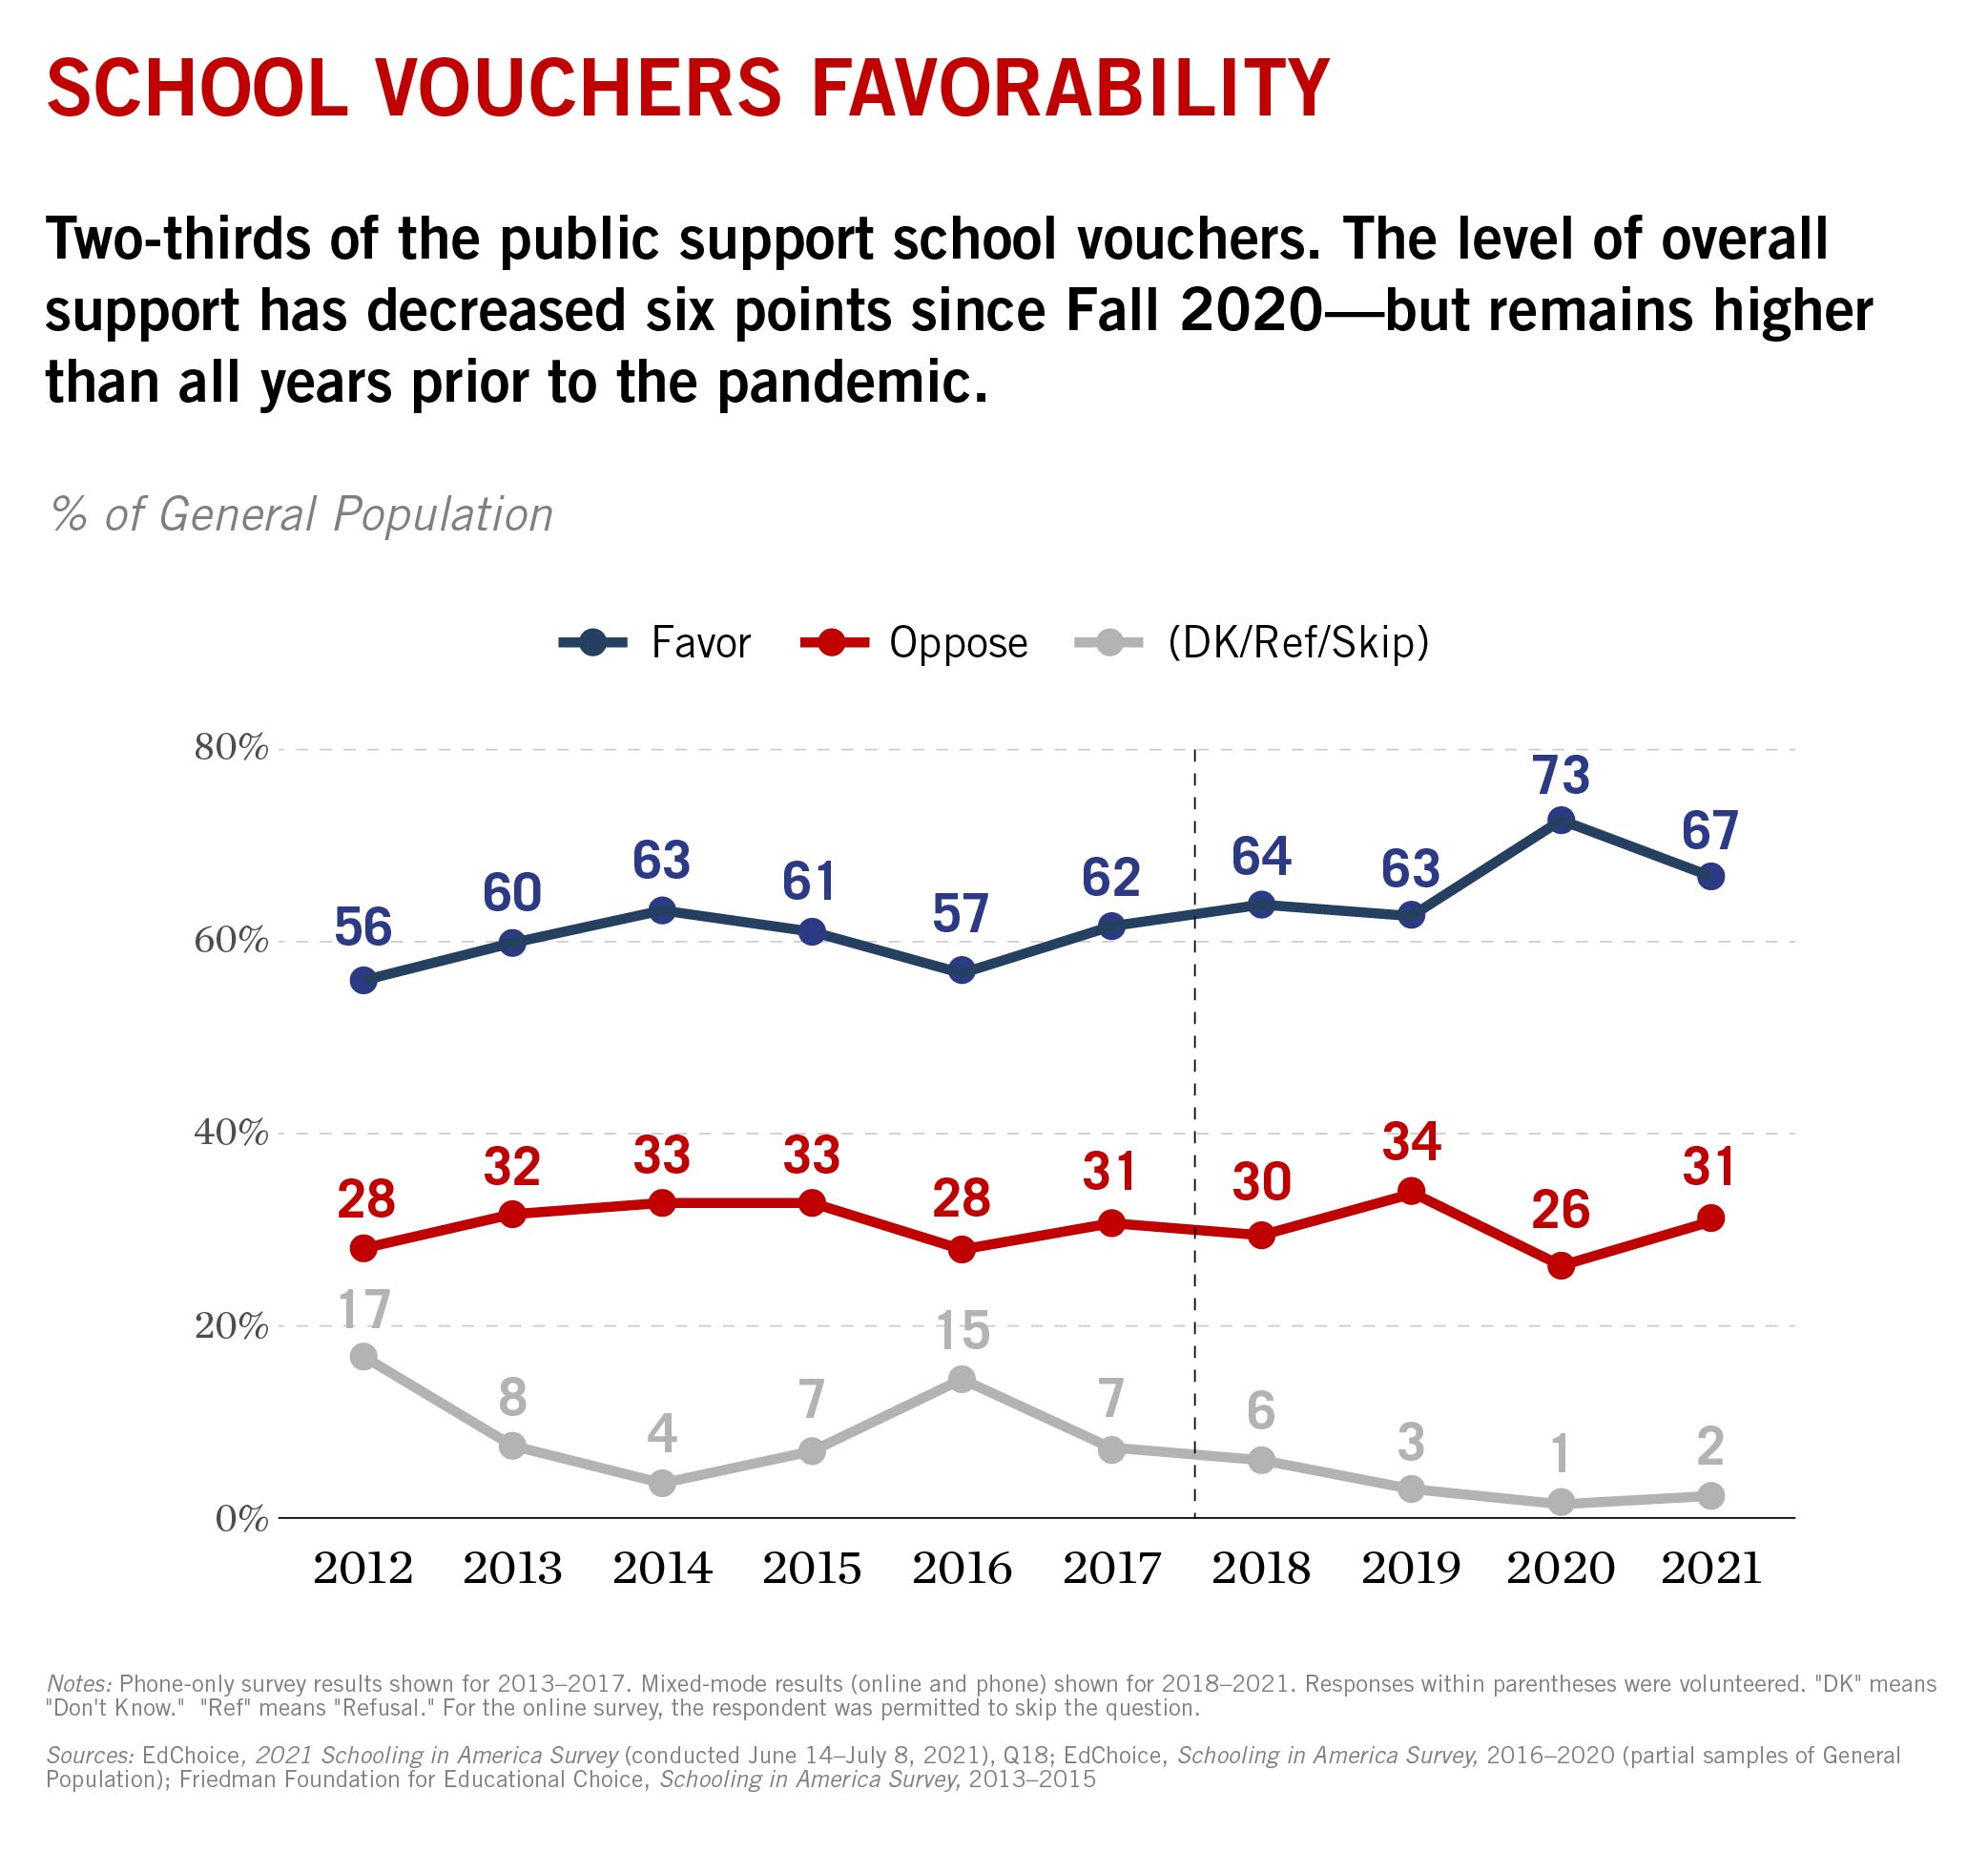
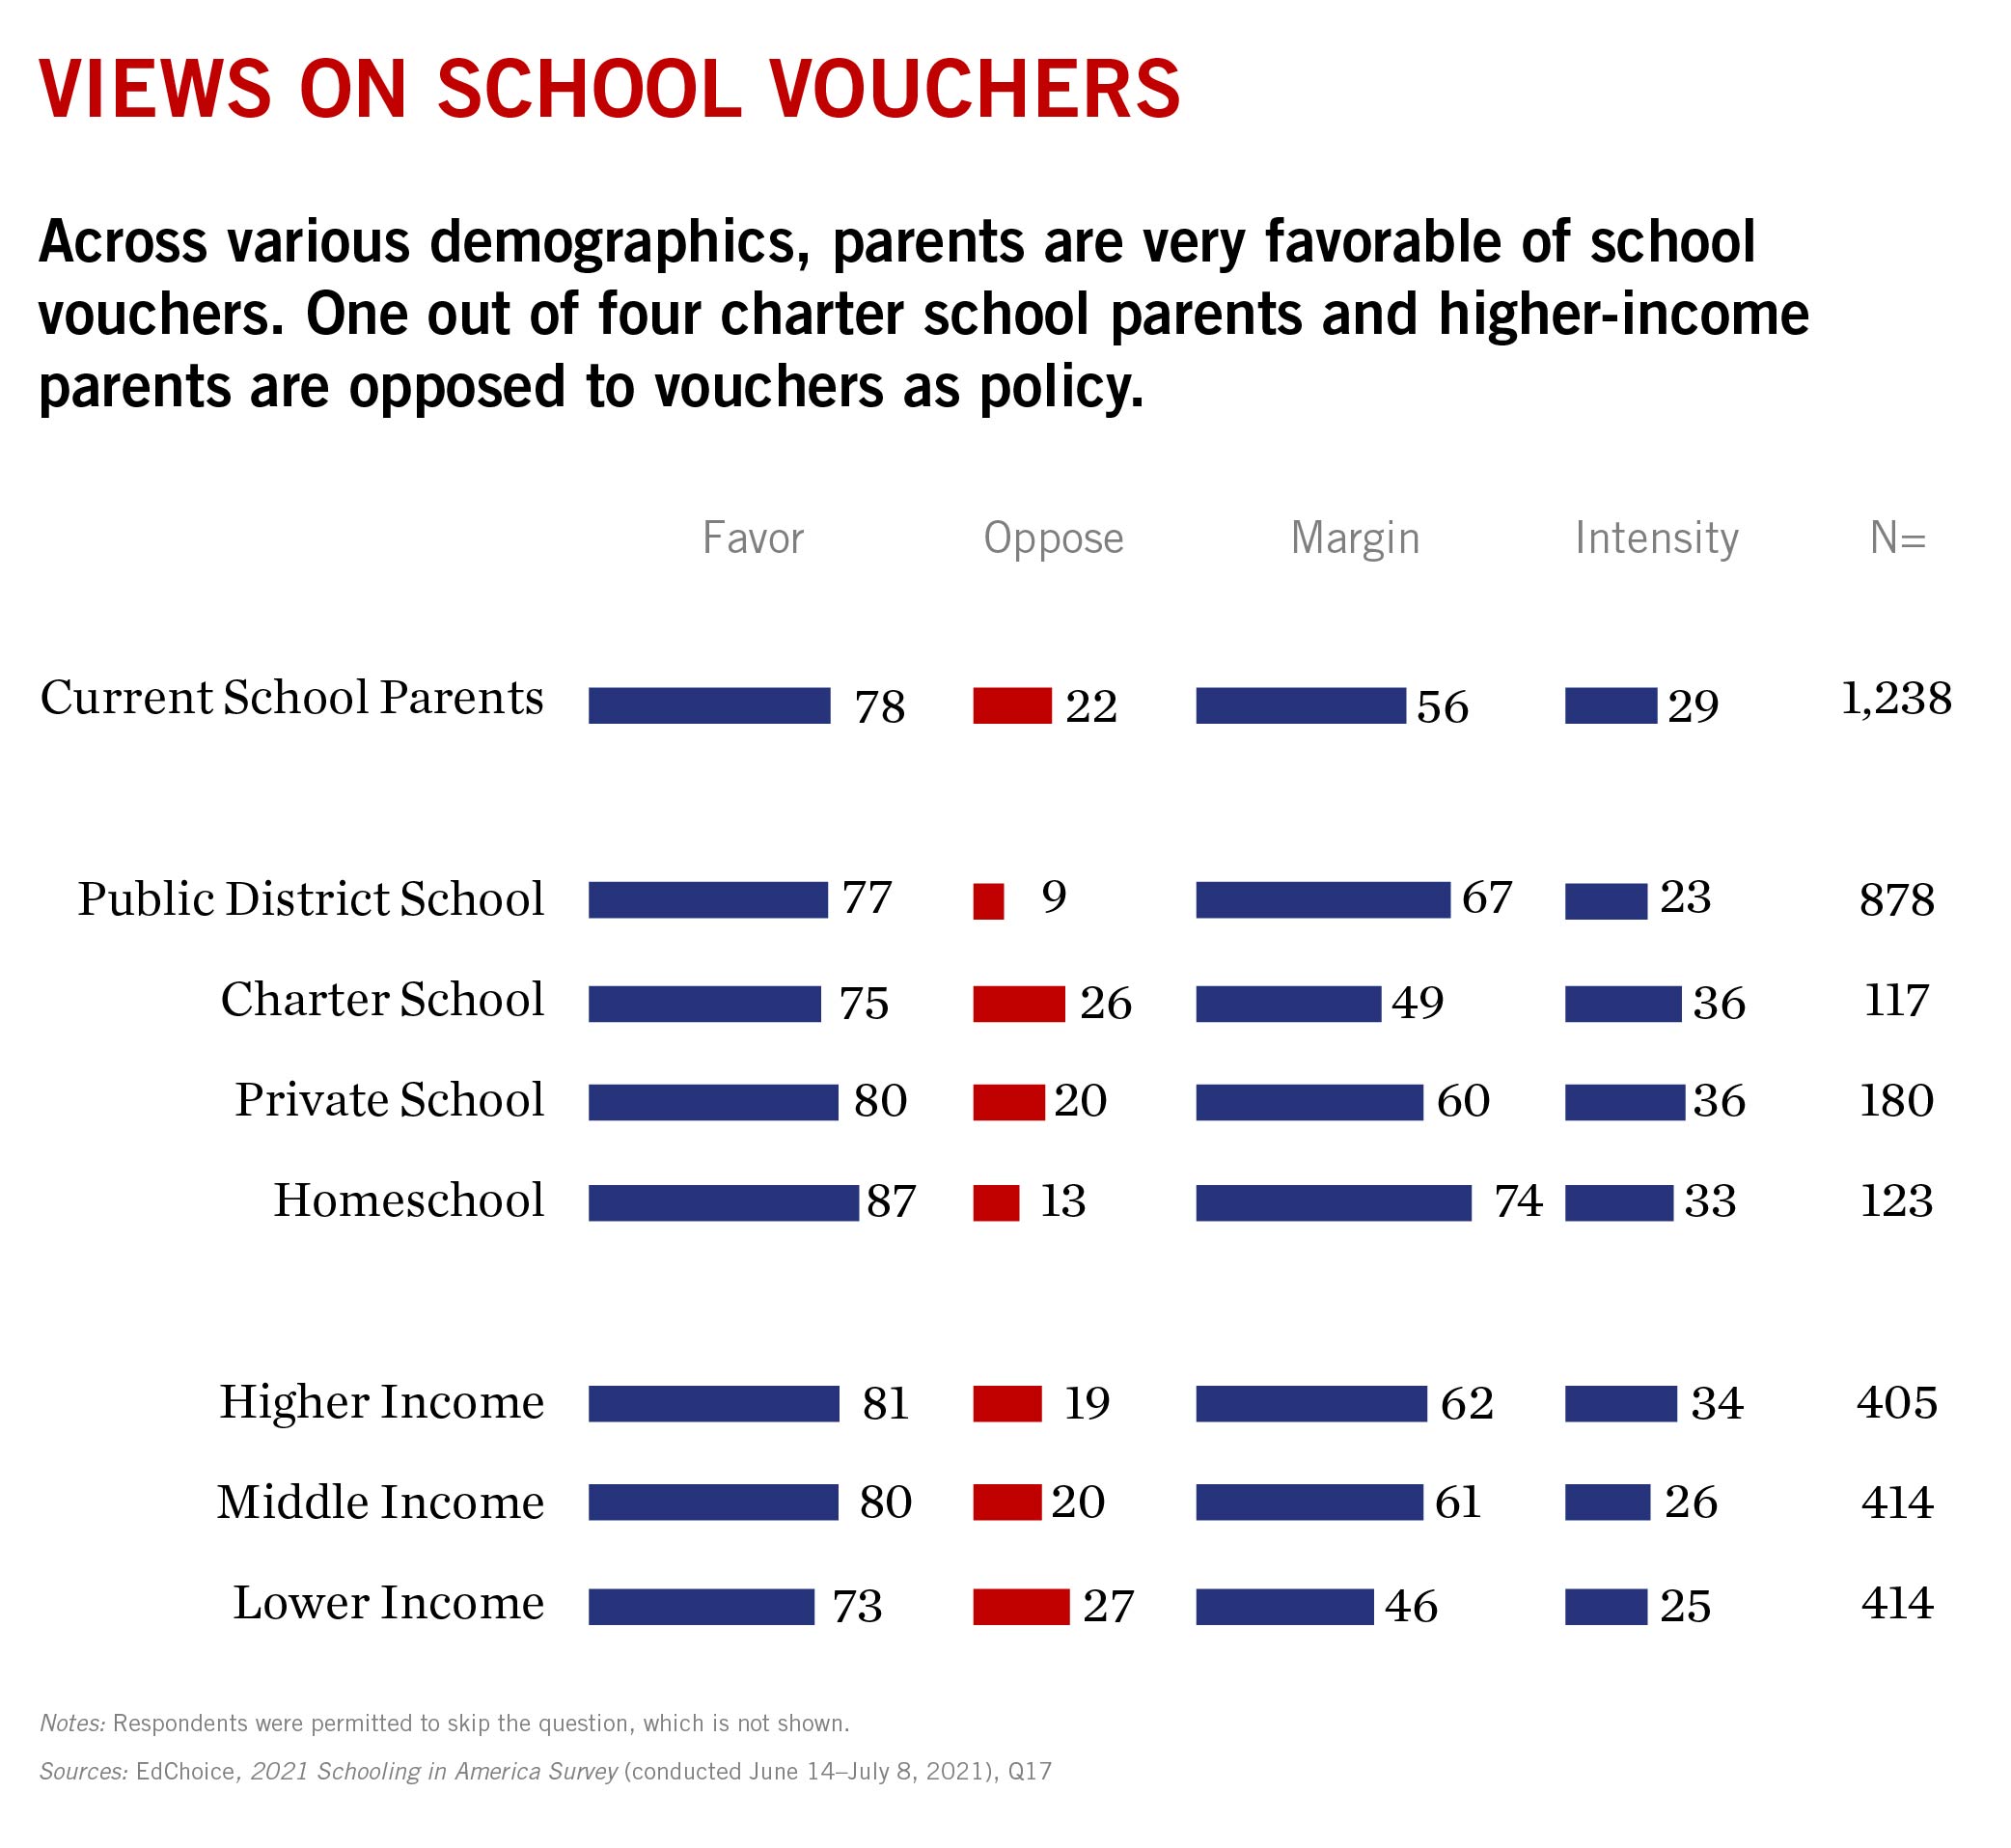
Public support for school vouchers dipped in 2021, but the vast majority—two-thirds—still support vouchers. More than three-quarters of school parents said they support vouchers, nearly the same as last year. Notably, support from lower-income and middle-income parents was substantially higher than that of higher-income parents.

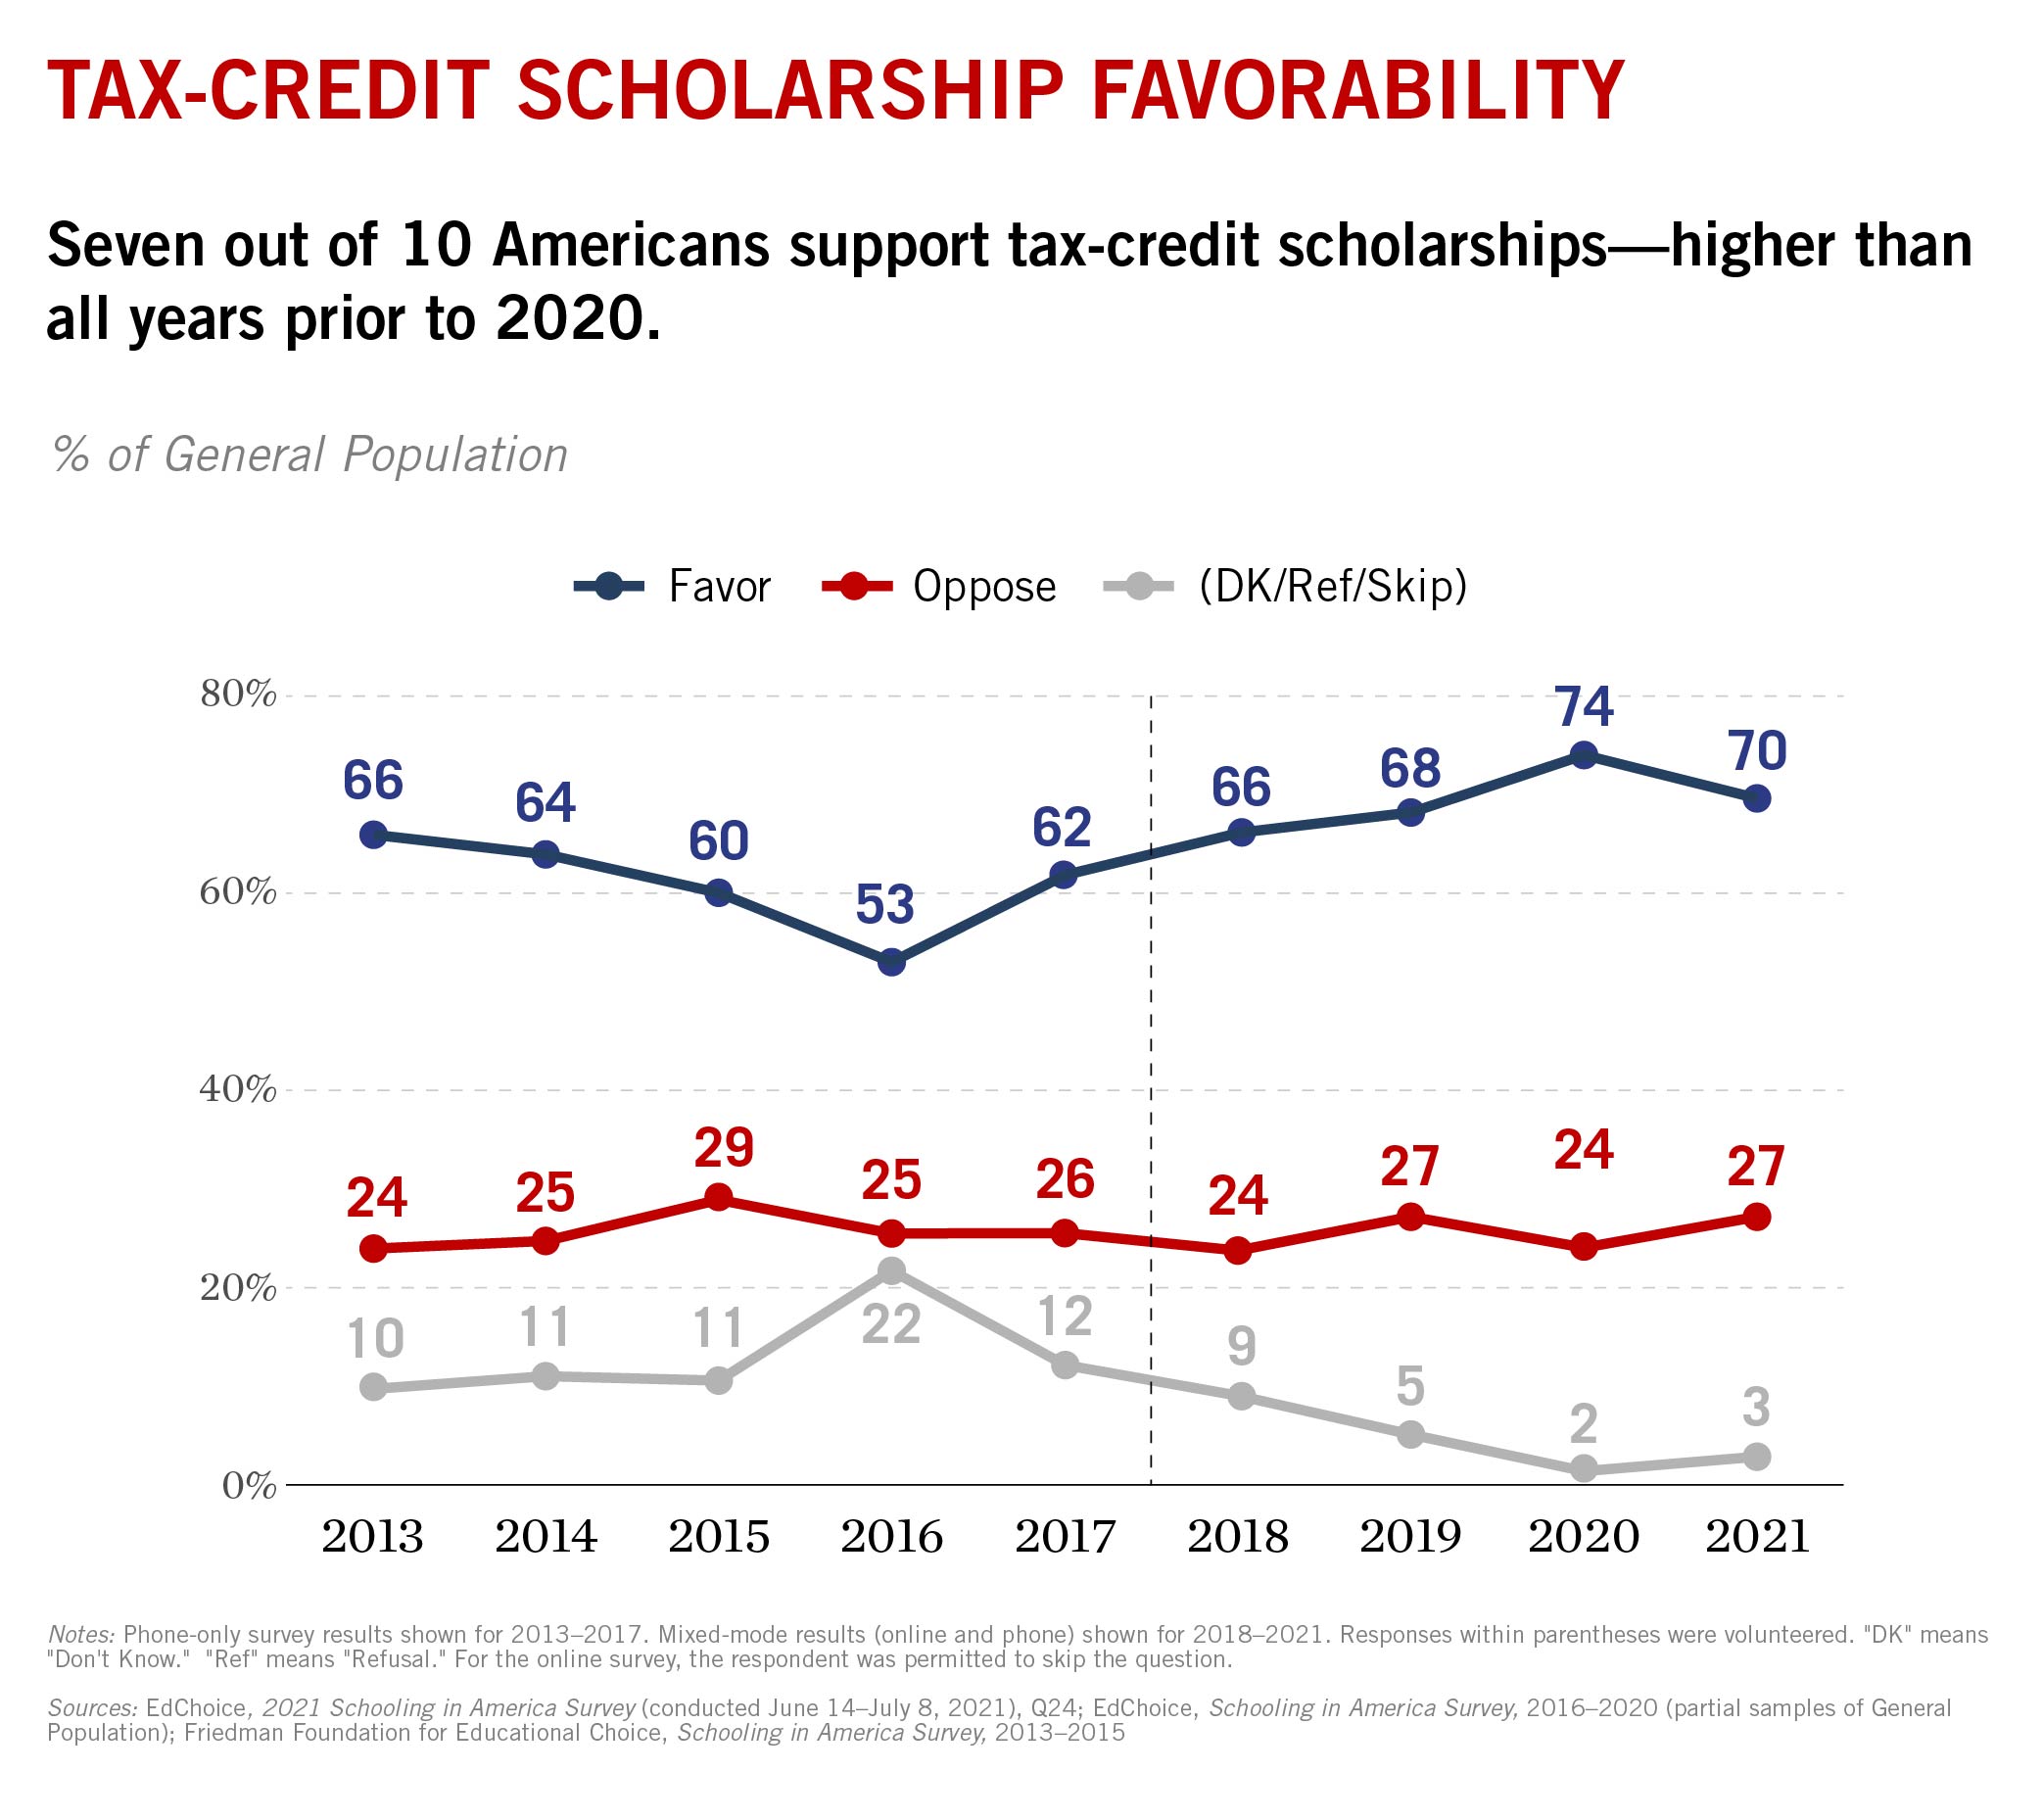
Tax-credit scholarships also remain overwhelmingly popular despite some slight downticks since last fall in 2020.
9. Public school choice has strong support both from parents and the general public.
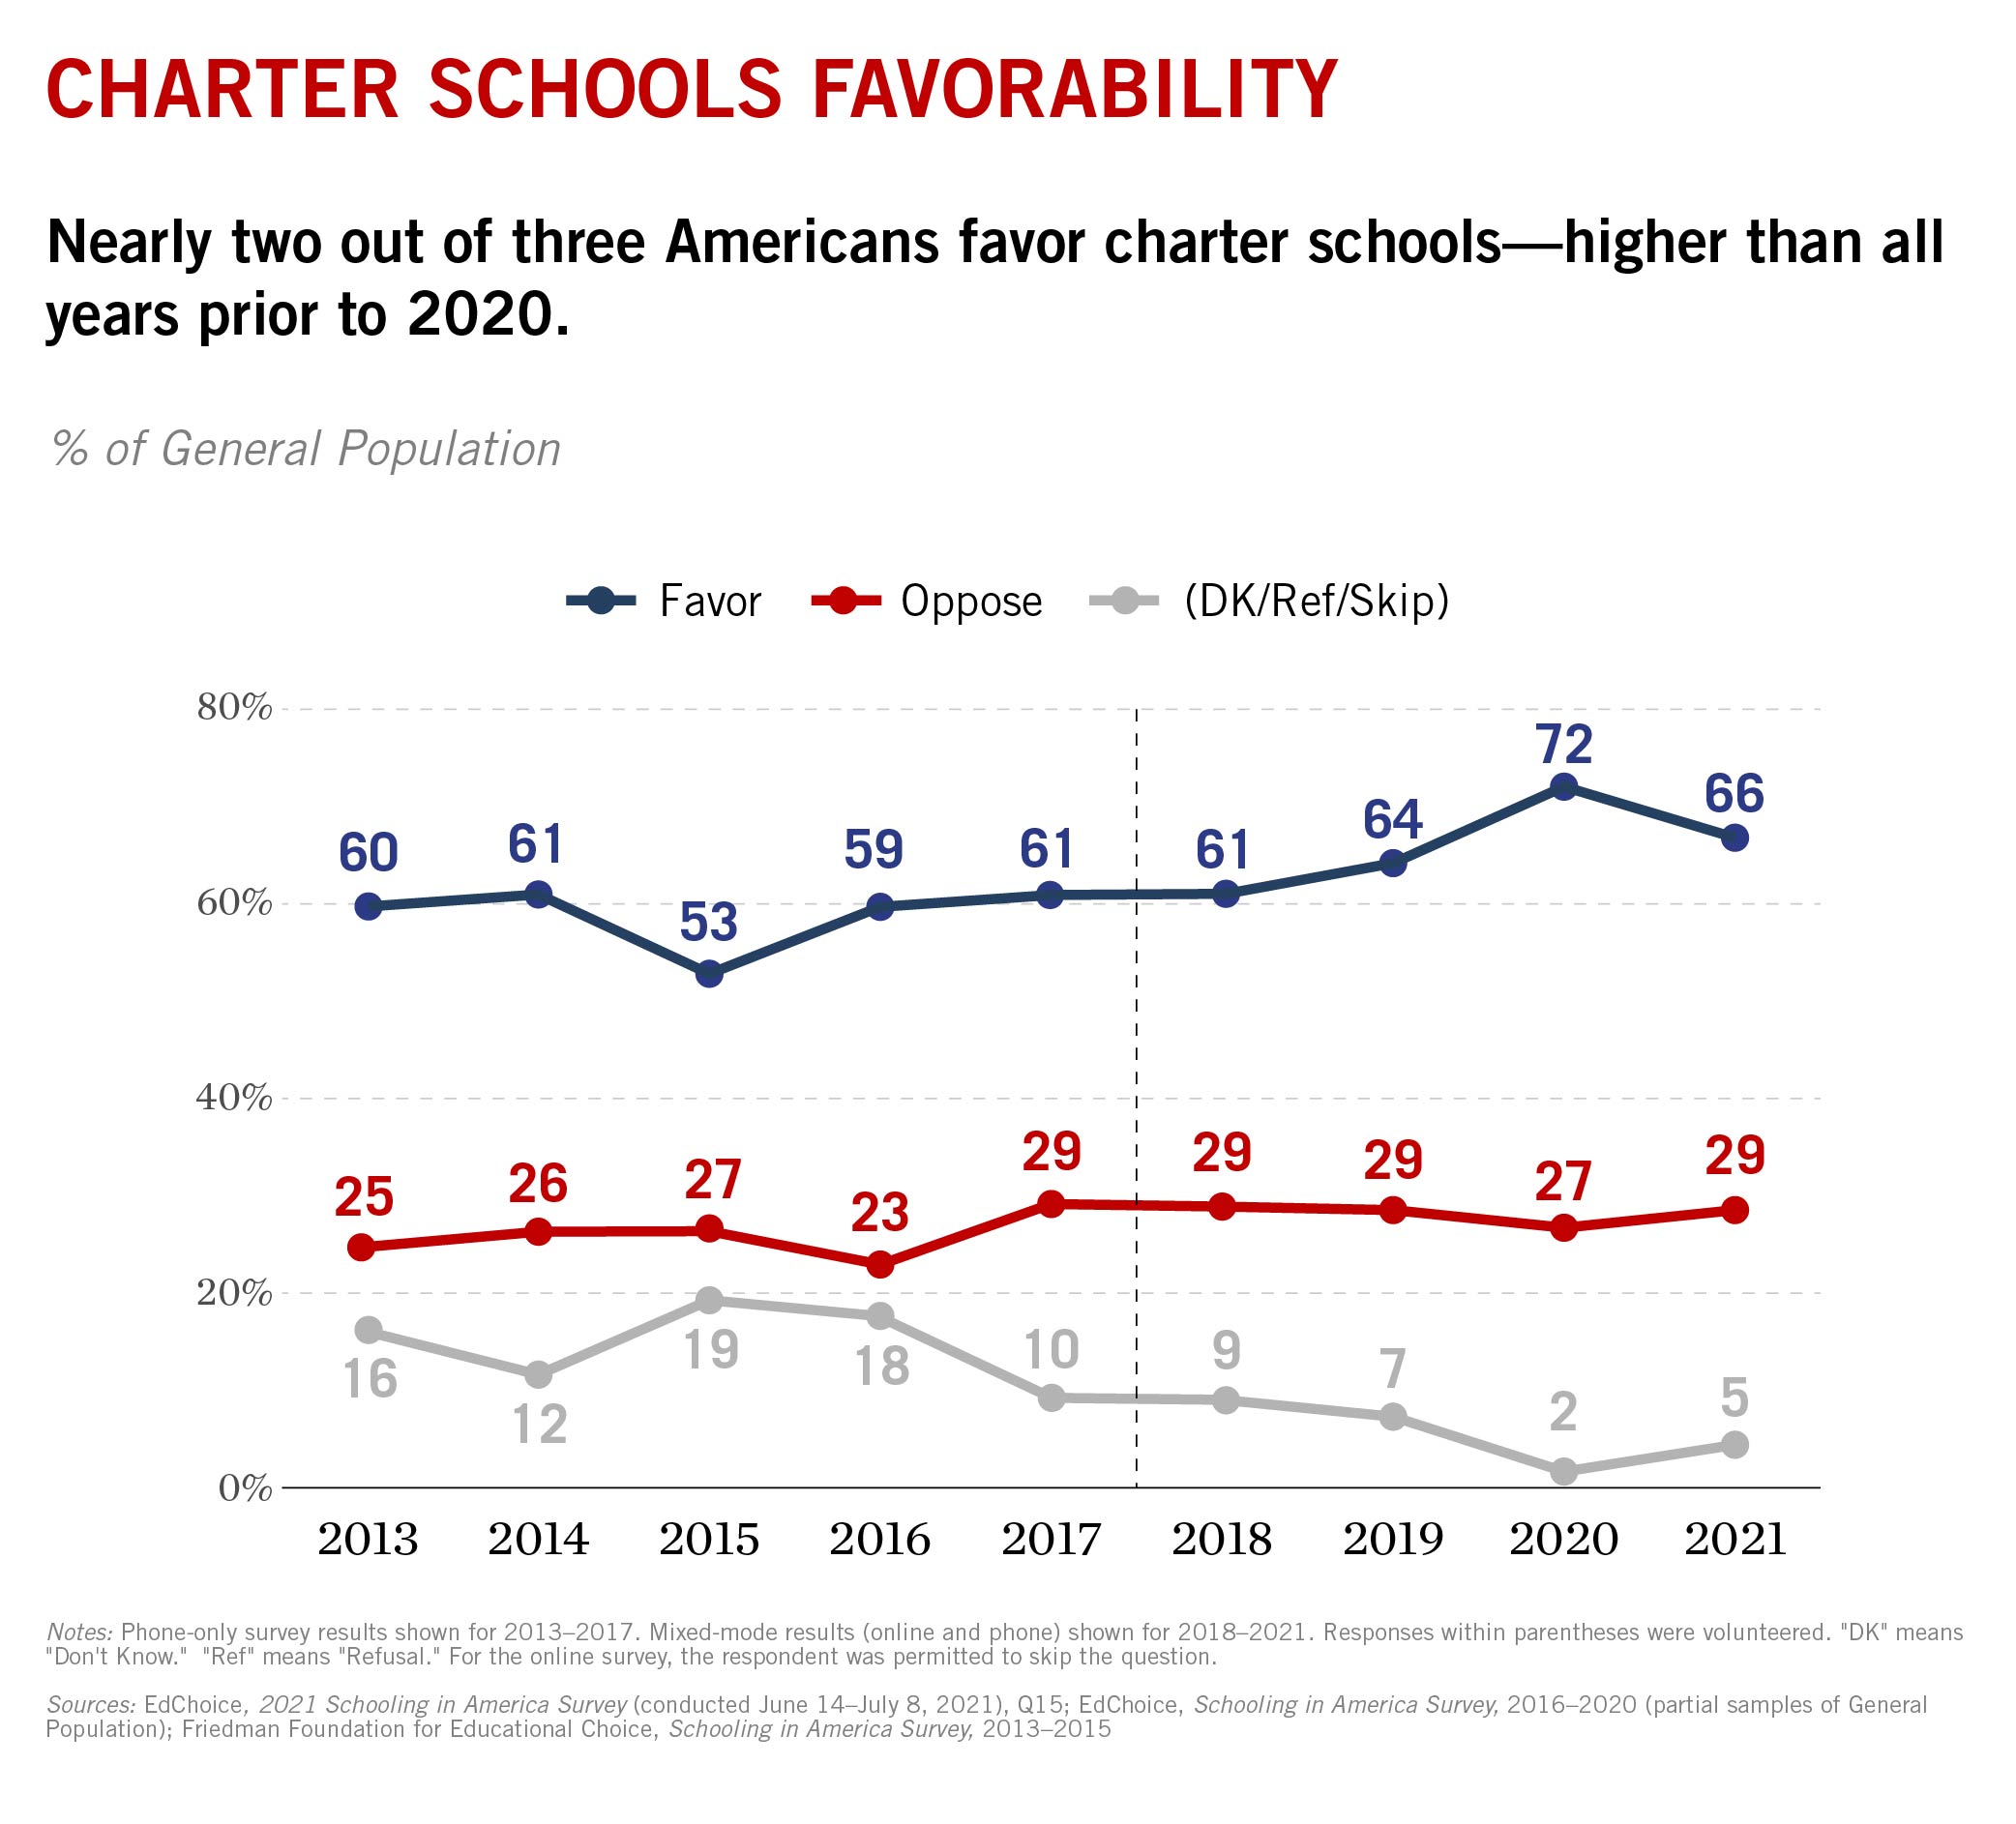
Two-thirds of the general public and three-quarters of parents support charter schools.
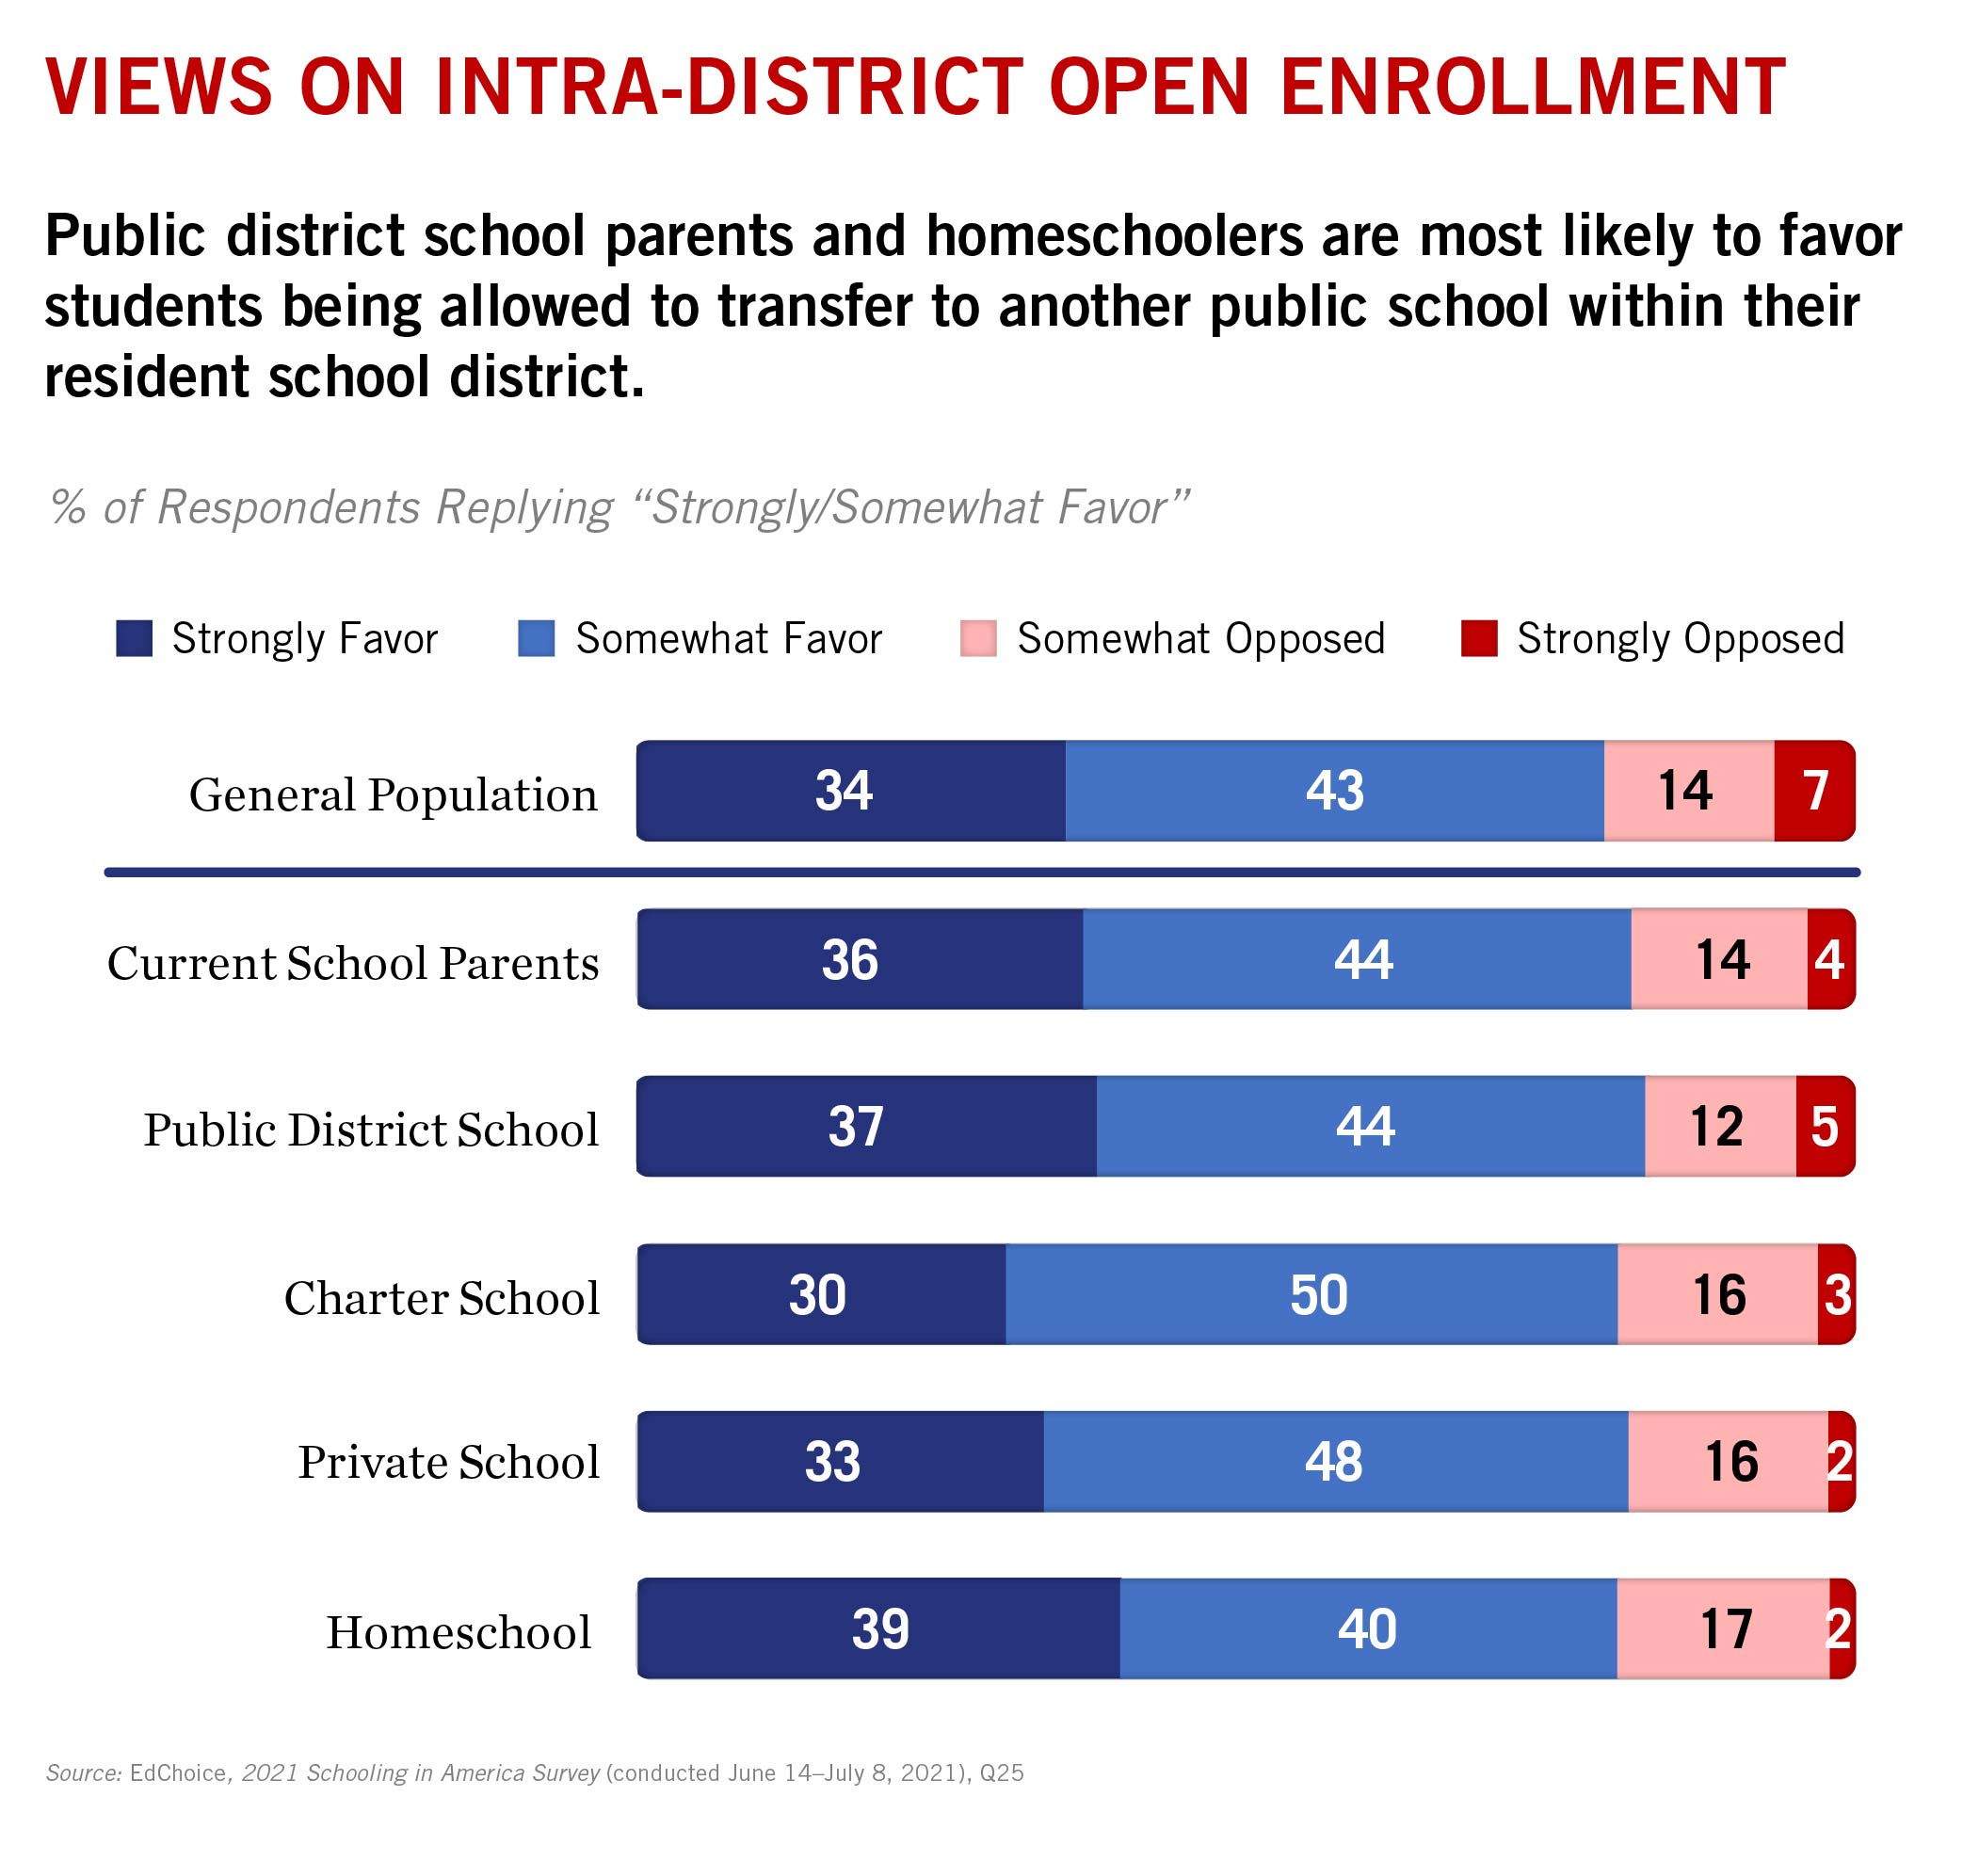
This year marked the first time we included questions about intra-district and inter-district open enrollment policies. The public and school parents indicated overwhelming support.

10. About one in five parents think parental choice in K–12 education is a very high-priority issue right now.
We asked a series of questions about what issues parents and the general public thought were most important at the time of the survey in mid-summer: 22 percent of parents placed parental choice among their top-three issues of concern. Eight percent of the general public said the same.