U.S. States Ranked by Educational Choice Share, 2017
In my continual quest to provide the most comprehensive data possible, I have revamped how we look at the educational choice share, or EdChoice share. This year, the EdChoice share looks at what proportion of all K–12 students are enrolled in an education savings account (ESA), voucher or tax-credit scholarship program.
To get this number, I divided the total number of a state’s program participants by the total number of K–12 students in the state.
This year, I was able to mainly use data from the U.S. Department of Education (USDOE). I used 2014–15 charter school enrollment data, subtracted this from the 2014–15 total public school enrollment to get regular public school enrollment, and used 2013–14 private school enrollment, which is the most recent available. I also used Ann Zeise’s homeschooler estimates and used her 2014–15 estimates in order to have numbers from the same year as much as possible.
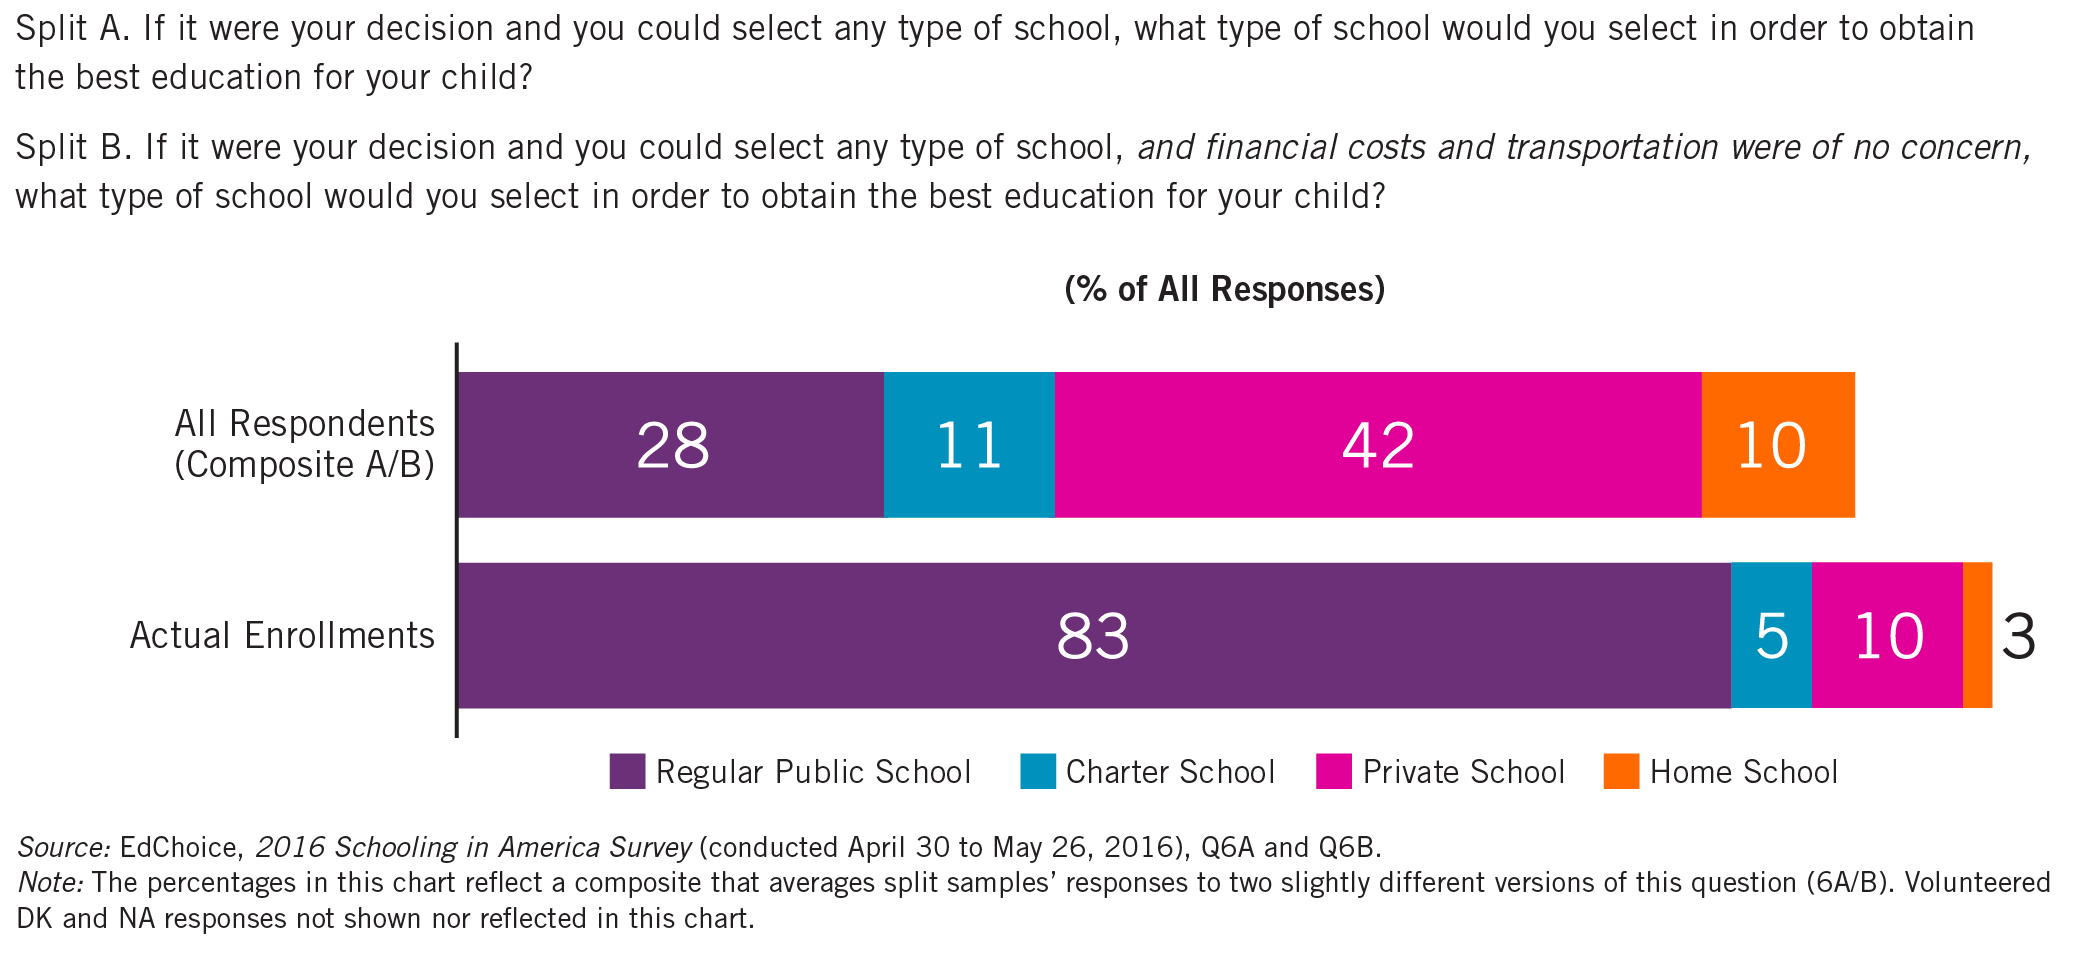
You may recognize those same four categories from our national poll:
The EdChoice Share this year instead of being calculated separate from the private school share is taken out of the private school share, creating an “other private school share.” I desperately wanted to include magnet schools, but I realized that there were magnet schools that were charter schools and the irreconcilable difference did not allow me to include both. Alas, when I’m visually imagining the parts making the whole there’s not really any way I can include overlapping Venn diagrams of data buckets. That being said, the USDOE does have enrollment data at the national level for magnet schools and has virtual school enrollment by state if you would like to explore those numbers on your own.
Now, the reason we’re all here (if you haven’t already scrolled past all of the above)…I present to you, the 2017 EdChoice Share.
On a national level:
- 8 percent of students are utilizing an educational choice program
- 4 percent attend private school by other means
- 4 percent attend a regular public school
- 9 percent attend a charter school, and
- 6 percent are homeschooled.
On a state level:
EdChoice Share 2017
| EdChoice Share Rank | State | Number of Programs | EdChoice Share | Other Private School Share | Regular Public School Share | Charter School Share | Home School Share |
|---|---|---|---|---|---|---|---|
| 1 | AZ | 5 | 4.3% | <1.0% | 76.1% | 17.4% | 2.7% |
| 2 | FL | 3 | 4.3% | 5.6% | 79.4% | 8.0% | 2.7% |
| 3 | IN | 3 | 3.6% | 5.2% | 85.1% | 3.2% | 2.9% |
| 4 | VT | 1 | 3.5% | 5.0% | 88.9% | - | 2.5% |
| 5 | WI | 5 | 3.3% | 10.5% | 80.0% | 4.3% | 1.9% |
| 6 | ME | 1 | 2.9% | 5.6% | 88.6% | 0.4% | 2.6% |
| 7 | OH | 5 | 2.4% | 8.1% | 80.7% | 6.2% | 2.6% |
| 8 | PA | 2 | 2.2% | 8.8% | 79.6% | 6.6% | 2.7% |
| 9 | IA | 2 | 1.9% | 6.8% | 88.7% | 0.1% | 2.5% |
| 10 | DC | 1 | 1.2% | 16.9% | 45.9% | 34.2% | 1.9% |
| 11 | LA | 4 | 1.0% | 12.5% | 75.8% | 8.2% | 2.5% |
| 12 | GA | 2 | 0.8% | 6.0% | 87.0% | 3.7% | 2.5% |
| 13 | AL | 2 | 0.4% | 7.4% | 89.6% | - | 2.6% |
| 14 | NC | 2 | 0.3% | 5.7% | 83.9% | 4.0% | 6.1% |
| 15 | RI | 1 | 0.3% | 11.6% | 81.6% | 3.9% | 2.5% |
| 16 | OK | 2 | 0.2% | 3.5% | 91.5% | 2.3% | 2.5% |
| 17 | MD | 1 | 0.2% | 11.7% | 83.6% | 1.9% | 2.5% |
| 18 | SC | 2 | 0.2% | 5.6% | 88.3% | 3.3% | 2.5% |
| 19 | VA | 1 | 0.2% | 7.0% | 90.5% | 0.1% | 2.3% |
| 20 | SD | 1 | 0.2% | 5.2% | 91.9% | - | 2.7% |
| 21 | UT | 1 | 0.1% | 2.8% | 85.4% | 9.1% | 2.6% |
| 22 | NV | 2 | 0.1% | 3.4% | 87.9% | 5.9% | 2.6% |
| 23 | NH | 1 | 0.1% | 9.8% | 86.3% | 1.2% | 2.6% |
| 24 | MS | 3 | 0.1% | 7.9% | 89.4% | - | 2.6% |
| 25 | KS | 1 | <0.1% | 6.5% | 90.4% | 0.5% | 2.6% |
| 26 | MT | 1 | <0.1% | 5.3% | 91.5% | - | 3.1% |
| 27 | AK | 1 | <0.1% | 4.9% | 88.8% | 3.8% | 2.6% |
| - | IL | 1 | Not Available | 9.8% | 85.0% | 2.7% | 2.5% |
| - | MN | 2 | Not Available | 7.7% | 85.4% | 5.0% | 1.9% |
| - | TN | 1 | Not Available | 7.4% | 88.0% | 2.0% | 2.6% |
| - | CO | 1 | Not Available | 4.4% | 82.4% | 10.6% | 2.5% |
| - | AK | 0 | - | 2.9% | 90.1% | 4.5% | 2.5% |
| - | CA | 0 | - | 7.4% | 82.2% | 7.9% | 2.5% |
| - | CT | 0 | - | 10.6% | 87.7% | 1.3% | 0.3% |
| - | DE | 0 | - | 13.2% | 77.3% | 7.8% | 1.7% |
| - | HI | 0 | - | 14.1% | 78.5% | 4.8% | 2.6% |
| - | ID | 0 | - | 4.3% | 86.9% | 6.1% | 2.7% |
| - | KY | 0 | - | 8.2% | 89.3% | - | 2.5% |
| - | MA | 0 | - | 10.6% | 83.5% | 3.4% | 2.5% |
| - | MI | 0 | - | 7.5% | 81.3% | 8.6% | 2.6% |
| - | MO | 0 | - | 11.7% | 83.9% | 1.9% | 2.5% |
| - | NE | 0 | - | 10.4% | 87.1% | - | 2.5% |
| - | NJ | 0 | - | 10.5% | 84.6% | 2.4% | 2.5% |
| - | NM | 0 | - | 5.1% | 86.1% | 6.2% | 2.6% |
| - | NY | 0 | - | 12.5% | 81.6% | 3.3% | 2.5% |
| - | ND | 0 | - | 5.9% | 91.3% | - | 2.7% |
| - | OR | 0 | - | 7.5% | 84.4% | 4.7% | 3.5% |
| - | TX | 0 | - | 4.4% | 88.5% | 4.7% | 2.4% |
| - | WA | 0 | - | 8.2% | 89.3% | - | 2.5% |
| - | WV | 0 | - | 4.2% | 93.3% | - | 2.5% |
| - | WY | 0 | - | 2.0% | 94.9% | 0.5% | 2.7% |
Notes: I did not include data on individual tax credit or deduction programs, unless it was a refundable credit, which is why Illinois’s and Minnesota’s EdChoice Shares are Not Available. Tennessee’s ESA program launched this month and data won’t be available until later, and Colorado’s voucher program is currently inoperable pending review by the Supreme Court of the United States. Iowa and Florida do not allow students to receive more than one tax-credit scholarship, but I assumed 25 percent of tax-credit scholarships went to multi-scholarship students in Arizona and 10 percent in all other states.