SEARCH
Executive Summary
What is the point in being able to choose any school to attend if you’re unable to get there? And how much is travel time a deterrent for parents allowing their child to attend a particular school? These were just a few of the questions that went through my head as I was poring over the 1,419 survey responses analyzed for this report.
Here are some of the key findings:
- Transportation and school commute time are both significant factors that impact families’ decisions regarding whether to participate in school choice and in which school they enroll their child. Although about 50 percent of parents across all school types report that their child’s commute to school is within 10 minutes of home, approximately two-thirds of parents reported that they would be willing to commute more than 10 minutes if it meant that their child could attend a school that was a “better fit.”
- If a school is not a traditional public school then it may have more difficulty in satisfactorily serving students’ families via school buses since transportation is not typically embedded within the infrastructure. Transportation is a costly and logistically complex endeavor for any school, let alone a choice school, and the present surveys somewhat confirm the literature in this area. Very few parents planned on their children utilizing public transportation to get to school, with students who qualify for the federal free and reduced-price lunch program who attend charter (10%) and traditional public schools (11%) being the most likely to take public transportation to school.
- More than half of private schools and about two out of five charter schools may not have any provided transportation, which may have big implications for educational choice programs. Non-religious private (52%), religious private (49%), and charter school parents (39%) are more likely to report that their child’s school does not provide transportation compared to traditional public school parents (18%). Likewise, school choice parents are also more likely to attend a school that provides transportation for an extra cost, compared to traditional public school parents—nonreligious private school (22%), religious private school (18%), charter school (17%), and traditional public school (11%).
- Children are most likely to get to school in a household member’s vehicle. Parents most often report difficulties related to traffic and congestion at school sites for drop-off and pickup, suggesting that more efficient systems for household drivers to approach a school may be beneficial in improving the school commuting process.
- When it comes to going to school in the midst of a pandemic, parents had varying levels of concern related to COVID-19 preventative measures being followed on their child’s commute to school—at least those parents who actually planned on their child physically attending school. More than half of traditional public school parents (51%) and religious private school parents (55%) prefer all of their child’s classes to be held in a school building. Combining full-time in-person and hybrid inperson preferences, approximately three out of four traditional public school parents (76%) and religious private school parents (75%) want their child to take at least some of their classes in-person physically.
Introduction
Despite the increasing proliferation of school choice policies that offer students a wider variety of schooling options, the structure of school transportation systems largely remains the same as it has been for decades.1 Adequate transportation is essential for school choice. A lack of safe and affordable transportation options for students limits their ability to choose their desired school and perpetuates inequities for students in neighborhoods with low-quality schools.2 There is a problem, though, as adapting school transportation systems for schools of choice— including public schools accessed via inter- and intra-district transfer, public charter schools, and private schools—can be a costly and logistically complicated endeavor.
The distance to school, commute time, student safety, and the cost and availability of transportation are all critical elements that determine the degree of real “choice” present in any school system, and more information is needed regarding family experiences, preferences, and challenges related to school transportation across school types.
The current pandemic has forced many parents to rethink their child’s schooling. As the world around us has changed in many ways we did not necessarily foresee at the beginning of the year, so have family preferences and challenges related to school transportation. How do we know this? We asked them.
Questions Guiding this Study
This study examines the results of a nationwide survey on transportation and school choice. The survey collected responses from 1,419 parents throughout the United States with school-aged children both before and during the COVID-19 pandemic. Ultimately, the study aims to answer the following questions:
- What are families’ experiences with transportation related to schooling?
- What are families’ major preferences, challenges, and concerns related to school transportation?
- How does transportation influence families’ decisions regarding where to send their child to school?
- What is the impact of COVID-19 on how families think about transportation to school?
Review of Previous Research: The Intersection of Transportation and School Choice
School transportation policies vary from state to state, district to district, and school sector to school sector. There are 30 states with at least some provision allowing for students to access funded transportation when attending school in a different district than their district of residence. There are 31 states that allow charter school students to access funded transportation. There are 29 states that allow private school students to access funded transportation to attend their private school, and seven states mandate transportation for private school students at levels roughly equivalent to public district school students.3
But what do we know about how pupil transportation policy intersects with school choice policy? Researchers have uncovered several important lessons.
Lesson #1: Choosing a school other than the zoned school usually means longer commutes.4
As Phillip Burgoyne-Allen, Katrina Boone, Juliet Squire, and Jennifer O’Neal Schiess state, while the “goal of school choice policies is to provide students with access to more and better schools [, …] it also means that more students are crossing town, rather than crossing the street, to get to and from school.”5
Students attending schools of choice typically have longer commutes, which suggests that students and their parents are willing to spend more time and resources on transportation to attend a school of choice that they perceive as preferable in some way to their neighborhood school option.6 For example, Steven Glazerman and Dallas Dotter studied school choice preferences by analyzing more than 22,000 applicants’ rank-ordered school lottery preference lists in Washington, D.C. The study ultimately estimated that the family of a middle school child would be willing to increase their child’s school commute by an additional 1.2 miles for a 10-point increase in the rate of “proficient” test scores.7 Results from a study on school choice constrained to local zones in Minneapolis indicate that regardless of how far a student travels to school their mode of transportation may not change with a decrease in distance.8
Lesson #2: The relationship between school choice and commute length is mediated by income and race.
Low-income students and students of color who opt to attend a school of choice frequently must travel farther and longer to their preferred school, as these students typically live in areas served by fewer high-performing schools than students living in more affluent neighborhoods.9 A study of transportation in New York, Washington D.C., Denver, Detroit, and New Orleans—all of which offer a high degree of school choice—similarly found that black students have longer school commutes than white students, including both commute time and distance.10
A study by Carolyn Sattin-Bajaj found that district and charter school administrators consider the time that students spend commuting to school as a serious concern, especially for students who spend over an hour on the bus in cities like New York and New Orleans. As one charter school leader in New Orleans comments on busing time, “I think that probably the worst part for families is when kids are on the bus for a long time, the buses are not air-conditioned, so this month [August] is pretty terrible to be a kid who’s riding the bus for an hour each day.”11 Having said that, in her review of an early draft of this report Carolyn relayed that some parents in New Orleans—including principals who were parents themselves—actually liked when their children had longer rides on buses because it was free before/after school care for their children.12
Lesson #3: In addition to distance and time, the availability and cost of transportation is a significant factor that impacts families’ decisions regarding whether to send their child to a school of choice.13
Despite a perceived increase in access to school options through school choice policies, transportation obstacles may limit families’ actual options.14 In fact, Matthew Chingos and Kristin Blagg conclude: “for too many students, the promise of choice is an empty one because they cannot physically access the school via school- or parent-provided transportation.”15
Indeed, access to transportation is a burden unequally shared by low-income families and families of color. As high-performing schools are frequently concentrated in more affluent areas, families in low-income neighborhoods may face a more dramatic trade-off between school quality and the cost, safety, and time required for various school transportation options when deciding which school to choose.16 As such, schools and school systems that do not offer affordable transportation options may inadvertently create an inequitable environment for school choice along socioeconomic lines.17
Teske, Fitzpatrick, and O’Brien found that 38 percent of surveyed parents responded that transportation influenced their choice of school, and 27 percent reported that there was a different school they would have preferred their child to attend but did not select due to challenges with transportation. Notably, the latter finding was more common among low-income families.18
Sylvia He and Genevieve Giuliano analyzed 2001 travel diary data in Los Angeles to study the relationship between school choice, location, and commute distance. They found that students from better-performing districts were less likely to travel farther to an out-of-district school than students from poorer-performing districts. However, at the same time, students from low-income households were more likely to choose their nearest school than students from higher-income households, potentially due to the time and budget constraints that a longer transportation commute would require.19
In a 2018 study of differences between school “choosers” and “non-choosers” in Detroit, Daniel Hamlin identified a lack of access to transportation as a barrier to school choice participation. Specifically, six of 12 “non-choosers,” whose children were enrolled in traditional neighborhood schools noted that they could not access their preferred school due to a lack of reliable transportation for the school commute. This was especially relevant for parents who worked during the day and would be unable to pick their child up from school in the afternoon. Parents also expressed safety concerns regarding public transportation for the commute to a school beyond neighborhood school boundaries, particularly for elementary school students. Parents also noted the added expense of gas money even if family car transportation were an option.20
Furthermore, Betheny Gross and Patrick Denice analyzed whether access to public transportation can provide students with greater access to school choice in Denver, Colorado. Results showed that public transit does not help students access the highest performing schools within the city, though it could help students reach their current school. Specifically, only 58 percent of students could reach a top-rated school within 30 minutes using public transportation. Thus, even providing greater access to public transportation does not provide students with greater access to top-rated choice schools.21
Lesson #4: Parents and school leaders worry about students’ safety when students ride public transportation.
Carolyn Sattin-Bajaj found in her interviews with Charter School Management Organization (CMO) leaders that the safety of students riding public transportation to get to school was a significant primary concern amongst parents and school staff in the choice-rich cities of New York, Detroit, and New Orleans.22 One CMO leader explained:
“Detroit has a lot of unsafe neighborhoods. Then you’re asking younger kids or high school students to ride the buses. A lot of our kids actually carry knives, and little things like that on their person. If they ride public transportation which…a lot of our families tell kids if they are gonna ride public transportation they need to have some sort of thing on them.”23
Not only is safety a concern on public transportation, but on school buses, as well. While district and school leaders implement strategies to address negative behaviors, some maintain “concern about students’ safety as a consequence of dangerous behavior and lack of confidence in bus drivers’ capacity to manage behavior problems.”24
Access to transportation influences student attendance and tardiness in school, which also impacts student achievement. For example, one charter leader from New Orleans described how starting school an hour later encouraged students to take the bus rather than drive to school, which had a positive impact in decreasing student tardiness.25
From the perspective of school and district leaders, the challenges that arise at the intersection of school choice and transportation include both high costs and logistical challenges.
Lesson #5: Providing transportation to students who attend schools other than their nearest neighborhood public school involves high costs and budget strain for districts and CMOs.26
Costs related to providing student transportation include contracting with bus vendors to offer transportation; hiring and paying staff to manage transportation operations and monitor student behavior on buses; and ensuring transportation for when buses do not run, such as paying for transit cards in cities with robust public transportation systems.27
The source of school transportation funding frequently comes from a combination of local, state, and federal funds, though this differs depending on state and location. Consequently, some districts and CMOs are fully responsible for funding transportation for students, which can substantially impact the organization’s bottom line. Providing transportation to school choice students can be quite expensive and thus represents a significant percentage of a school or district’s transportation budget.28 For example, in 2016, Boston Public Schools spent $12 million, or 11 percent of their total transportation budget, to provide transportation to charter school students, who represent 14 percent of total Boston resident students who attend a public school.29
In response to the high costs of busing for schools of choice that serve students across large geographic areas, charter school leaders implement other solutions, such as tiered busing, public transportation use, and reducing administrative staff. For example, in New Orleans and Detroit, charter schools made “financial trade-offs” in classroom materials and teacher salaries in order to provide students with yellow school bus transportation.30
Lesson #6: In addition to cost, managing the logistics of transportation for schools of choice creates significant challenges for districts and CMOs.
Interviews conducted by Sattin-Bajaj with educational leaders in choice-rich cities reveal that the main challenges administrators experience with managing transportation include contracting with bus companies, developing transportation options for large geographic areas, and ensuring appropriate transportation for students receiving special education services.31
Lesson #7: Charter schools and charter management organizations in some choice-rich cities must develop their own bus routes and transportation systems.
For example, in cities without robust or safe public transportation, such as Detroit and New Orleans, providing bus service to students becomes a necessity to ensure safe and reliable transportation. Alternatively, in New York City, managing the combination of public transit MetroCards and buses for hundreds of thousands of students offers its own logistical challenges.32
Interview participants in Sattin-Bajaj’s study—which had a small sample size and is by no means representative of all school leaders in Detroit, New Orleans, and New York City—also cite challenges related to the service and quality of bus companies, where they frequently encounter mechanical issues, and unreliable, unresponsive drivers.33 For example, interviews revealed that “overseeing student transportation places considerable logistical demands on school staff, and charter leaders express frustration about the lack of control over the quality of the bus companies and drivers. They cited frequent bus driver absences, unprofessional behavior, and poorly maintained vehicles among the issues they most often faced.”34
Additional transportation challenges for administrators in large districts that offer robust school choice options stem from the “sheer scale” of geographic areas that require transportation service, such as New York’s five boroughs. Providing transportation for students receiving special education services is also increasingly complex and costly, and it requires administrators to address potential legal concerns and ensure appropriate services with individual routes across large geographic areas.35
Like many other things, COVID-19 threw a wrench in pupil transportation. At the end of the 2019–20 school year, nearly one-fourth of parents indicated they were not at all comfortable returning their children to school in the fall and more than two-fifths said they would be extremely or very likely to opt for distance or online learning for their child.36 Researchers and the general public are now talking about pandemic pods, online learning, and how private school closures will negatively affect all schools.37 Parents are navigating school- and non-traditional educational settings unlike those they have encountered in the past.
According to the COVID-19 School Response Dashboard, led by Brown University economist Emily Oster, approximately two-thirds of schools (66%) are offering some type of in-person instruction, and nine out 10 responding schools (90%) have given families a choice between in-person instruction or remote learning as of September 27, 2020. However, there are differences by sector. Public district schools are most likely to give families a choice between in-person instruction or remote learning—98 percent, compared to 91 percent of charter schools, 75 percent of religious private schools, and 72 percent of non-religious private schools. Religious private schools are most likely to offer some type of in-person instruction—93 percent, compared to 82 percent of non-religious private schools, 62 percent of public district schools, and 57 percent of charter schools.38
Methodology
EdChoice’s National Parent Transportation Survey recruited a nationwide sample of parents with one or more school-aged children. The survey results focus on parents whose children attend four main school types: public neighborhood (traditional public) school, public charter school, private religious school, and private non-religious school. The analysis reflects responses from 1,419 parents with children attending different types of schools. A breakdown of the parent samples by school type are shown in Table 1.39

Responses were solicited nationally by Hanover Research through a panel company, Dynata, which was given specific targets to hit on responses: public district school parents (n=550), charter school parents (n=350), religious private school parents (n=350), and non-religious private school parents (n=200). Dynata invited potential respondents to take the survey in a fielding period that lasted from Sept. 26, 2019, to Oct. 2, 2019. The survey began with a screener question to ensure all respondents have a school-aged child. Of the 10,249 who started the survey, 1,910 were disqualified for not having children, and 6,312 were disqualified for being overquota once target numbers were reached for each school type. The remaining 577 responses were removed for being low quality for reasons such as speeding through the survey, or being incomplete (e.g., no responses about school type). Hanover retained 1,450 responses from 1,242 parents, as parents were able to respond multiple times about each individual child.
There were two additional fieldings of the survey. The first was from Dec. 7, 2019, to Jan. 7, 2020, which targeted the 1,242 parents who previously took the survey to gather demographic data. This yielded 905 responses. The second fielding, although unplanned at the onset of this research, was undertaken to include questions related to COVID-19 and was fielded to two different populations: (1) a nationally representative sample (National Sample) provided by a panel company and (2) the original group of parents from the fall (Refielded Group). The National Sample survey occurred between June 22, 2020 and July 4, 2020 and yielded 787 responses.40 The Refielded Group survey occurred between June 22, 2020 and July 7, 2020 and yielded 463 responses. See Appendix for additional information.
There were 46 percent of respondents in the initial sample who said their children qualify for the federal free and reduced-price lunch (FRL) program. According to the most recent data, 52 percent of all public school students (including charter school students) are FRL eligible.41
Results
The responses to our surveys align with previous studies that find transportation and school commute time are both significant factors that impact families’ decisions regarding whether to participate in school choice and in which school they enroll their child. Those who responded to both of the surveys indicate that their plans for school transportation in the current school year were impacted by the pandemic.
School Quality and Choice of Residence
Given the importance of residence in determining a family’s options for traditional, neighborhood school assignment, the sur vey prioritized asking parents about the factors that influenced their choice of residence. While parents could select from a variety of factors, most identified affordability as the most influential factor for choosing their current residence. Nearly two-thirds of charter school parents (63%) selected “affordable,” compared to more than half of religious private (56%), non-religious private (55%), and traditional public school parents (53%). The next most influential factor is “the quality of the public-school district.” Traditional public school parents (58%) were more likely than non-religious (38%) and religious private school parents (37%) to provide that response.
There does not seem to be a relationship between income and affordability for traditional school families, but using eligibility for the federal free and reduced-price lunch program (FRL) as a proxy for income we see lower-income charter and private school families saying affordability is an “extremely/very influential” factor for location of residence at levels 18 to 30 percentage points higher than non-FRL families in the same sectors. Overall, FRL-eligible families were more likely than nonFRL families to say the following were extremely/ very influential factors in their choosing where to live: close to family, good transportation options, and close to work. See Figure 1.
Although families may initially move to a specific location due to proximity to one type of school, it is possible that they decide to enroll their child in a different type of school after moving. This may happen before or after trying out the first type of school and finding a school of a different type that is a better fit for their child.

Distance and Commute Time to School
About half of all survey respondents said their child typically spent between 0 to 10 minutes traveling to school in Fall 2019. Overall, non-religious private and traditional public school parents typically report the shortest travel times to their child’s school: commute times are 0 to 10 minutes (oneway) for 55% and 51% of parents of these school types, respectively, compared to 49% of charter school parents and 45% of religious private school parents. FRL charter parents (13%) were the most likely to say their child travels more than 30 minutes (one-way). See Figure 2. The average amount of time parents in our sample said their child travels (one-way) is 15.9 minutes: 16.2 minutes for traditional public school students, 16.8 minutes for charter school students, 15.5 minutes for religious private school students, and 14.1 minutes for non-religious private school students. However, there were some students who were reported to travel more than two hours one-way to get to their school. The maximum travel times were 130 minutes for a traditional public school student, 125 minutes for a charter school student, 120 minutes for a non-religious private school student, and 76 minutes for a private religious school student.

Across school types, approximately two-thirds of parents reported that they would be willing for their child to travel more than 10 minutes to attend a better-fit school. FRL religious private school parents (20%) were the most likely to be willing for their child to travel more than 30 minutes to attend a better-fit school. Of the 597 non-FRL parents with children in traditional public, charter, or religious private school, only three respondents (one traditional public and two non-religious private) would be willing for their child to travel more than an hour to attend a better-fit school. Comparatively, 2 to 4 percent of FRL parents would be willing for their child to travel more than an hour. See Table 2.

Modes of Transportation: Plans and Reality
With the exception of traditional public school parents, parents with children in other school types most often planned for a household resident to drive their child to school: over half of religious private school parents (55%), 46 percent of charter school parents, and 44 percent of non-religious private school parents. Non-FRL charter school parents (63%) were the most likely to plan for a household resident to drive their child to school. Traditional public school parents most often planned for their child to ride the bus to school (38%), followed by being driven to school by a household resident (34%). About one-quarter of charter school parents (23%), and 13 percent of both religious and non-religious private school parents also planned for their child to ride the bus at the beginning of the school year. Very few parents (3% to 8% of overall sector results) planned on public transportation for their child’s mode of travel to school, with FRL traditional public (11%) and FRL charter school parents (10%) being the most likely to plan on public transportation. See Figure 3.

The vast majority of parents are currently using the same method of transportation they intended to use to the start of the school year (between 85% to 92%). Traditional public parents (8%) are less likely than non-religious private (15%) and charter school parents (13%) to say they are using a different method of transportation than they intended to use prior to the start of the school year. For all sectors, FRL parents are four to 18 percentage points more likely than non-FRL parents to say they are using a different method of transportation than they intended to use prior to the start of the school year. See Table 3.

Though respondents listed a variety of reasons for changing their child’s transportation to school, the most common reason is due to changes in schedule. Nearly one-fourth of respondents (23%) said their child’s transportation to school changed due to safety concerns with the planned transportation. See Figure 4

Unsurprisingly, traditional public school parents (71%) are much more likely than charter (43%), religious private (33%), and non-religious private school parents (26%) to say their child’s school provides transportation at no extra cost. For all sectors, FRL parents are more likely than non-FRL parents to say their child’s school provides transportation at no extra cost. Non-religious private (52%), religious private (49%), and charter school parents (39%) are more likely to report that their child’s school does not provide transportation compared to traditional public school parents (18%). Likewise, school choice parents are also more likely to attend a school that provides transportation for an extra cost, compared to traditional public school parents— non-religious private school (22%), religious private school (18%), charter school (17%), and traditional public school (11%). Of the traditional public school parents in our sample, 16 percent (19% FRL and 11% non-FRL) said their child’s school is not the one their child is zoned to attend. There are likely also parents in the sample whose children live within a walking zone of the school they attend. These two facts combined may explain why 18 percent of traditional public school parents (15% FRL and 21% non-FRL) said their child’s school does not provide any transportation. See Figure 5.

Concerns Regarding Getting to School
In addition to gathering information on distance, travel time, and mode of transportation, our survey also examined the most common concerns or challenges parents faced regarding transportation at their school. Across all school types, the most common issue identified was traffic congestion at pick-up/drop-off locations, which was cited by 18 percent of traditional public school, 26 percent of public charter school, 19 percent of non-religious, and 17 percent of religious private school parents. Across all school types, FRL parents (57% to 74%) were more likely than non-FRL parents (20% to 46%) to encounter transportation issues. See Figure 6.

More than half of parents who said traffic congestion at pick-up/drop-off locations was an issue said it was an ongoing problem. Parents who had any transportation-related issue resolved were overall satisfied.
A majority of respondents, regardless of sector, say their child has never ridden the bus to get to school (55% to 71%). Religious private school (71%) and non-religious private school parents (66%) are more likely to report that their child had never been a bus-rider compared to traditional public (57%) and charter school parents (55%). However, the majority of FRL parents (52% to 60%) said their child has ridden the bus to get to school, with FRL charter parents (60%) being the most likely to say their child has ridden the bus to get to school. FRL parents of all sectors were more likely than non-FRL parents to say their child has ridden the bus to get to school. This has wide-reaching implications when considering how parents are thinking about their child’s transportation to school in the fall.

Among bus riders, commute times varied by school type. Charter school parents (40%) are most likely to report that their child spent 0 to 10 minutes traveling to school (one-way) when they rode the school bus, compared to traditional public (28%) and non-religious private school parents (25%). Approximately one-third of non-religious private school (38%) and traditional public school parents (32%) report that their child spent 11 to 20 minutes traveling via bus. For all school types, non-FRL parents were more likely than FRL parents to say their child spent more than 30 minutes traveling to school (one-way) when they rode the school bus. See Figure 7. The average amount of time parents in our sample said their child travels (one-way) on a school bus is 24.3 minutes: 23.3 minutes for traditional public school students, 25.7 minutes for charter school students, 23.6 minutes for religious private school students, and 29.0 minutes for non-religious private school students. Notably, the maximum travel times previously discussed were mostly for bus riders. The longest bus ride for a non-religious private school student was 75 minutes, while the maximum travel time regardless of mode of transportation was 120 minutes for students in that sector. The longest bus ride reported for a traditional public school student was 90 minutes, while the maximum travel time regardless of mode of transportation was 130 minutes for students in that sector. The latter opens up the possibility that the student was attending a traditional public school outside of their residential district.

When it comes to reasons why their child no longer rides the school bus, FRL parents said their child is no longer allowed to ride the bus at higher rates than non-FRL parents. This is also true when it comes to parents citing safety concerns with other students.
There are notable differences in parent satisfaction with various aspects of bus service by school type. Traditional public school parents (81%) are more likely than non-religious private school parents (70%) to report they slightly or strongly agree the bus driver is/was safe and courteous. Further, non-religious private school parents (56%) are less likely than religious private (76%), traditional public (75%), and charter school parents (69%) to say they slightly or strongly agree transportation staff enforce(d) disciplinary rules appropriately. Further, more traditional public school parents (81%) slightly or strongly agree that their child’s stop locations are/were reasonable and appropriate for their child’s age. See Figure 8.

More than two-thirds of all parents slightly or strongly agree that overall, they are satisfied with their child’s school bus transportation. However, more traditional public school parents (79%), compared to charter (70%) and non-religious private school parents (67%) are likely to provide that response. See Figure 9.

Impact of COVID-19
One factor potentially influencing a family’s schooling-related decision is whether or not there is a household member who is or might be at higher risk of severe illness from COVID-19. According to the nationally representative sample mentioned in the Methodology, more than half of households (52%) have at least one person who is or might be high-risk.42 Based on the follow-up to the original survey respondents, there are some differences by sector. Charter school households (44%) are most likely to have at least one high-risk member, while closer to one-third of private school household said they had at least one high-risk family member. See Figure 10.

Different families have different preferences when it comes to the format of their child’s education in the middle of this pandemic. More than half of traditional public school parents (51%) and religious private school parents (55%) prefer all of their child’s classes to be held in a school building. Combining full-time in-person and hybrid in-person preferences, approximately three out of four traditional public school parents (76%) and religious private school parents (75%) want their child to take at least some of their classes in-person physically. See Figure 11.

Of those families who are opting for in-person schooling options this fall, all sectors saw an increase in the percentage saying a household resident drives them when comparing to everyone’s plans the previous fall. Traditional public school families had a 5 percent decrease in their plans for their child to ride the school bus compared to the previous fall, while other sectors saw that preference halved. See Figure 12.

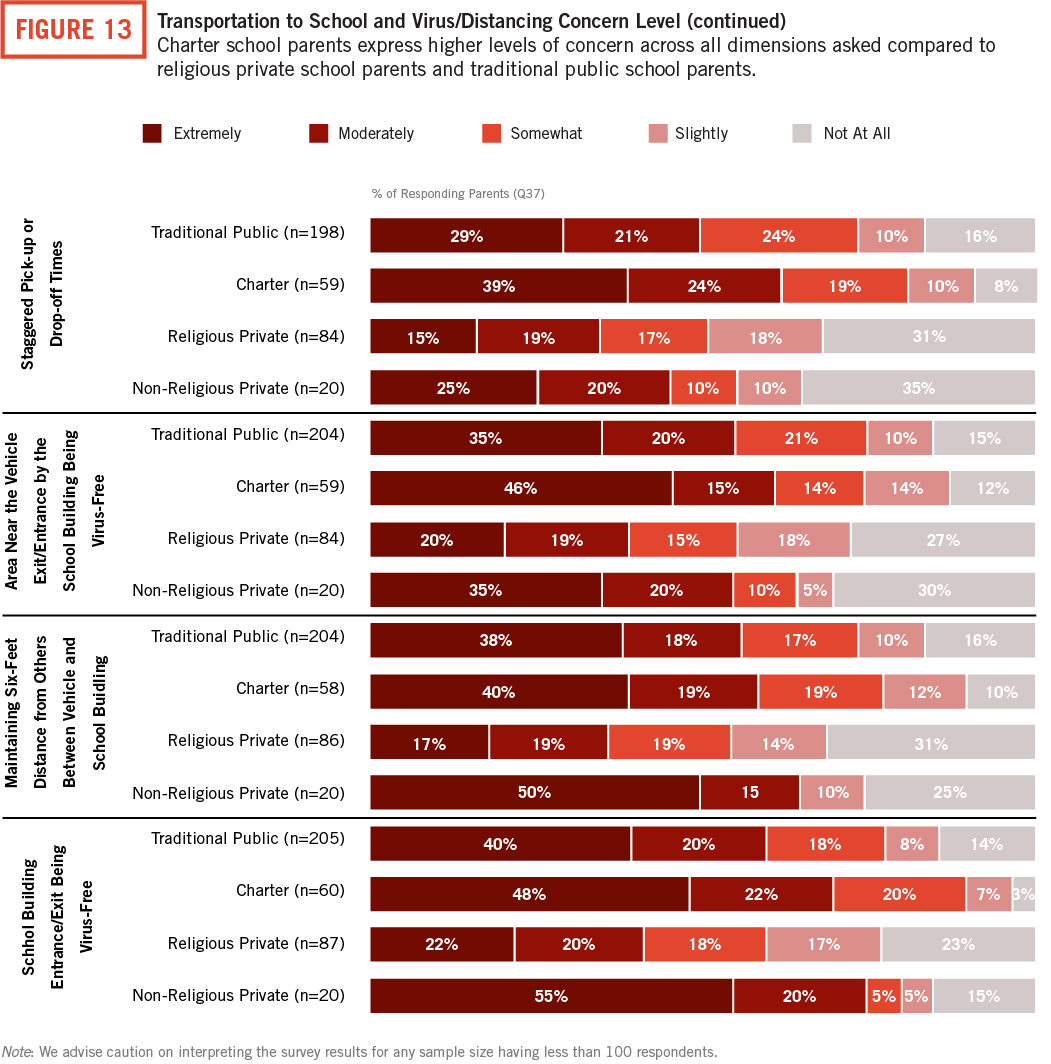
We asked all families who plan to have their children take at least some of their classes in-person to rate their concern level on their child’s travel from home to school and back as it relates to the virus and public and school-level mitigation measures. Charter school parents expressed much higher levels of concern across all dimensions compared to traditional public school parents and religious school parents. See Figure 13.

Conclusion
In this report, we present results from a survey of 1,419 parents with children attending different type of schools across the United States last fall, 463 of whom also replied this summer about their plans for Fall 2020. The analyses compare perceptions among traditional public, charter, and two types of private school (religious and non-religious private school) parents.
Across school types, several trends emerge. Although about 50 percent of parents across all school types report that their child’s commute to school is within 10 minutes of home, approximately two-thirds of parents reported that they would be willing to commute more than 10 minutes if it meant that their child could attend a school that was a “better fit.” This reflects trends observed in previous studies that find transportation and school commute time are both significant factors that impact families’ decisions regarding whether to participate in school choice and in which school they enroll their child.
The survey reveals the possibility that choice schools may have more difficulty in satisfactorily serving their students’ families via school buses, compared to public schools whose transportation system is typically embedded within the infrastructure. Transportation is a costly and logistically complex endeavor for any school, let alone a choice school, and the present surveys somewhat confirm the literature in this area. Very few parents planned on their children utilizing public transportation to get to school, with students who qualify for the federal free and reduced-price lunch program who attend charter (10%) and traditional public schools (11%) being the most likely to take public transportation to school. Parents with children that attend a traditional public school are generally more satisfied with their bus service than parents with children in other school types, particularly in areas such as safe bus drivers and staff enforcing appropriate disciplinary rules.
Non-religious private (52%), religious private (49%), and charter school parents (39%) are more likely to report that their child’s school does not provide transportation compared to traditional public school parents (18%). Likewise, school choice parents are also more likely to attend a school that provides transportation for an extra cost, compared to traditional public school parents—non-religious private school (22%), religious private school (18%), charter school (17%), and traditional public school (11%). Policymakers looking to enact or change any private school choice programs such as education savings accounts, vouchers, or tax-credit scholarships may want to consider allowing a portion of funds to be used for transportation since approximately half of the private school respondents have no transportation option provided by the school.
In general, the survey finds that the mode of transportation to school is relatively unlikely to change during the school year, with nearly 90 percent of parents reporting that they currently rely on the same mode of transportation that they had planned to use at the beginning of the school year. Notably, nearly half of parents drive, or have a household resident drive, their children to school. With the high incidence of households driving their children to school, it is worth noting that parents most often report difficulties related to traffic and congestion at school sites for drop-off and pick-up, suggesting that more efficient systems for household drivers to approach a school may be beneficial in improving the school commuting process.
When we re-surveyed in the summer, during the COVID-19 pandemic, we had nearly one-third of parents respond and tell us their plans and express their concerns. Of those who had their child in a traditional public, charter, religious private, or non-religious private school last year, more than one out of 10 (13%) said they would prefer their child to be homeschooled with curriculum determined by them or a co-op this fall, with nearly one-fourth of all previous private schoolers (24%) stating their preference to homeschool this fall. Another 15 percent of parents indicated their child would be enrolled in a school with all classes taking place at home in a virtual setting. That means more than one-fourth of those who responded to both surveys (28%) no longer had to think about their child’s transportation to school. Of the sectors with more than 50 parents responding to each dimension of the question asking how concerned they are with their child being exposed to the virus or preventative measures being followed, religious private school parents were the least concerned while charter school parents were the most concerned with child being exposed to the virus or preventative measures being followed.
Regardless of the type of school students attend or—especially in today’s environment—how they attend it, families should be able to not only choose the best fit for each student, but also be able to attend that school without transportation as a real or perceived headache.
Appendix: Survey Project and Profile
Title:Walton Family Foundation
Survey Funder: EdChoice
Survey Data Collection and Quality Control: Hanover Research
Interview Dates: September 26 to October 2, 2019; December 7, 2019 to January 7, 2020; June 22, 2020 to July 7, 2020
Interview Method: Web
Interview Length: 4 minutes, 4 seconds (median)
Language(s): English only
Sampling Method: Non-probability panel
Population Sample: Nationwide sample of school parents
Sample Size: Traditional public school parents, N=519 (partial and complete); Charter school parents, N=350 (partial and complete); Religious private school parents, N=350 (partial and complete); Non-religious private school parents, N=200 (partial and complete)
Measure of Precision: Traditional public school parents = ±4.25%; Charter school parents = ±4.57%; Religious private school parents = ±4.57%; Non-religious private school parents = ±6.89%
Weighting: No
Quotas: Public school parents (including magnet), N=550; Charter school parents, N=350; Religious private school parents, N=350; Non-religious private school parents, N=200
The authors are responsible for overall survey design; question wording and ordering; this report’s analysis, charts, and writing; and any unintentional errors or misrepresentations.
EdChoice is the survey’s sponsor and sole funder at the time of publication.
Acknowledgments
First and foremost, I am thankful for the parents, family members, and guardians that took the time to fill out the survey – this report would not exist without you. I am grateful for the generous financial support of the Walton Family Foundation, which made this research possible. I am extremely grateful to the team at Hanover Research, who assisted in project development, for their excellent work analyzing the data, compiling the literature review, and taking first pass on an initial draft. I would like to thank Matt Chingos, Carolyn Sattin-Bajaj, and Jon Valant for providing thoughtful reviews that made this report stronger. I would also like to thank those who provided feedback on presentations of this research at the 45th Annual Conference of the Association for Education Finance and Policy and the Association for Public Policy Analysis and Management’s 2020 International Conference. I am deeply grateful to the valuable feedback from my team members – Paul DiPerna, John Kristof, Marty Lueken, Mike McShane, and Mike Shaw. I am thankful for the keen eye of Jennifer Wagner and the fantastic design work of Michael Davey. All remaining errors are my own.
Questionnaire and Topline Results
Endnotes
- Phillip Burgoyne-Allen and Jennifer O’Neal Schiess (2017), Miles to Go Bringing School Transportation into the 21st Century, p. 30, retrieved from Bellwether Education Partners website: https://bellwethereducation.org/sites/default/files/Bellwether_Bus-WFF-Transportation_FINAL.pdf
- Carolyn Sattin-Bajaj (2018), “It’s Hard to Separate Choice from Transportation”: Perspectives on Student Transportation Policy from Three Choice-Rich School Districts, retrieved from Urban Institute website: https://www.urban.org/sites/default/files/publication/99246/school_transportation_policy_in_practice_0.pdf
- Michael Q. McShane and Michael Shaw (2020), Transporting School Choice Students: A Primer on States’ Transportation Policies Related to Private, Charter, and Open Enrollment Students, retrieved from EdChoice website: https://www.edchoice.org/wp-content/uploads/2020/03/Transporting-School-Choice-Students-by-Michael-Q-McShane-and-Michael-Shaw.pdf
- Sattin-Bajaj, “It’s Hard to Separate Choice from Transportation”; Kristin Blagg, Matthew Chingos, Sean P. Corcoran, Sarah A. Cordes, Joshua Cowen, Patrick Denice, . . . Jon Valant (2018), The Road to School: How Far Students Travel to School in the Choice-Rich Cities of Denver, Detroit, New Orleans, New York City, and Washington, DC, retrieved from Urban Institute website: https://www.urban.org/sites/default/files/publication/97151/the_road_to_school_7.pdf; Paul Teske, Jody Fitzpatrick, and Tracey O’Brien (2009), Drivers of Choice: Parents, Transportation, and School Choice, retrieved from Center on Reinventing Public Education website: https://www.crpe.org/sites/default/files/pub_dscr_teske_jul09_0.pdf
- Phillip Burgoyne-Allen, Katrina Boone, Juliet Squire, and Jennifer O’Neal Schiess (2019), The Challenges and Opportunities in School Transportation Today, p. 42, retrieved from Bellwether Education Partners website: https://bellwethereducation.org/sites/default/files/The%20Challenges%20and%20Opportunities%20in%20School%20Transportation%20Today_Bellwether.pdf
- Sylvia Y. He and Genevieve Giuliano (2017), School Choice: Understanding the Trade-off between Travel Distance and School Quality, Transportation, 45(5), pp. 1475–1498, https://doi.org/10.1007/s11116-017-9773-3; Teske, Fitzpatrick, and O’Brien, Drivers of Choice
- Steven Glazerman and Dallas Dotter (2017) Market Signals: Evidence on the Determinants and Consequences of School Choice From a Citywide Lottery, Educational Evaluation and Policy Analysis, 39(4), pp. 593–619, https://doi.org/10.3102/0162373717702964
- John R. Sirard, Kelsey McDonald, Patrick Mustain, Whitney Hogan, and Alison Helm (2015), Effect of a School Choice Policy Change on Active Commuting to Elementary School, American Journal of Health Promotion, 30(1), pp. 28–35, https://doi.org/10.4278/ajhp.130510-QUAN-236
- Burgoyne-Allen, Boone, Squire, and Schiess, The Challenges and Opportunities in School Transportation Today
- Blagg et al., The Road to School
- Sattin-Bajaj, “It’s Hard to Separate Choice from Transportation”, p. 19
- Carolyn Sattin-Bajaj (associate professor of education, the Gervitz Graduate School of Education, University of California, Santa Barbara), e-mail message to author, April 8, 2020
- Phillip Burgoyne-Allen, Bonnie O’Keefe, and Jennifer O’Neal Schiess (2019) Intersection Ahead: School Transportation, School Integration, and School Choice, retrieved from Bellwether Education Partners website: https://bellwethereducation.org/sites/default/files/Bellwether_WVPM-IntersectionAhead_FINAL.pdf; Teske, Fitzpatrick, and O’Brien, Drivers of Choice; Glazerman and Dotter, Market Signals; He and Giuliano, Understanding the Trade-off between Travel Distance and School Quality; Daniel Hamlin (2018), “The Types of Kids We Get Are Different”—The Distinguishing Characteristics of School Choosers in Detroit, Michigan, Journal of School Choice, 12(1), pp. 52–79
- David T. Marshall (2017), Equity and Access in Charter Schools: Identifying Issues and Solutions, Education Policy Analysis Archives, 25(83), https://doi.org/10.14507/epaa.25.2745; Hamlin, “The Types of Kids We Get Are Different”; Matthew Chingos and Kristin Blagg (2017), Student Transportation and Educational Access: How Students Get to School in Denver, Detroit, New Orleans, New York City, and Washington, DC, retrieved from Urban Institute website: https://www.urban.org/sites/default/files/publication/88481/transportation_brief_final_errata_2.pdf
- Chingos and Blagg, Student Transportation and Educational Access, p. v
- Betheny Gross and Patrick Denice (2017), Can Public Transportation Improve Students’ Access to Denver’s Best Schools of Choice?, retrieved from Center for Reinventing Public Education website: https://www.crpe.org/sites/default/files/crpe-public-transportation-denver.pdf
- Burgoyne-Allen, O’Keefe, and Schiess, Intersection Ahead
- Teske, Fitzpatrick, and O’Brien, Drivers of Choice
- He and Giuliano, Understanding the Trade-off between Travel Distance and School Quality
- Hamlin, “The Types of Kids We Get Are Different”
- Gross and Denice, Can Public Transportation Improve Students’ Access to Denver’s Best Schools of Choice?
- Sattin-Bajaj, “It’s Hard to Separate Choice from Transportation”
- Ibid., pp. 16–17
- Ibid., p. 18
- Sattin-Bajaj, “It’s Hard to Separate Choice from Transportation”
- Ibid.; Sirard, McDonald, Mustain, Hogan, and Helm, Effect of a School Choice Policy Change on Active Commuting to Elementary School
- Sattin-Bajaj, “It’s Hard to Separate Choice from Transportation”
- Chingos and Blagg, Student Transportation and Educational Access
- Boston Municipal Research Bureau (2016), The True Cost of Boston’s Charter Schools, BRMB Special Report, retrieved from http://www.bmrb.org/wp-content/uploads/2016/04/SR16-2Charter.pdf
- Sattin-Bajaj, “It’s Hard to Separate Choice from Transportation”
- Ibid.
- Ibid.
- Ibid.
- Ibid., p. 16.
- Sattin-Bajaj, “It’s Hard to Separate Choice from Transportation”
- Paul DiPerna, Andrew D. Catt, and Michael Shaw (2020), 2020 Schooling in America: Public Opinion on COVID-19 and K–12 Education, retrieved from EdChoice website: https://www.edchoice.org/wp-content/uploads/2020/07/UPDATED-07-2020-SIA-slide-deck-ONE-1.pdf
- Michael B. Horn (2020), The Rapid Rise of Pandemic Pods, EducationNext, 20(4), retrieved from https://www.educationnext.org/rapid-rise-pandemic-pods-will-parent-response-covid-19-lead-to-lasting-changes; Michael B. Henderson, David Houston, Paul E. Peterson, M. Danish Shakeel, and Martin R. West (2020), Amid Pandemic, Support Soars for Online Learning, Parent Poll Shows, EducationNext, 20(4), retrieved from https://www.educationnext.org/amid-pandemic-support-soars-online-learning-parent-poll-shows-2020-education-next-survey-public-opinion; Martin R. West (2020), If Many More Private Schools Close, All Schools Will Suffer, EducationNext, 20(4), retrieved from https://www.educationnext.org/if-many-more-private-schools-close-all-schools-will-suffer
- Author’s analysis; Emily Oster (2020), COVID-19 School Response Dashboard, retrieved October 12, 2020 from https://statsiq.co1.qualtrics.com/public-dashboard/v0/ dashboard/5f62eaee4451ae001535c839#/dashboard/5f62e aee4451ae001535c839?pageId=Page_1ac6a6bc-92b6-423e9f7a-259a18648318. Data cited are self-reported and may or may not be representative of population.
- While the original sample of parents also included 31 parents with a child in a magnet school, they were dropped from this report due to small sample sizes. The magnet school results can be found in the accompanying Questionnaire and Toplines document.
- For findings from the national sample, see: Andrew D. Catt (2020, August 28), What Parents Think About Getting to School During a Pandemic [Blog post], retrieved from EdChoice website: https://www.edchoice.org/engage/what-parents-think-about-getting-to-school-during-a-pandemic; Hanover Research (2020), 2020 Parent Transportation Survey (New National Sample): Topline Tables, retrieved from EdChoice website: https://www.edchoice.org/wp-content/uploads/2020/08/2020-National-Parent-Transportation-Survey-Nationally-Representative-Sample-Toplines.pdf
- Thomas D. Snyder, Cristobal de Brey, and Sally A. Dillow (2019), Digest of Education Statistics 2018, 54th edition (NCES 2020-009), p. 82, table 204.10, retrieved from National Center for Education Statistics website: https://nces.ed.gov/pubs2020/2020009.pdf
- Catt, What Parents Think About Getting to School During a Pandemic