2022 EdChoice Share: Where Are America’s Students Educated?
After a year of incredible growth in educational opportunities, America is sure to see more families than ever choosing schooling settings that are best for their kids—not simply settling for the assigned district school option.
This series coins the term Educational Choice Share (or EdChoice Share) to represent the proportion of all K–12 students who are enrolled in an education savings account (ESA), school voucher, tax-credit ESA or tax-credit scholarship program.
To get this number, EdChoice divides the total number of a state’s educational choice program participants by the total number of K–12 students in the state, regardless of schooling sector. Not all program data are reported for the most recent school year, so carry-forward participation data are used for programs that don’t yet have 2021–22 data.
This post also provides a state-by-state breakdown of public district school share, charter school share, homeschool share and “out of pocket” private school share—which we describe as “by other means” or “Other Private School Share.”
Additionally, evidence suggests that homeschooling figures have surged during recent school years. We’re not yet able to incorporate these changes into our state-based calculations, but we suspect once they are that both homeschooling and overall non-district enrollment percentages will rise.
The charter school enrollment data are for 2019–20 and the public district school enrollment data (total public minus charter) reflect the 2018–19 school year. The private school enrollment data are for 2019–20 and homeschooler estimates are for 2018–19.
Why do we care about this?
Data from our 2021 national poll shows American parents are not able to access the types of schools they would prefer for their children.
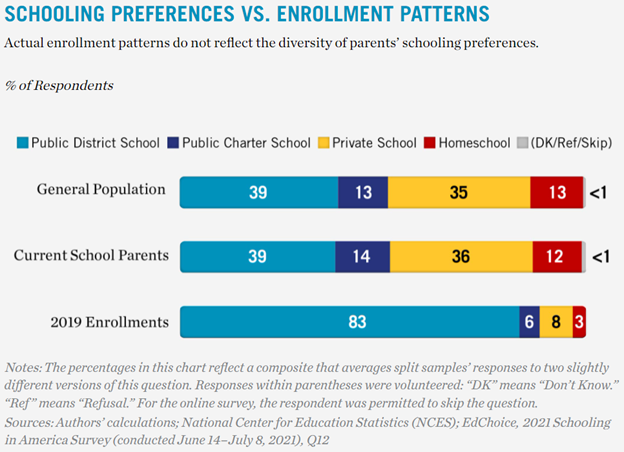
If our K–12 education system is innovating and finding ways to better serve students and their families, then—as time goes on—we would expect the numbers below to begin looking more and more like the chart above.
On a national level:
- 1.1 percent of students are utilizing an educational choice program
- 7.3 percent attend private school by other means
- 82.4 percent attend a public district school
- 6.6 percent attend a charter school, and
- 2.6 percent are homeschooled.
On a state level:
| State | Number of Programs | EdChoice Share | Other Private School Share | Public District School Share | Charter School Share | Home School Share |
|---|---|---|---|---|---|---|
| Arizona | 5 | 6.6% | <1% | 73.6% | 19.0% | 2.6% |
| Florida | 5 | 5.6% | 6.4% | 74.8% | 10.4% | 2.8% |
| Wisconsin | 5 | 5.2% | 8.4% | 78.8% | 5.4% | 2.3% |
| Vermont | 1 | 4.2% | 6.0% | 87.3% | - | 2.5% |
| Indiana | 4 | 3.9% | 6.0% | 83.4% | 4.2% | 2.6% |
| Ohio | 8 | 3.7% | 6.7% | 81.5% | 6.4% | 1.6% |
| Pennsylvania | 2 | 3.3% | 8.8% | 76.9% | 8.4% | 2.5% |
| Iowa | 2 | 2.2% | 5.6% | 89.6% | <0.1% | 2.6% |
| Maine | 1 | 2.2% | 7.1% | 86.7% | 1.3% | 2.7% |
| District of Columbia | 1 | 2.0% | 13.8% | 63.9% | 18.1% | 2.2% |
| New Hampshire | 3 | 1.2% | 7.9% | 85.9% | 2.3% | 2.6% |
| North Carolina | 3 | 1.2% | 5.6% | 78.6% | 7.0% | 7.6% |
| Louisiana | 4 | 1.1% | 13.3% | 73.2% | 10.8% | 1.6% |
| Georgia | 2 | 1.1% | 6.4% | 84.7% | 4.4% | 3.4% |
| South Dakota | 1 | 0.6% | 7.0% | 89.4% | - | 3.1% |
| Oklahoma | 2 | 0.5% | 4.1% | 81.4% | 11.5% | 2.6% |
| Alabama | 1 | 0.4% | 7.6% | 89.2% | 0.2% | 2.6% |
| Rhode Island | 1 | 0.4% | 9.6% | 80.9% | 6.6% | 2.5% |
| Virginia | 1 | 0.3% | 7.6% | 89.4% | 0.1% | 2.6% |
| Illinois | 2 | 0.3% | 8.7% | 85.3% | 3.0% | 2.6% |
| Nevada | 1 | 0.3% | 3.7% | 82.1% | 11.4% | 2.5% |
| South Carolina | 2 | 0.3% | 5.8% | 85.9% | 5.5% | 2.6% |
| Maryland | 1 | 0.2% | 12.3% | 82.7% | 2.3% | 2.5% |
| Kansas | 1 | 0.2% | 7.6% | 89.0% | 0.6% | 2.6% |
| Mississippi | 3 | 0.1% | 7.2% | 89.4% | 0.5% | 2.8% |
| Utah | 2 | 0.1% | 2.2% | 83.9% | 11.3% | 2.5% |
| Arkansas | 2 | <0.01% | 4.5% | 83.6% | 8.0% | 3.8% |
| Tennessee | 2 | <0.01% | 9.0% | 84.7% | 3.7% | 2.6% |
| Montana | 1 | <0.01% | 5.2% | 91.5% | - | 3.3% |
| Missouri | 1 | Not Available | 9.4% | 85.4% | 2.5% | 2.7% |
| Kentucky | 1 | Not Available | 9.7% | 87.8% | - | 2.6% |
| West Virginia | 1 | Not Available | 4.7% | 92.6% | - | 2.7% |
| Minnesota | 2 | Not Available | 7.5% | 83.6% | 6.9% | 2.0% |
| Wyoming | 0 | - | 2.1% | 94.6% | 0.6% | 2.6% |
| Washington | 0 | - | 7.8% | 90.2% | 0.3% | 1.7% |
| North Dakota | 0 | - | 7.6% | 90.0% | - | 2.4% |
| Alaska | 0 | - | 2.3% | 89.2% | 6.0% | 2.6% |
| Nebraska | 0 | - | 10.0% | 87.5% | - | 2.5% |
| Texas | 0 | - | 4.4% | 86.6% | 6.5% | 2.5% |
| Connecticut | 0 | - | 9.3% | 86.3% | 1.9% | 2.6% |
| New Mexico | 0 | - | 5.4% | 86.1% | 8.5% | <0.1% |
| Massachusetts | 0 | - | 10.1% | 84.5% | 4.7% | 0.7% |
| Idaho | 0 | - | 4.6% | 83.3% | 9.5% | 2.6% |
| New Jersey | 0 | - | 11.0% | 82.6% | 3.9% | 2.6% |
| Oregon | 0 | - | 7.0% | 82.4% | 7.1% | 3.5% |
| Michigan | 0 | - | 7.8% | 80.3% | 9.3% | 2.6% |
| Colorado | 0 | - | 4.9% | 80.1% | 14.2% | 0.8% |
| New York | 0 | - | 11.8% | 79.9% | 5.7% | 2.6% |
| California | 0 | - | 7.9% | 79.6% | 10.0% | 2.5% |
| Hawaii | 0 | - | 18.2% | 73.8% | 5.4% | 2.5% |
| Delaware | 0 | - | 12.6% | 58.3% | 27.3% | 1.8% |
Notes: U.S. territories were not included in these calculations, nor were data on individual tax credit or deduction programs, unless it was a refundable credit (such as Alabama’s Parent Taxpayer Refundable Tax Credits), which is why Minnesota’s EdChoice Share is Not Available. EdChoice assumes 20 percent of tax-credit scholarships went to multi-scholarship students in Arizona, whereas other tax-credit scholarship programs are assumed to have a 1:1 student-to-scholarship ratio for the purposes of these rankings.