Debunking Arguments Against School Choice: “Privatization” Drains Money From Already “Underfunded” Public Schools
I wish I had a nickel for each time I’ve read or heard something about how school choice siphons resources from public schools or how it will cripple a public education system. The rhetoric can be fierce at times. Some even have claimed that school choice advocates somehow want to or intend to topple public education.
Such claims are a far cry from the truth. In this post, I’ll address the “siphon” arguments in a very simple, but intuitive, manner.
To evaluate these claims, it might be useful to first ask: what would it take to cripple public education?
Total expenditures nationwide for FY 2014 exceeded $625 billion. So at first blush it would seem that considerable effort and resources would be required to take down public education. Based on the most recent data available on private school choice programs, total expenditures during FY 2014 on private school choice programs was $2.2 billion. This includes all private school choice programs—education savings accounts, vouchers, tax-credit scholarships and individual tax credits/deductions. Thus, total expenditures on private school choice programs as a share of total resources devoted to public education nationwide is 0.4 percent.
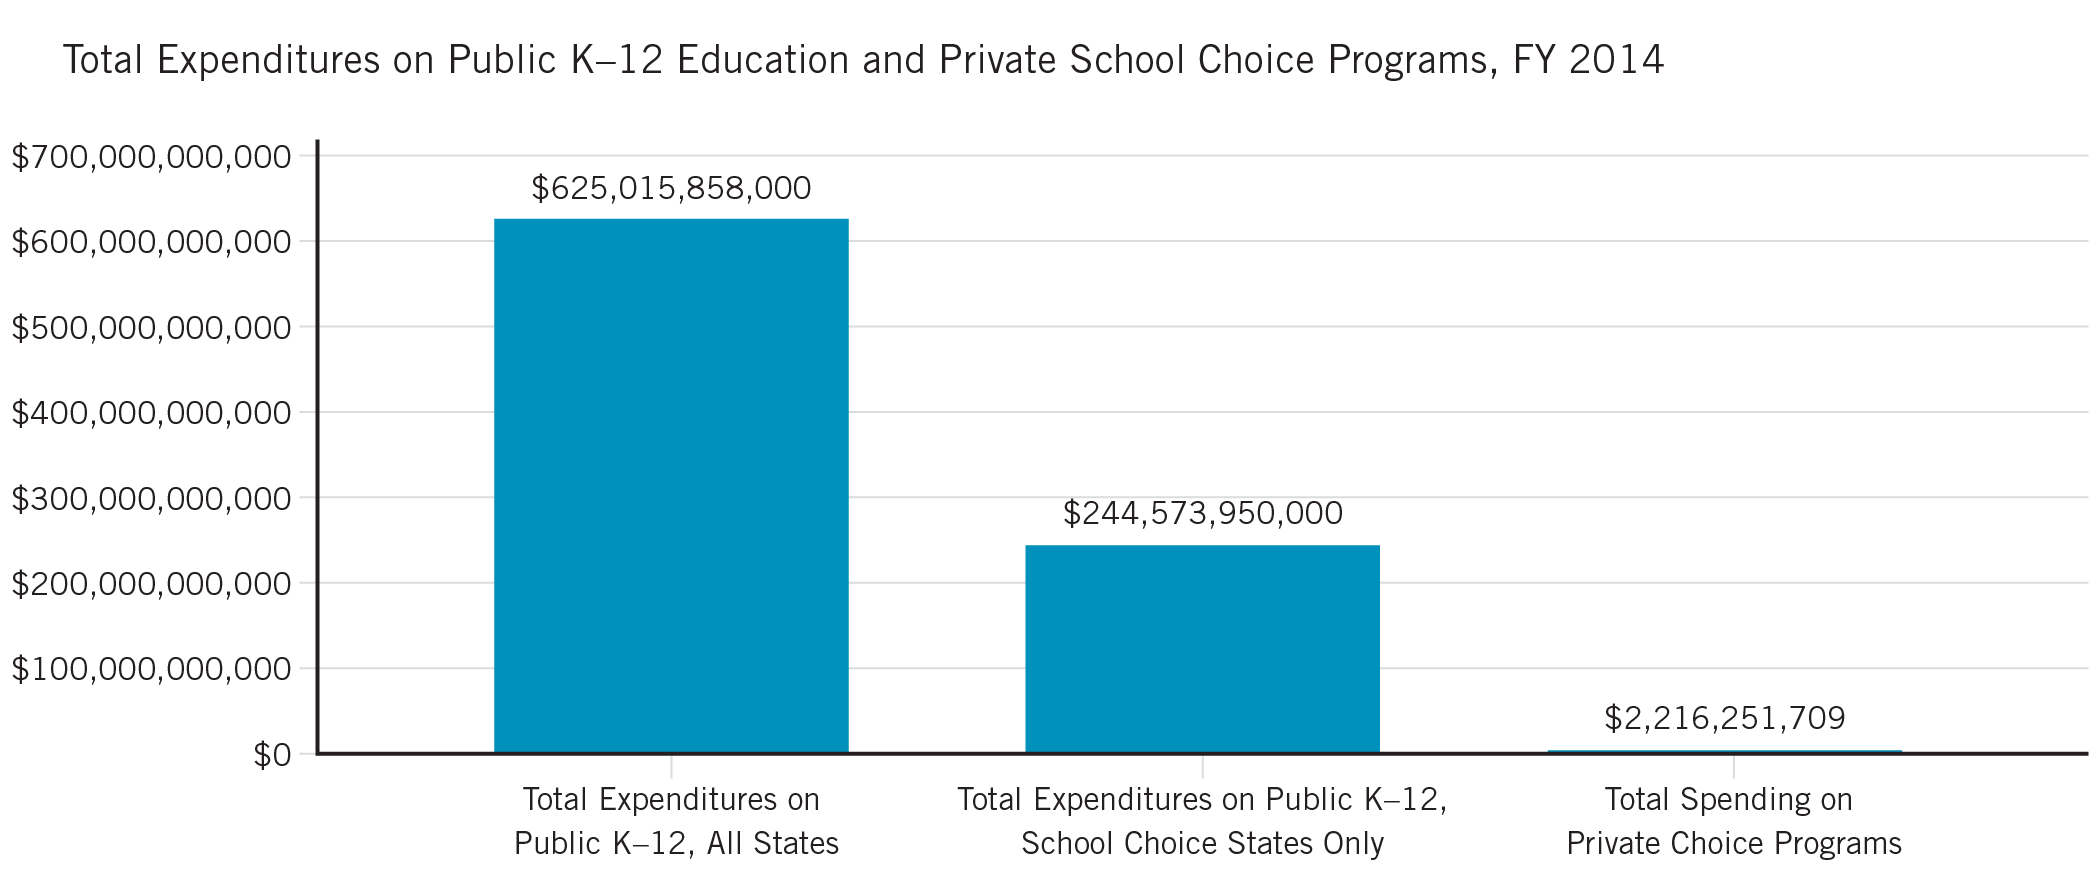
Of course, school choice policy is handled at the state level, and not all states have private school choice. It’s more appropriate to put spending on school choice with resources devoted to public education in states that have private school choice policies in place.
There are 21 states with families participating in private choice programs. Total expenditures on public K–12 in these states during FY 2014 was $244.6 billion. Thus, resources allocated to expanding educational options comprised 0.9 percent of the resources devoted to those states’ public education systems.
If we break these expenditure data out by state, the story hardly changes. We see that in states with lots of school choice, like Arizona, Florida and Wisconsin, the share of resources devoted to expanding educational options are roughly 2 to 3 percent. Notably, these are states that have had private school choice programs in place for at least a decade. In most other states, the shares are less than 1 percent.
Participation and costs of private school choice programs by state
| State Name | Enrollment, FY 2014 | Choice Program Participation* | Overall Private School Choice Program Participation Rate** | Total K-12 Public School Expenditures, FY 2014 | Total spending on private choice programs*** | Private choice spending as % of total K-12 public school spending |
|---|---|---|---|---|---|---|
| ALABAMA | 740,081 | 4,279 | 0.6% | $7,578,390,000 | $12,195,718 | 0.2% |
| ARIZONA | 943,937 | 67,052 | 6.6% | $8,101,041,000 | $158,703,973 | 2.0% |
| DISTRICT OF COLUMBIA | 44,942 | 1,520 | 3.3% | $1,313,289,000 | $20,000,000 | 1.5% |
| FLORIDA | 2,708,022 | 136,462 | 4.8% | $26,523,658,000 | $582,013,083 | 2.2% |
| GEORGIA | 1,699,185 | 17,102 | 1.0% | $17,658,341,000 | $78,564,497 | 0.4% |
| ILLINOIS | 2,060,632 | 0 | 0.0% | $30,199,722,000 | $80,166,199 | 0.3% |
| INDIANA | 1,007,121 | 97,243 | 8.8% | $10,892,114,000 | $216,172,064 | 2.0% |
| IOWA | 501,763 | 10,848 | 2.1% | $6,296,234,000 | $24,106,647 | 0.4% |
| LOUISIANA | 665,441 | 8,480 | 1.3% | $7,985,369,000 | $42,515,651 | 0.5% |
| MINNESOTA | 804,580 | 0 | 0.0% | $11,127,875,000 | $255,694,389 | 2.3% |
| MISSISSIPPI | 492,421 | 173 | 0.0% | $4,460,359,000 | $631,607 | 0.0% |
| NEW HAMPSHIRE | 184,684 | 178 | 0.1% | $2,792,382,000 | $58,500 | 0.0% |
| NORTH CAROLINA | 1,441,391 | 6,145 | 0.4% | $13,479,223,000 | $10,424,835 | 0.1% |
| OHIO | 1,601,566 | 47,286 | 2.9% | $21,699,962,000 | $206,095,916 | 0.9% |
| OKLAHOMA | 670,069 | 1,919 | 0.3% | $6,009,958,000 | $3,485,923 | 0.1% |
| PENNSYLVANIA | 1,605,292 | 49,813 | 3.0% | $27,033,388,000 | $117,572,361 | 0.4% |
| RHODE ISLAND | 135,084 | 503 | 0.4% | $2,231,807,000 | $1,500,000 | 0.1% |
| SOUTH CAROLINA | 729,386 | 2,100 | 0.3% | $8,436,959,000 | $8,000,000 | 0.1% |
| UTAH | 570,423 | 905 | 0.2% | $4,381,995,000 | $3,739,717 | 0.1% |
| VIRGINIA | 1,273,211 | 1,368 | 0.1% | $15,451,418,000 | $4,666,915 | 0.0% |
| WISCONSIN | 865,119 | 72,281 | 7.7% | $10,920,466,000 | $389,943,713 | 3.6% |
| Total | 20,744,350 | 525,657 | 2.5% | $244,573,950,000 | $2,216,251,709 | 0.9% |
* Based on most recent figures available from program administrative agencies
** Participation rates reflect students who participate in a private education choice program and do not include families that take tax deductions
*** Spending on all types of private choice programs are included: education savings accounts, vouchers, tax-credit scholarships, and tax credits/deductions
Soruces: U.S. Census Bureau; EdChoice
Information like this will never stop avid school choice opponents from making unfounded claims that education is somehow a zero-sum game, where investing in expanding educational options for parents is only accomplished by taking resources from the public sector. We don’t view higher education in this manner, and we certainly don’t hear special interest groups complaining about students who transfer from a public university to enroll in a private one (or vice versa).
In fact, how we fund public K–12 is very different from how we fund higher education (or any other public enterprise in our society). When a student in college transfers to another, all the funds follow the student—state funds, Pell grants, etc. In public K–12, however, it is common for districts to keep all funds raised from local property taxes and most of the federal funds. Moreover, school choice programs are typically designed such that even a portion of the state dollars stay with districts where students leave via a choice program. This is largely why no fiscal analyses to date have found any program which generates a net loss for taxpayers.
Hopefully part of the conversation about school choice can move beyond the fiscal impact and onto what really matters: what school choice means for families and their children.