EdChoice Public Opinion Tracker: General Population and School Parents – February 2023
Last month, we highlighted the major educational wins for Iowa and Utah. These states wasted little time in 2023 to expand educational options for families in their states.
As I sit to write this piece, my home state of Arkansas may soon follow Iowa and Utah’s lead. My colleague and friend Joey Magana summed it up brilliantly, “Arkansas’ Children Educational Freedom Account Program would be one of the most expansive ESAs in the country and has the potential to help tens of thousands of students obtain the educational services that best fit their needs. It is a model for other states to emulate.”
While this is exciting news for Arkansans, as well as the overall school choice movement, it isn’t the only story in American education today.
In partnership with Morning Consult, EdChoice surveyed a nationally representative sample of American adults 18 and older (N=2,200) from February 13-14, 2023. With additional sampling, we obtained responses from 1,113 parents of children currently in K-12 education.
This month we continued our dive into microschooling, as well as why children choose to leave one school type for another. Additionally, we asked a new question about gifted, talented, and honors classes. The full report can be found here. Here are a few quick takeaways:
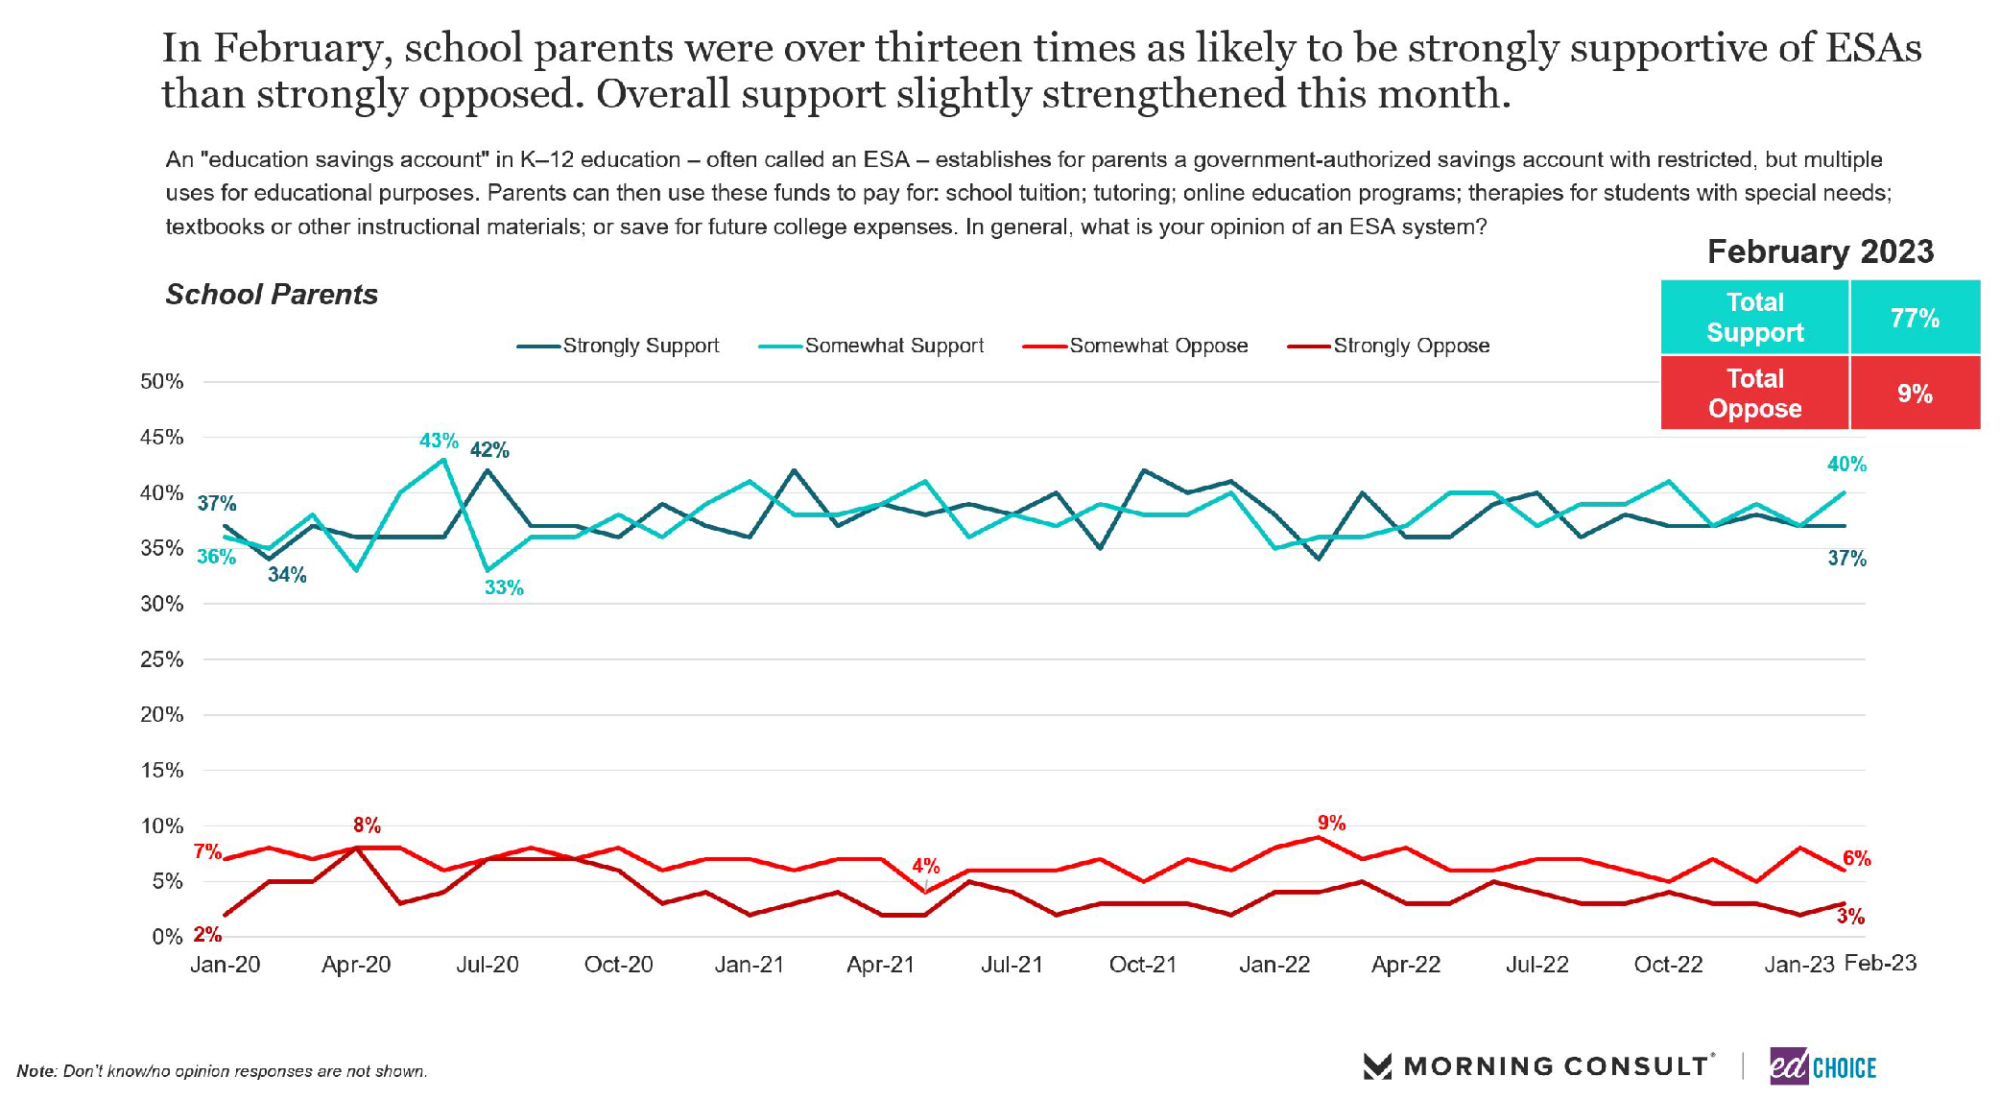
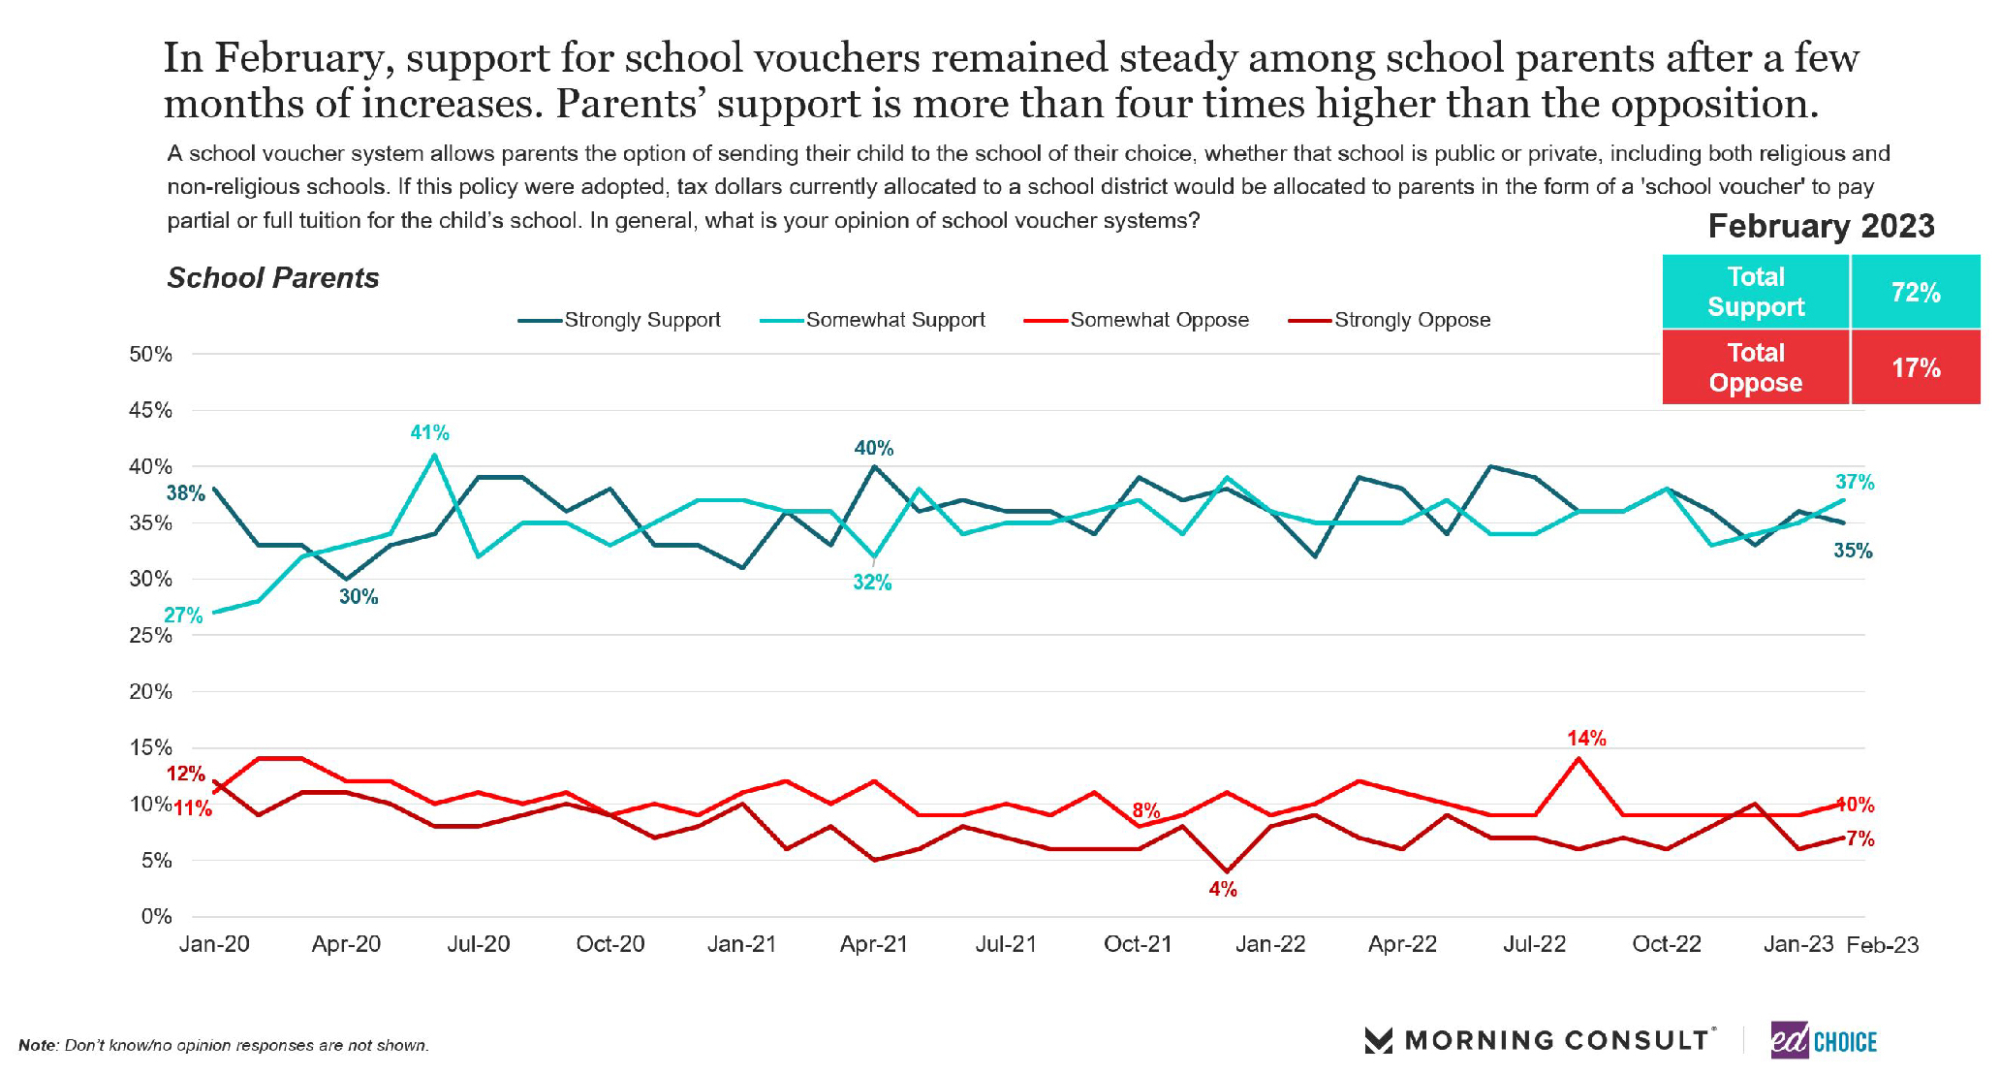
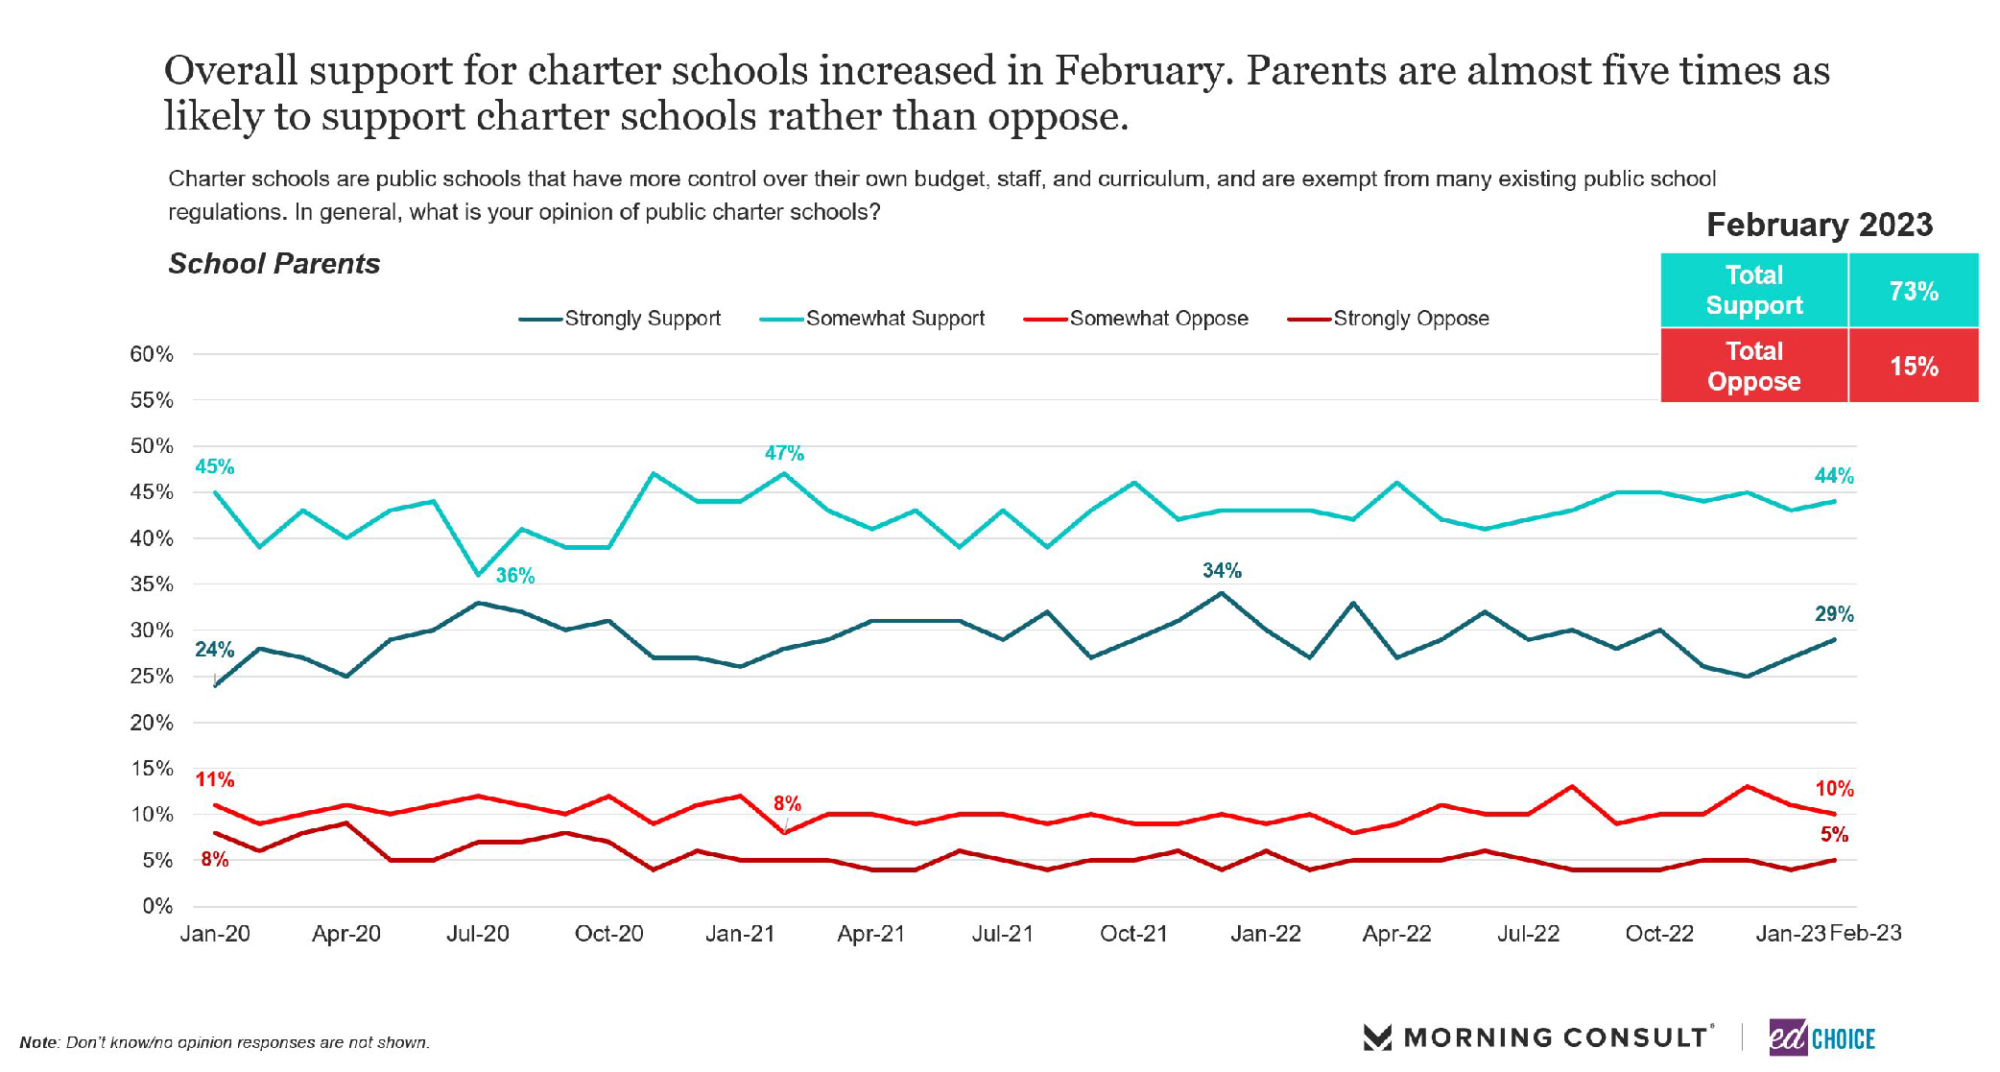
1. School choice support increased significantly in February. Each school choice policy – education savings accounts (ESAs), vouchers, charter schools, and open enrollment – experienced dramatic increases in support from both the general population and school parents. ESAs, in particular, continue to enjoy high levels of support along with very low levels of opposition. Less than one in ten Americans oppose ESAs, while roughly three in four Americans support the policy. School parents were even more supportive of ESAs in February compared to last month (74% to 77%), and the same is true for voucher support (71% to 72%) as well as for charter schools (70% to 73%).
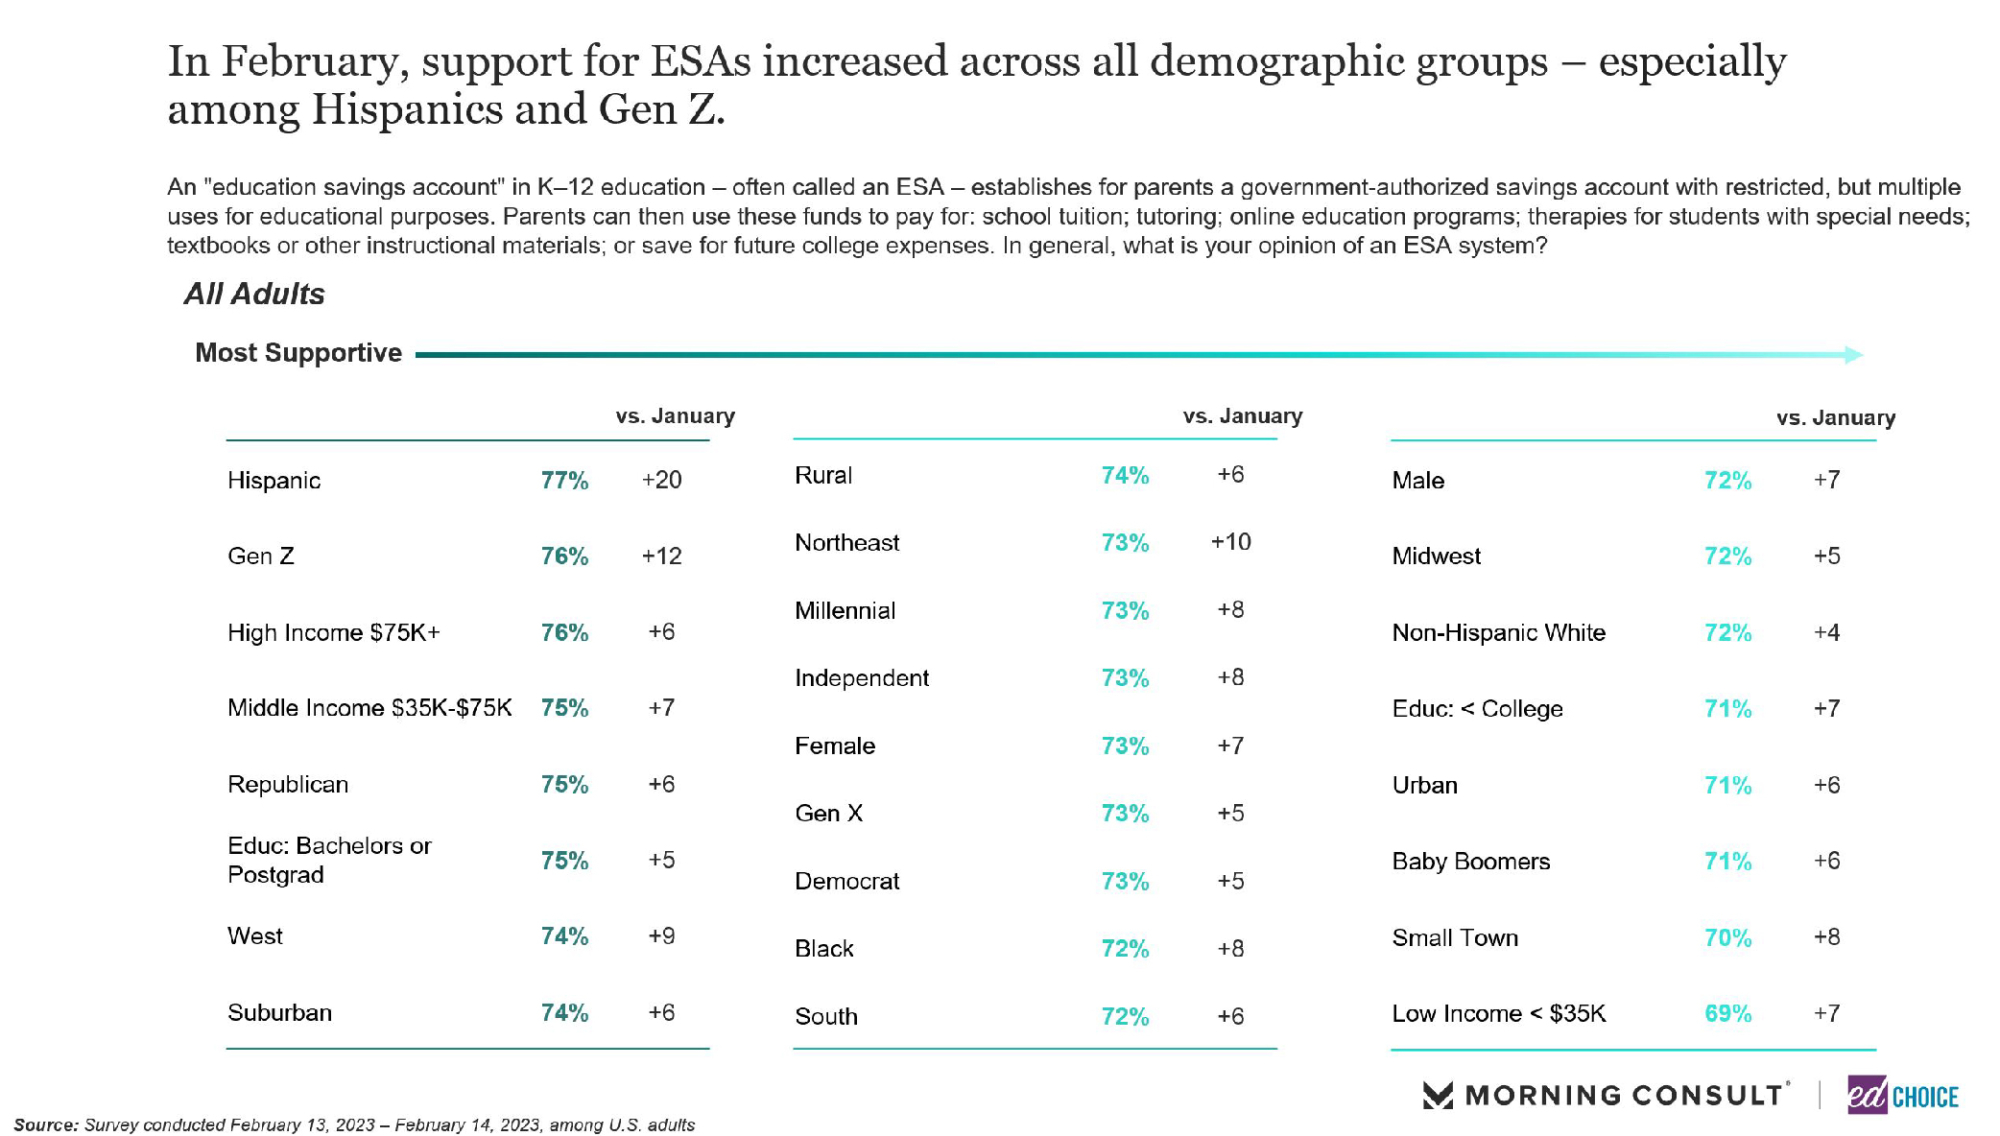
The demographic breakdown of each of the school choice questions revealed interesting findings as well. Hispanic and Gen Z respondents were two of the groups that had substantial increases in support for each of the choice policies. Another big takeaway for me was the increase of support for ESAs from respondents regardless of income level. Support for ESAs from high income earners increased 6 points in February (70% to 76%), increased 7 points among middle income earners (68% to 75%), and 7 points for low income earners (62% to 69%).
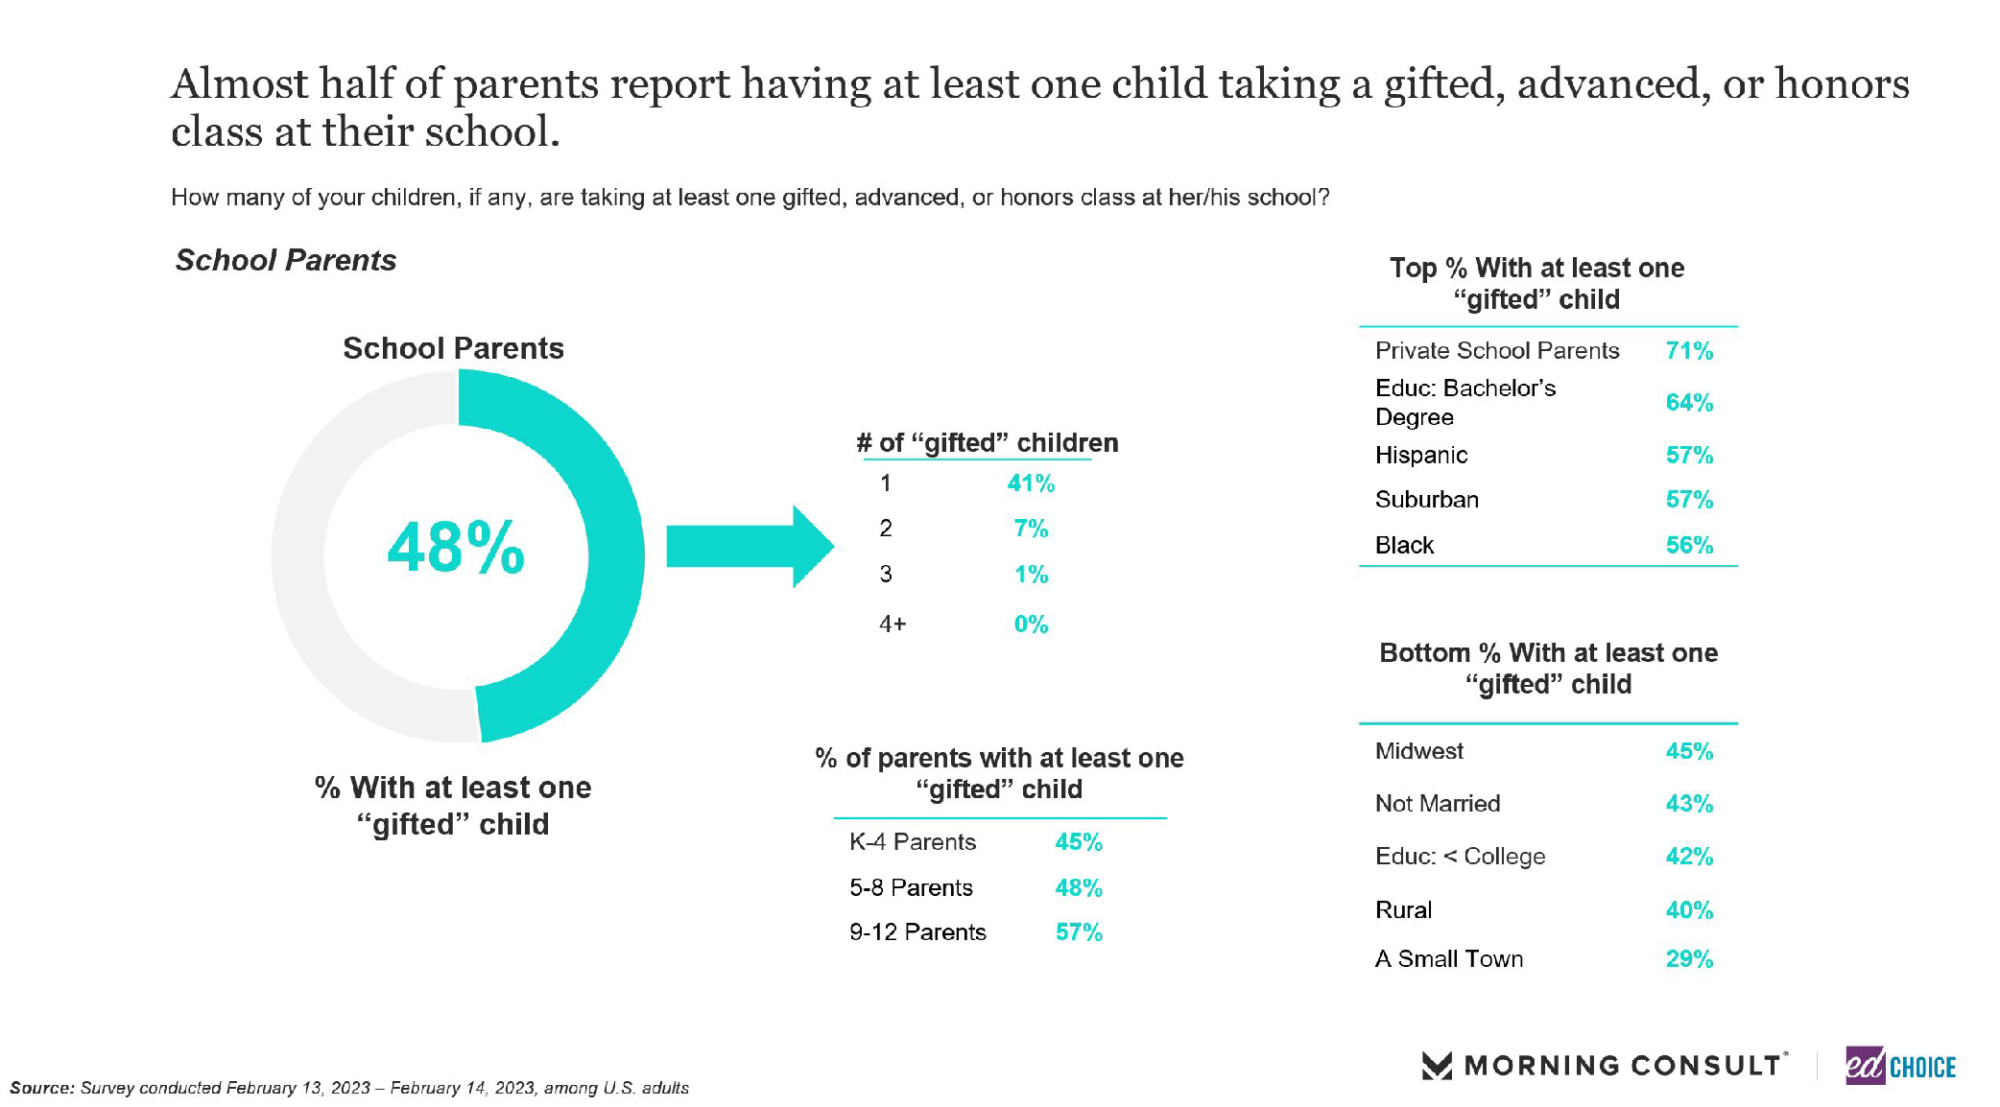
2. Nearly half of parents have at least one child taking a gifted, advanced or honors class. This question is the first in our polling to ask about honors type classes. Private school parents, parents with bachelor’s degrees, and Hispanic parents were the most likely to say their child is taking a gifted, advanced, or honors class. Split out by grade level, parents of high school students were the most likely to report their child taking these classes.
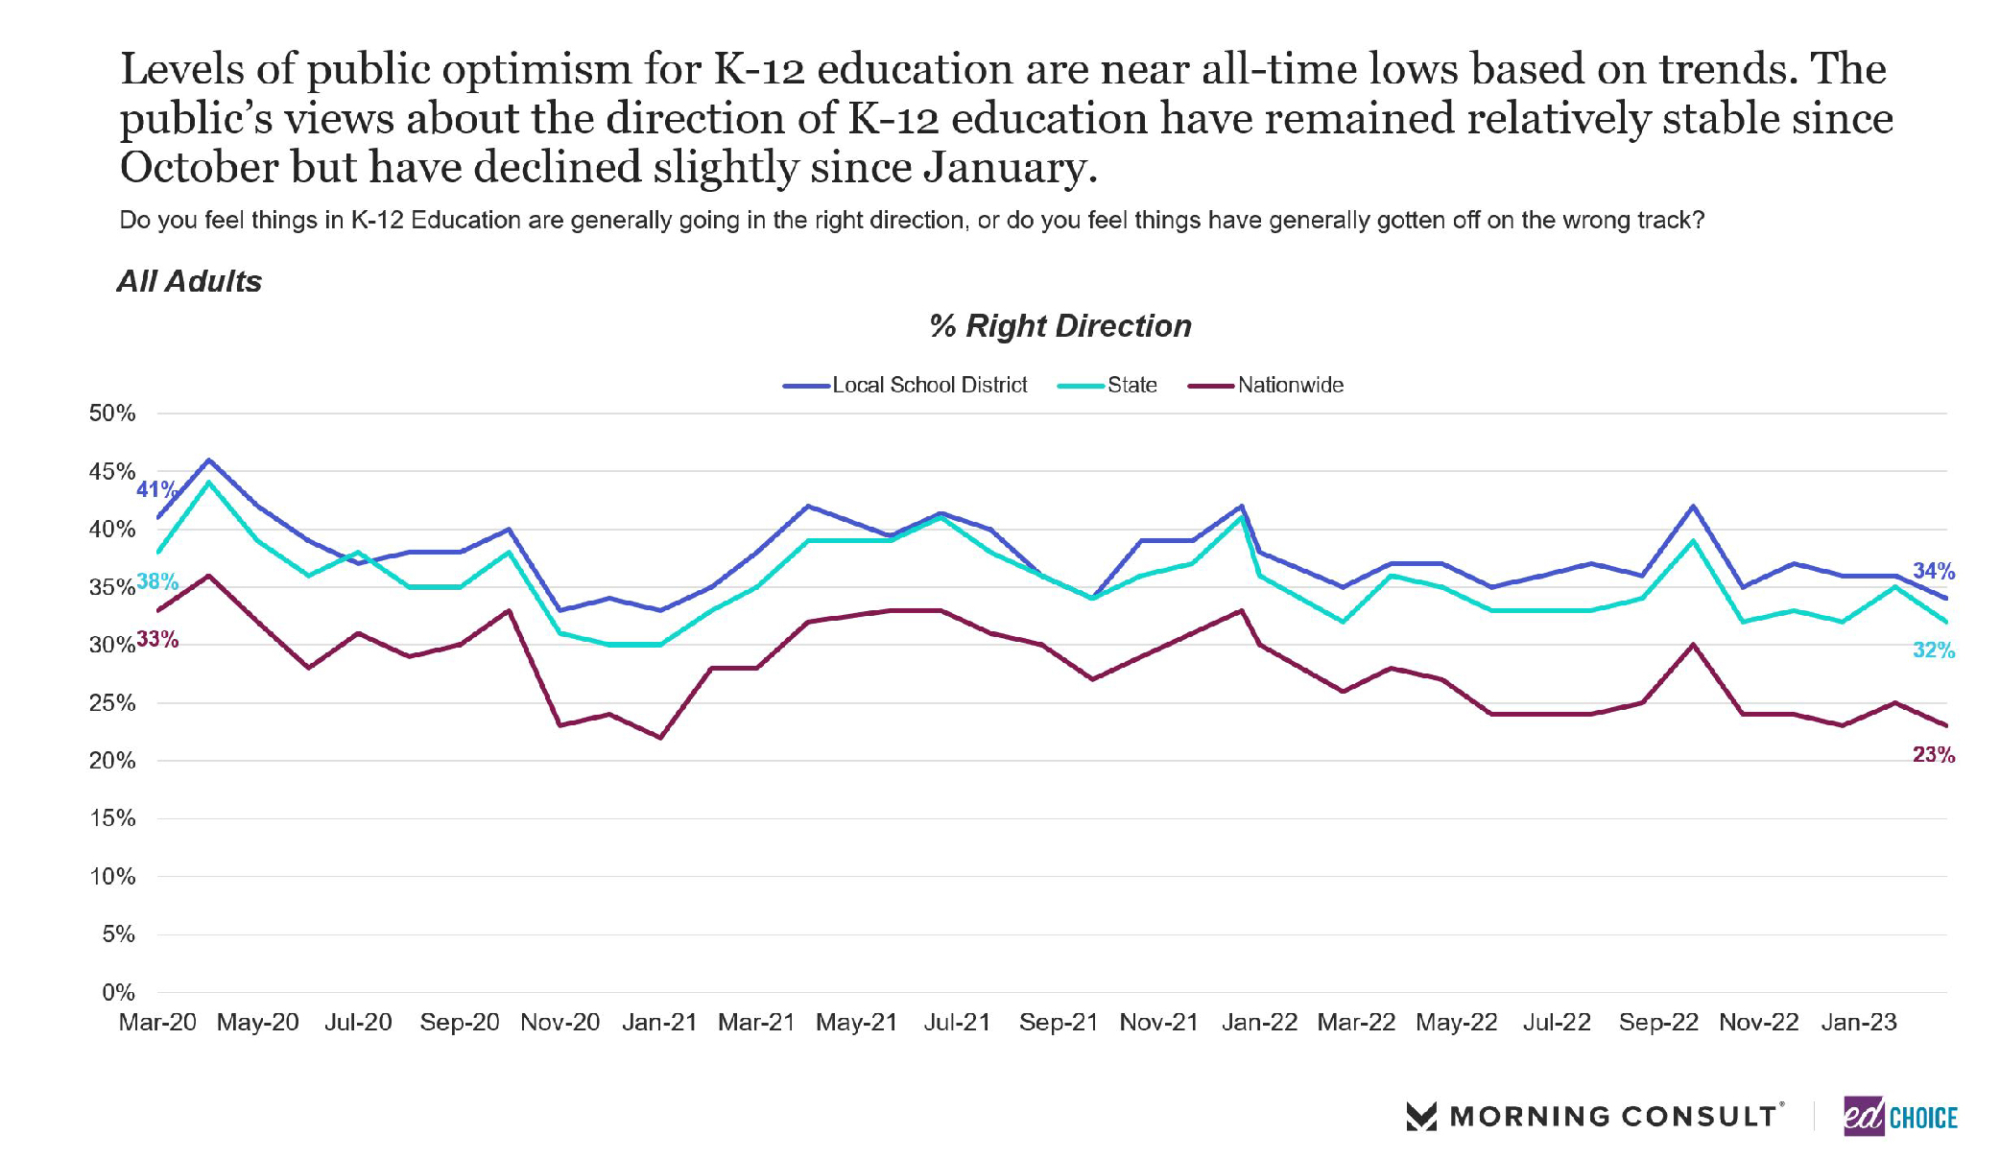
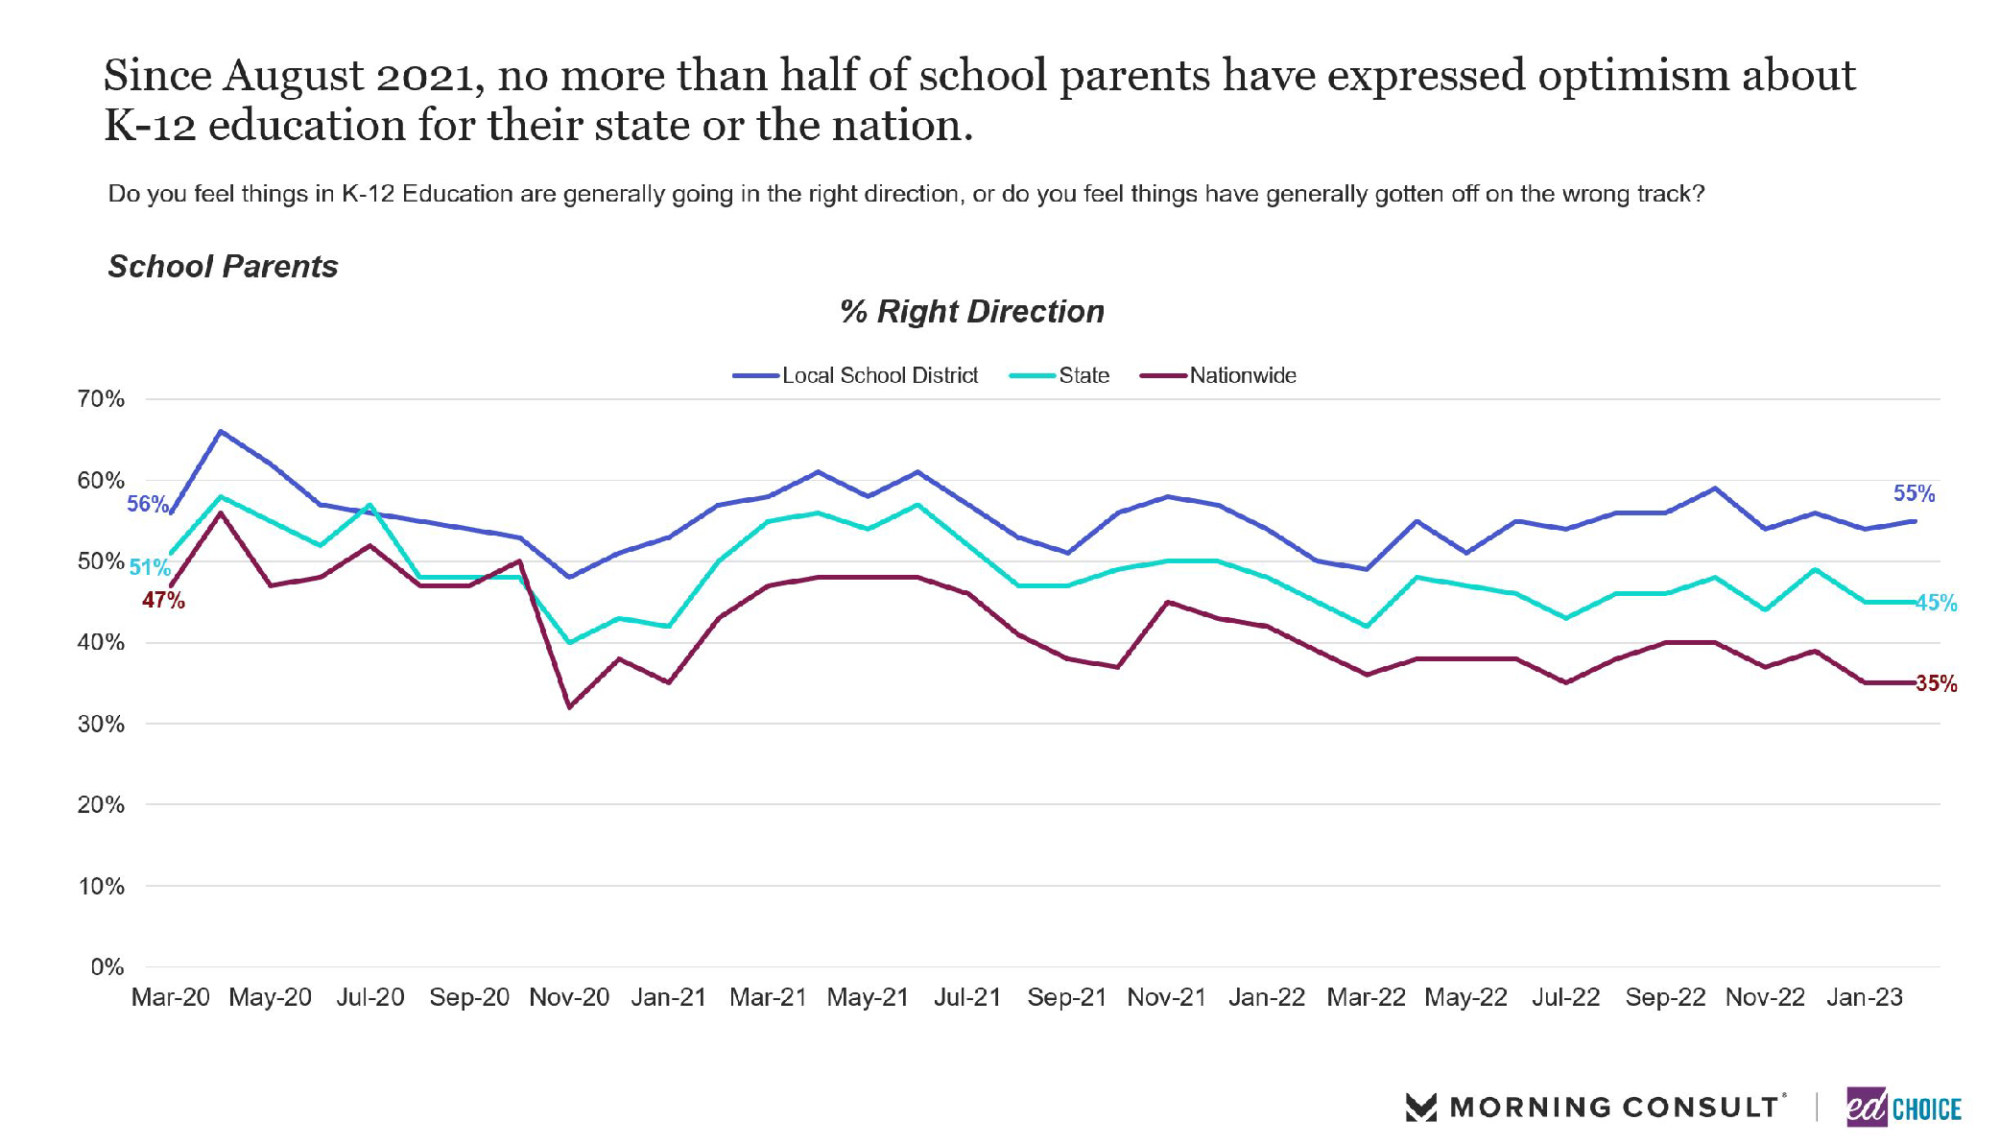
3. Americans’ confidence in the direction of K-12 education continued to fall in February. Slightly more than one in three Americans believe their local school district is heading in the right direction, one of the lowest levels we have observed since we began asking this question in March of 2020. Americans are even more pessimistic as the question broadens, as only 23 percent of Americans believe K-12 education nationwide is headed in the right direction. School parents are consistently more optimistic about the direction of K-12 education than the general public, and this remained true in February.
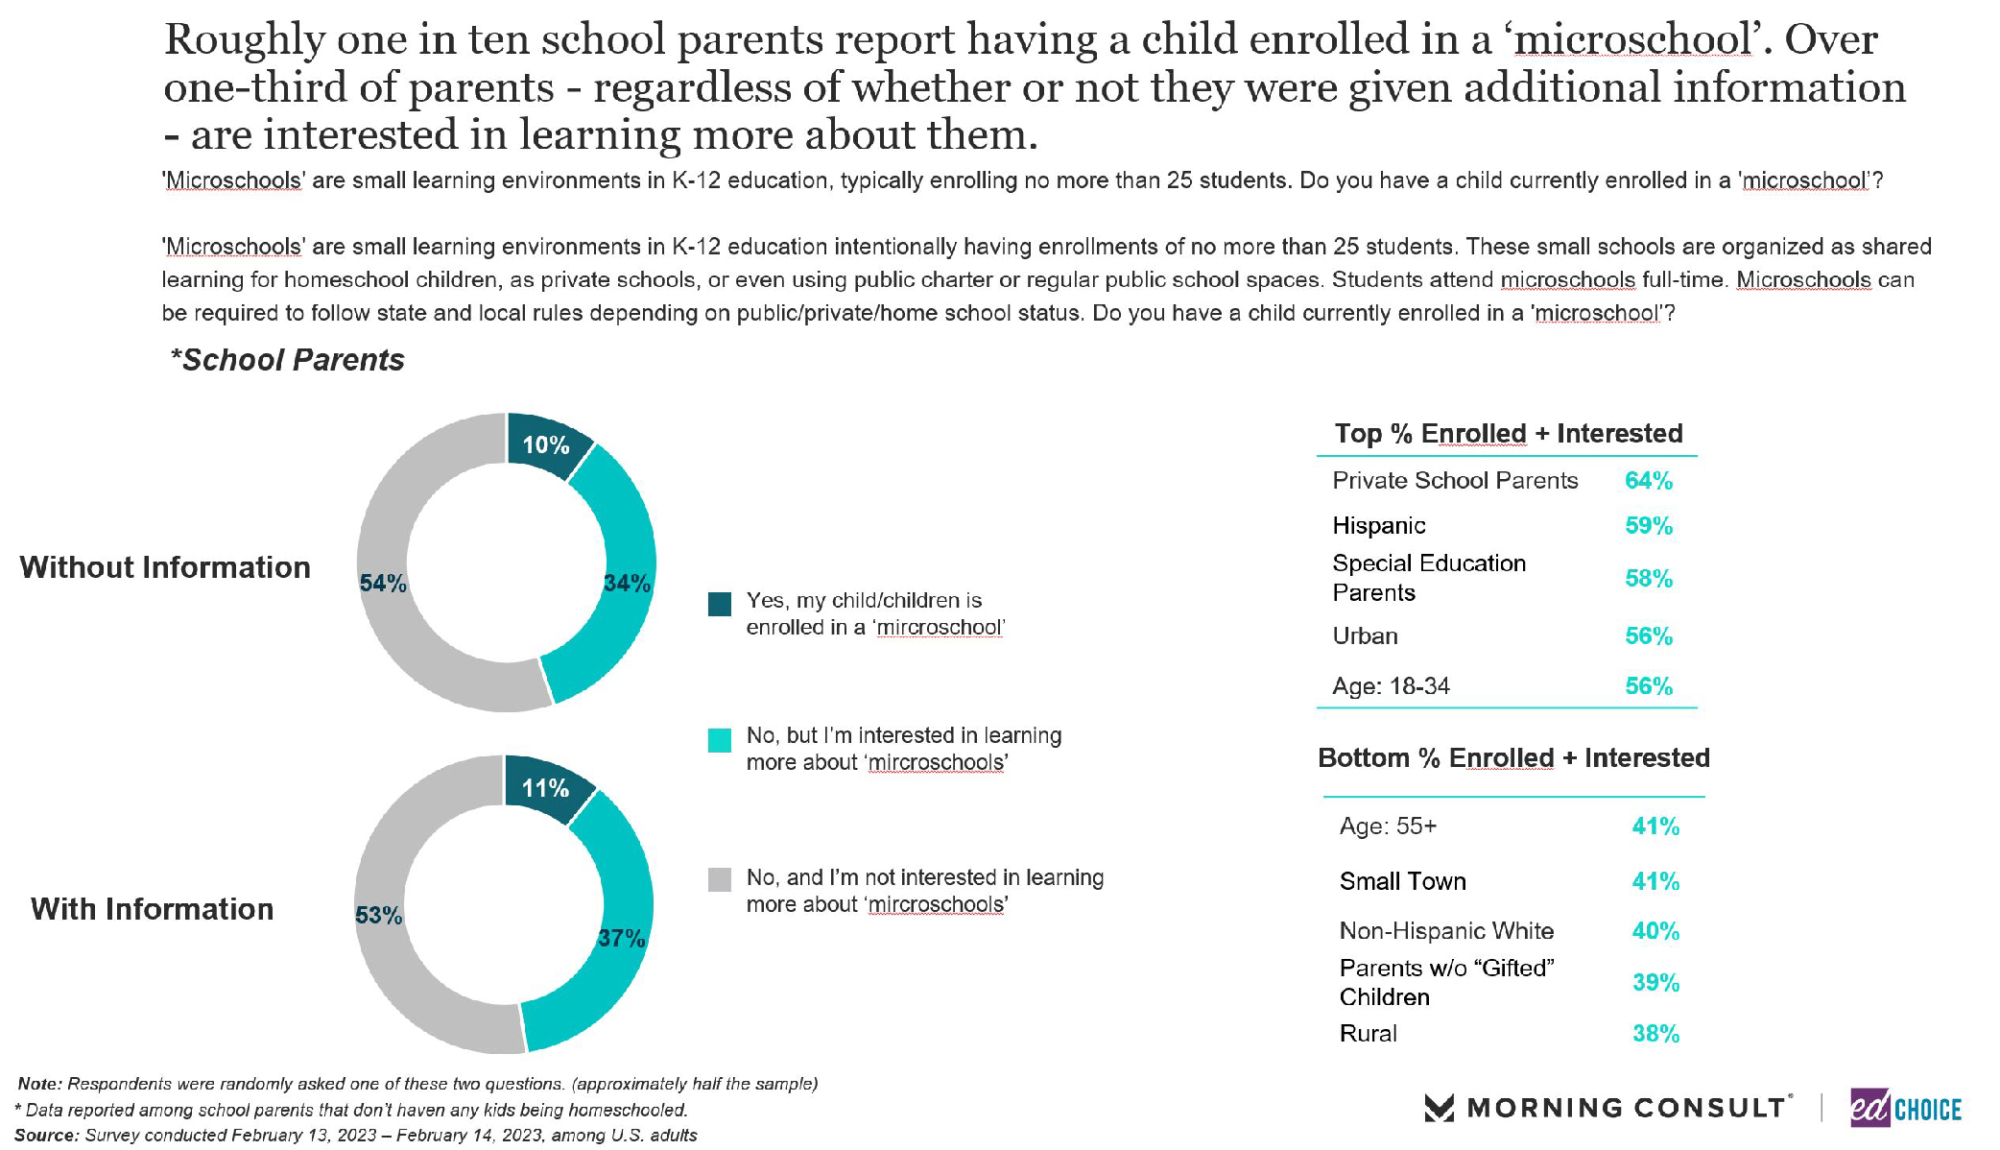
4. Roughly one in ten parents report their child is enrolled in a microschool. Last month, for the first time, we asked parents if their children attended a microschool. We used a split-sample to test different wording of the question but the result was the same each way, eight percent of parents said their children were enrolled in a microschool. That number seemed high to us, and might capture students who were attending some kind of small learning environment to supplement their full-time schooling. This month we adjusted the question to emphasize that we wanted to know if students were enrolled full time in a microschool. With the new question wording, the number of parents reporting their child being enrolled in a microschool actually increased, to 11%. Again, we were surprised by the number, and remain cautious at this point in making any concrete claims about microschool enrollment, but the results are interesting, nonetheless. Given this finding, and responses from parents that suggest high curiosity of microschools, we’ll be exploring this in greater detail in future write ups.
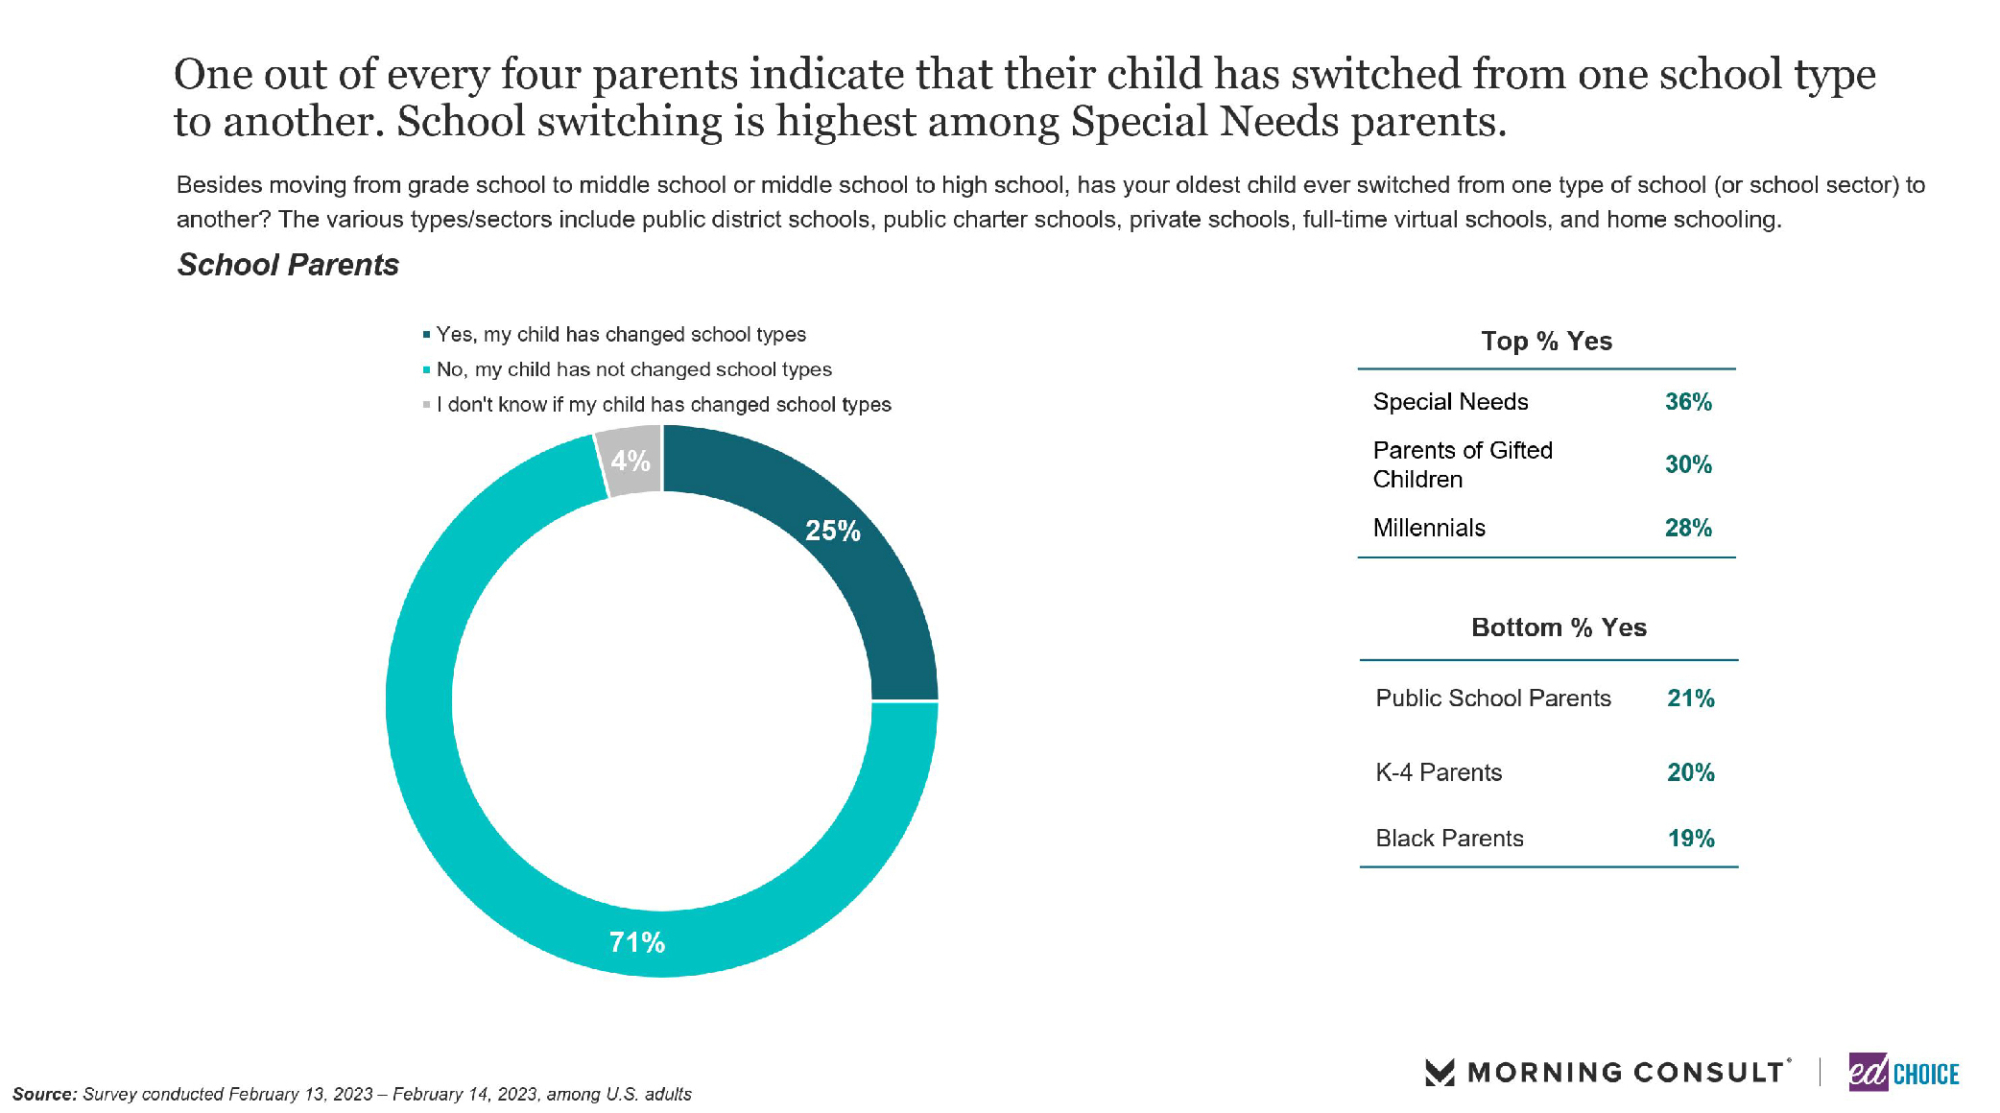
5. One in four parents report their child switching schools. We posed this question to parents, “Besides moving from grade school to middle school or middle school to high school, has your oldest child ever switched from one type of school (or school sector) to another?” Parents of children with special needs, parents of gifted children, and millennial parents were the most likely to report their child has switched schools at some point in their academic careers.
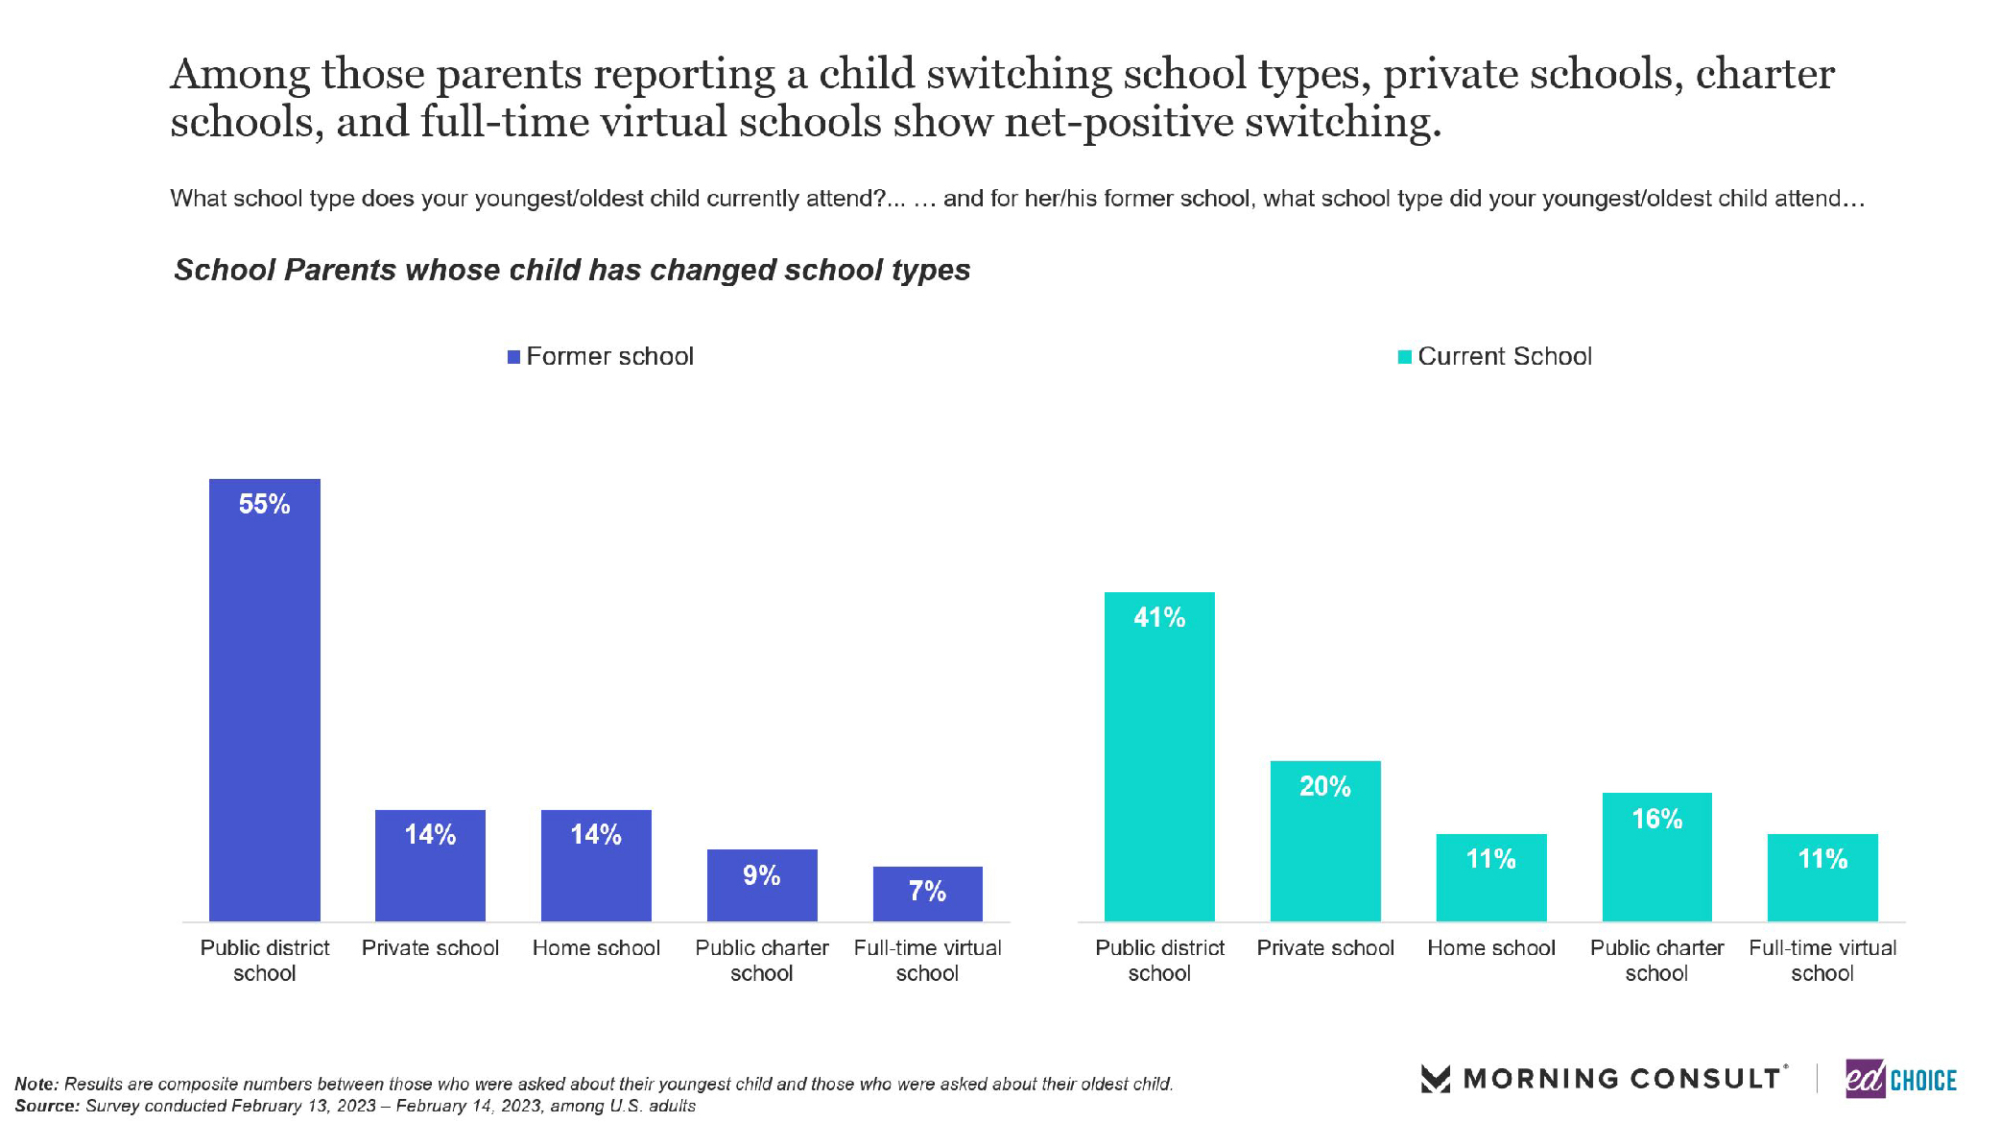
Included in this question is data on which type of schools children left compared to which schools children entered in to. Public schools and home schools were the two school types children left more often than they entered. On the other hand, public charter schools, private schools, and full-time virtual schools experienced increases in enrollment as these children looked for a new type of school.
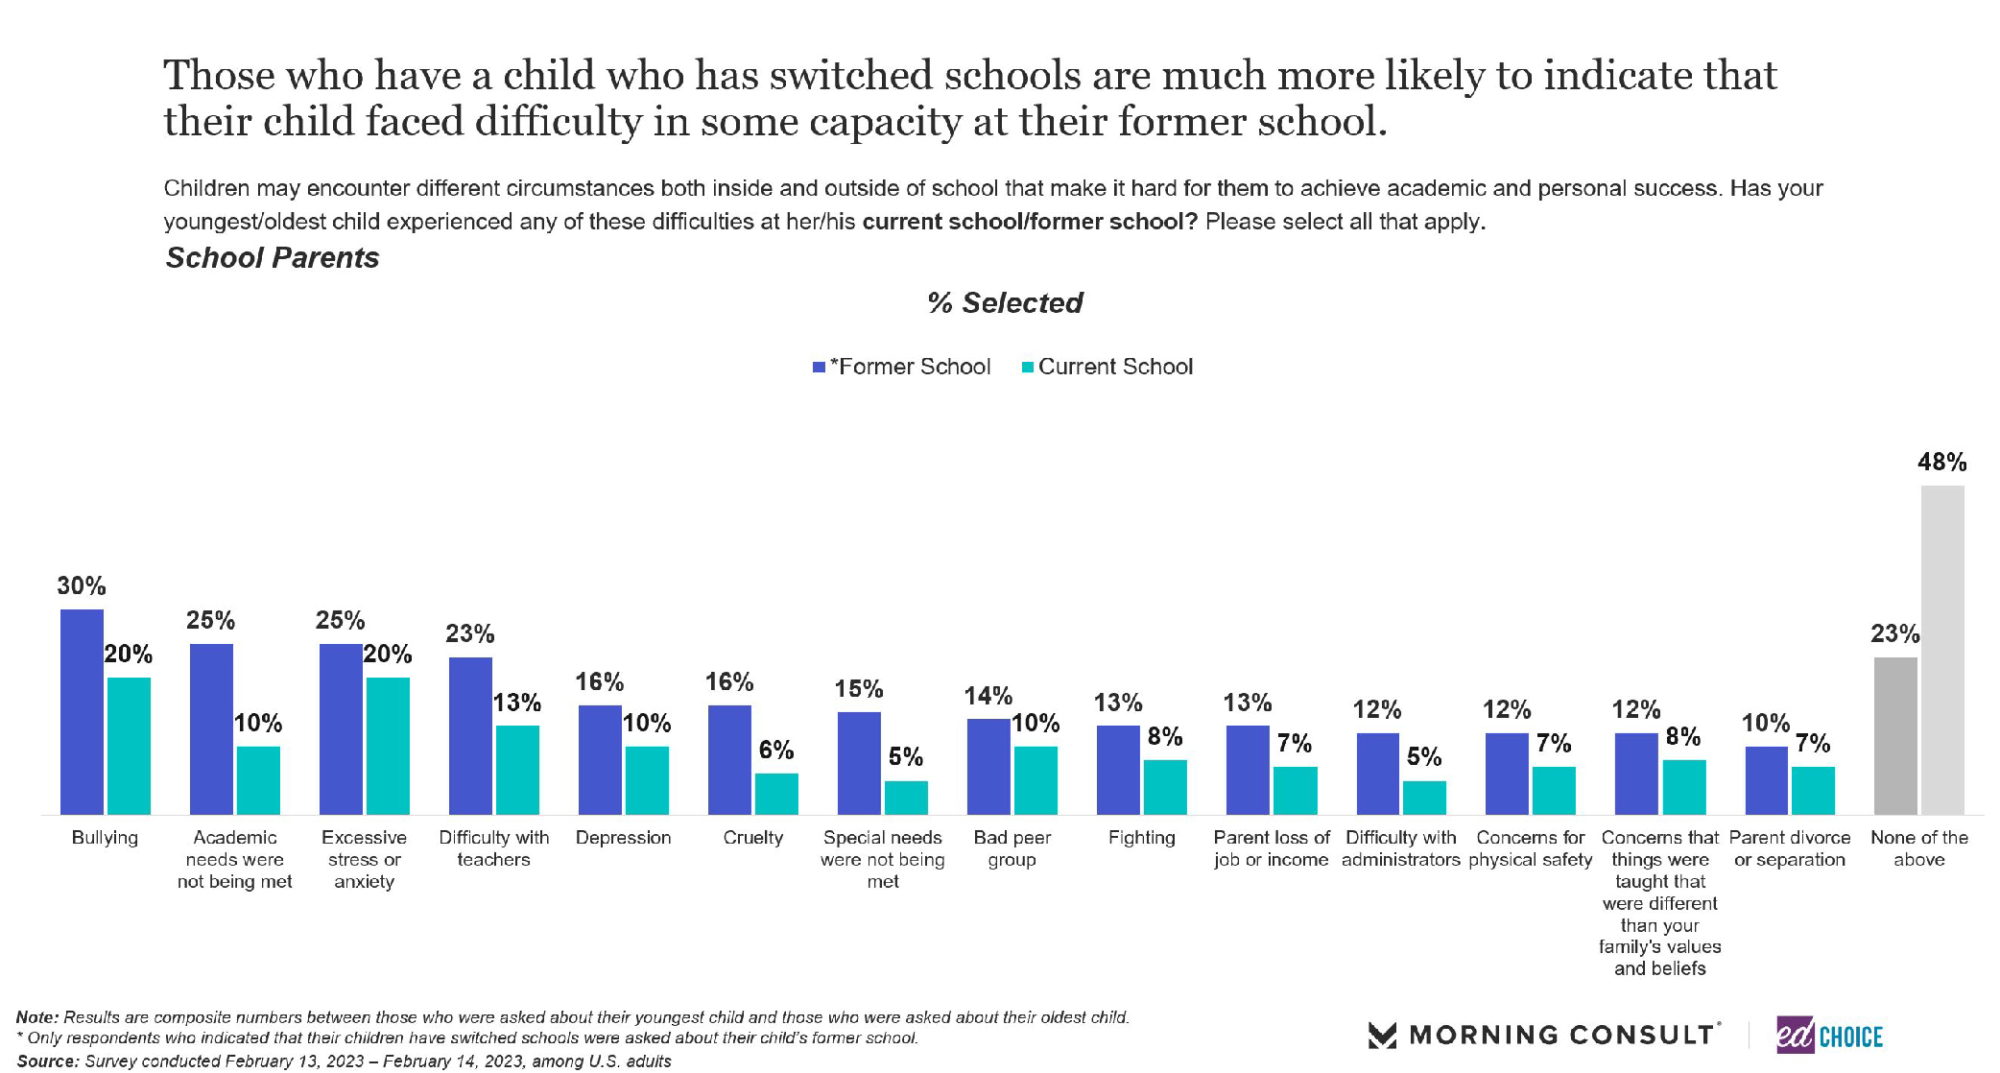
Parents reported the biggest factors hindering children in their previous schools were bullying, academic needs not being met, and excessive stress or anxiety. For each of these obstacles, parents reported their child encountering these issues less frequently in their new school type.
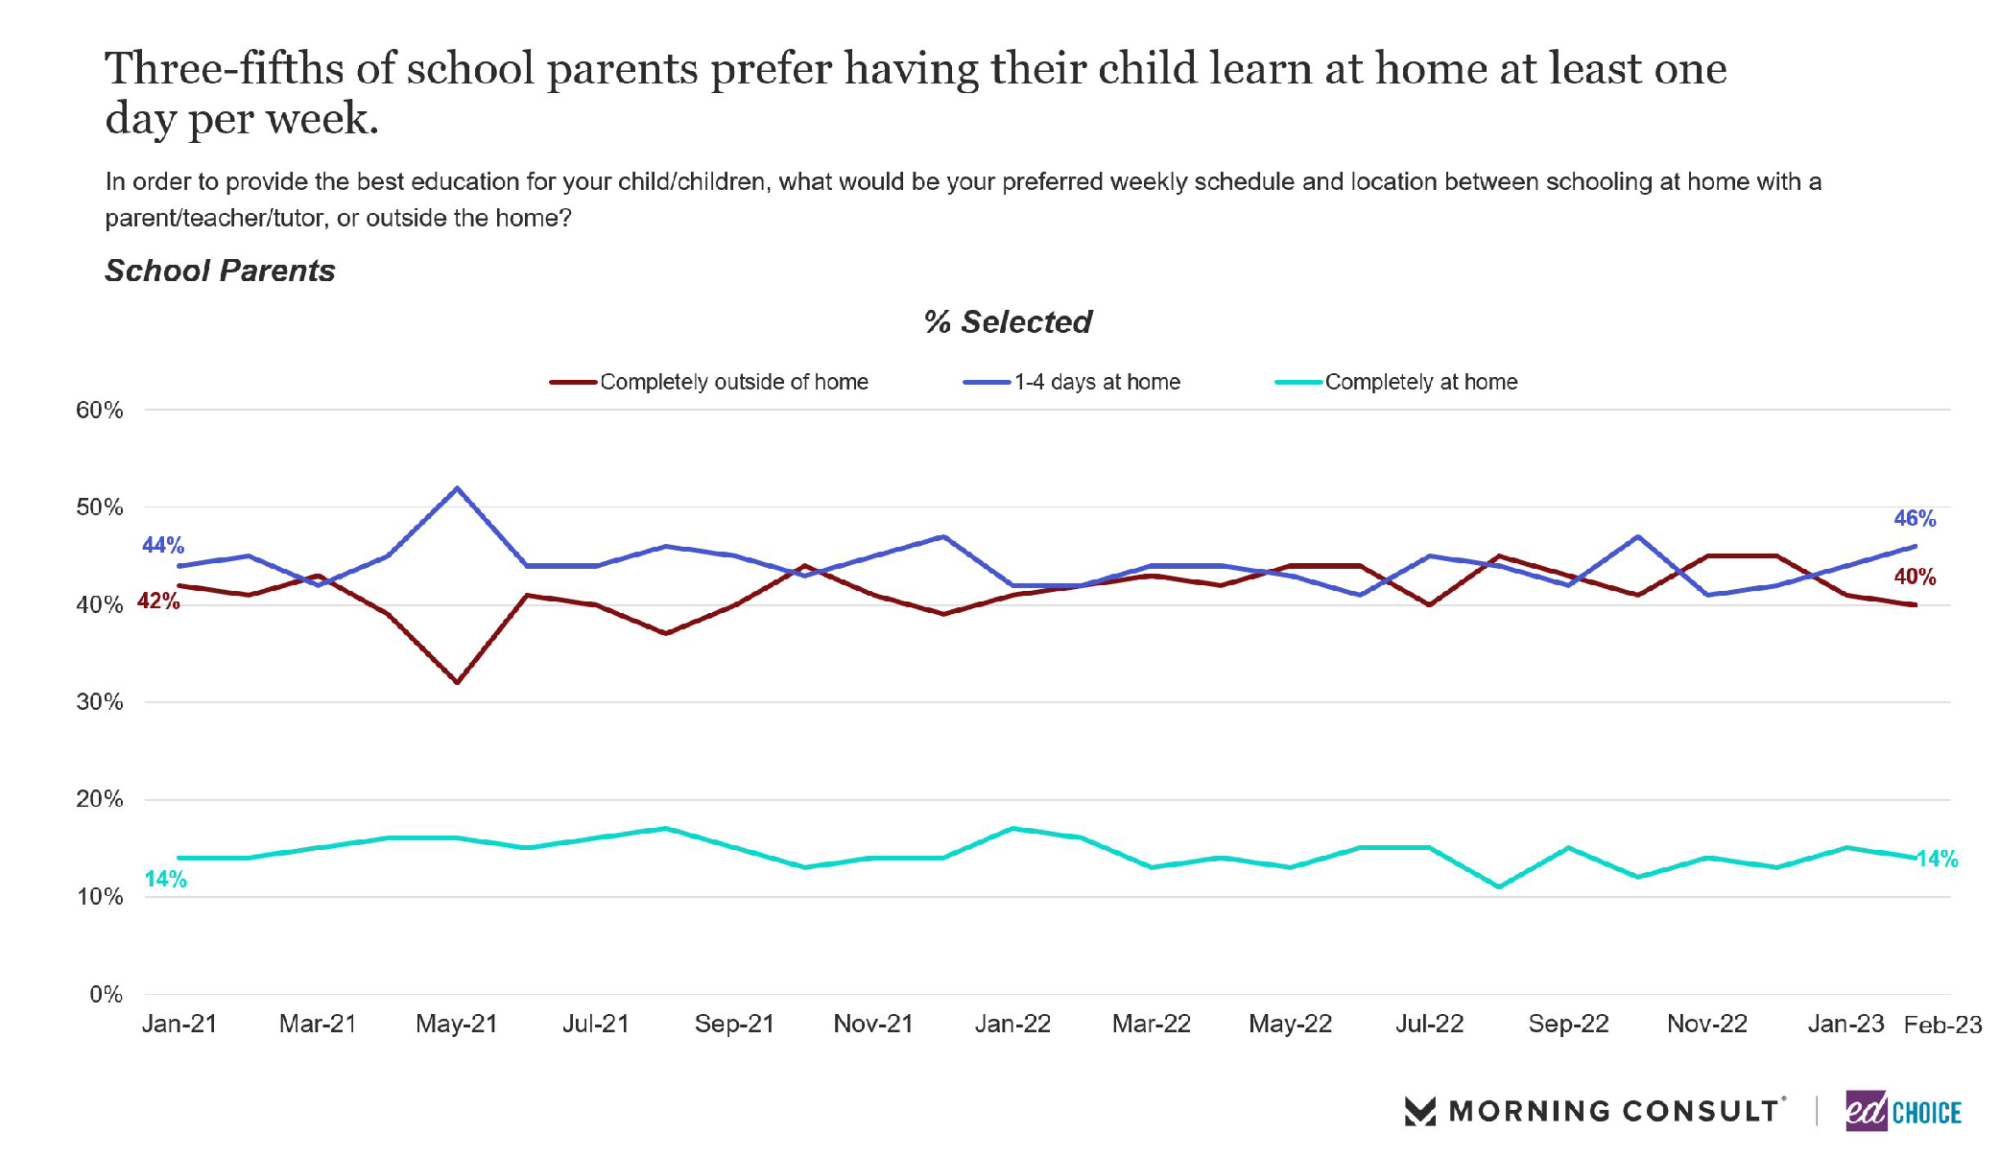
6. In February, parents continued to express desire to have their child learn from home at least once per week. Slightly less than half of parents (46%) prefer to have their child learn from home at least one day a week. Four in ten parents prefer their child’s schooling to be exclusively at school, while only 14 percent of parents would prefer their child to be taught only at home. Parents’ favorability towards a hybrid schooling schedule for their child is getting closer to peak levels seen in the springtime of 2021. Interestingly, the proportion of parents wanting their child to learn only at school has dropped to the lowest we’ve observed in more than a year.
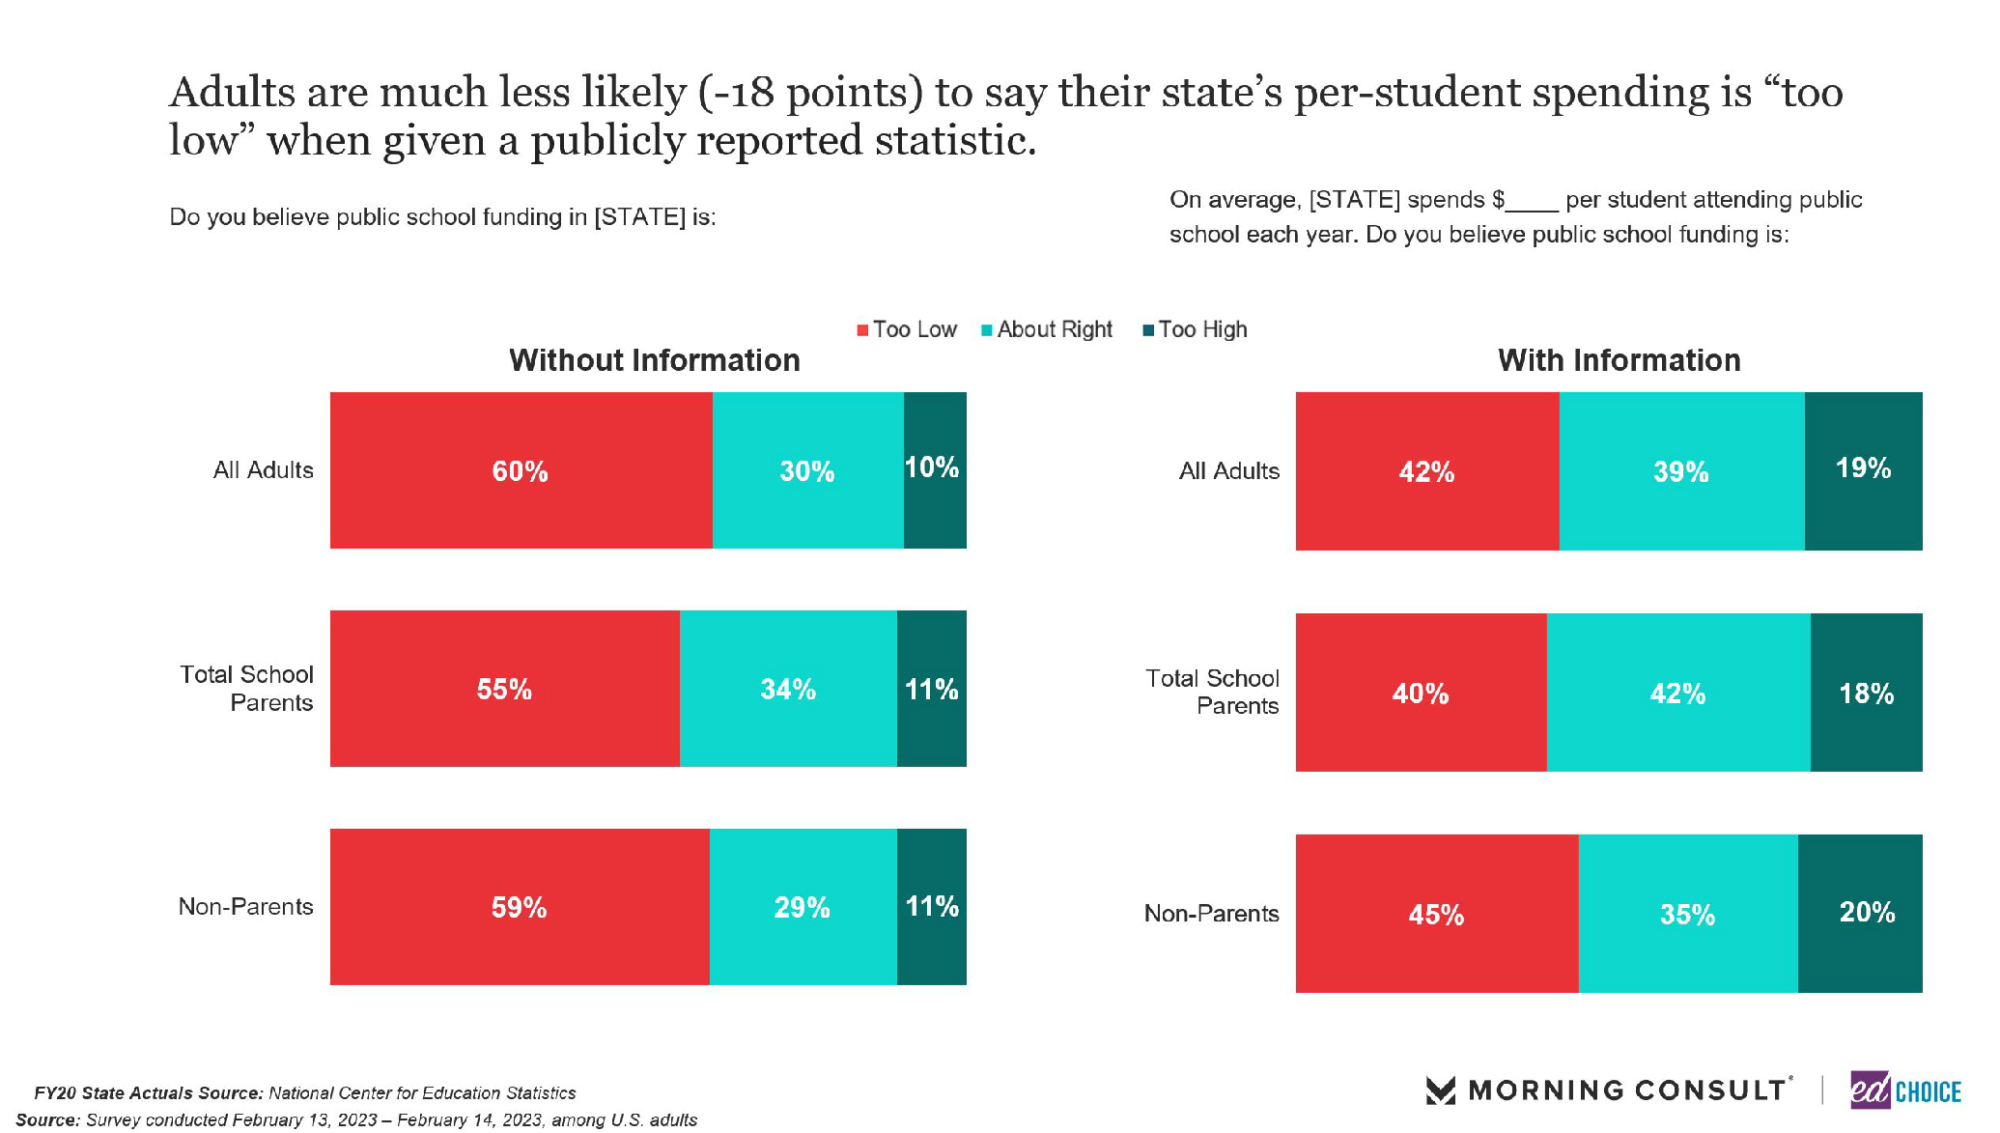
7. More than 40 percent of Americans believe their state’s per pupil spending is too low when shown data on the subject. Without being shown any funding data, 60 percent of Americans believe per pupil spending in their state is too low. These are the highest level we have seen since spring of 2020. As for Americans who believe the funding in their state is too high, the proportion nearly doubles (10% to 19%) when shown public funding data.
Visit the EdChoice Public Opinion Tracker site to access past reports, crosstabs, and questionnaires. We update our national and state dashboards every month. We also provide a more in-depth description of our research and survey methods.
Our K–12 education polls archive is updated on a rolling basis, roughly a few times each month. Please don’t hesitate to let us know if we are missing any surveys, or if there are accidental errors.