EdChoice Public Opinion Tracker: Top Takeaways February 2022
By mid-February 2022, COVID-19 case rates were plummeting toward pre-Omicron variant levels, and governments across the country started lifting mask mandates and other pandemic-related restrictions. Because COVID-19 has impacted families’ educational experiences dramatically, people’s perceptions of American K-12 education may shift as the pandemic intensifies and wanes. EdChoice’s monthly opinion tracker, conducted with Morning Consult, attempts to capture some of these trends.
The February wave of our monthly opinion tracker was in the field February 12-15, 2022 (n = 2,200, including 1,092 parents of school-age children with an oversample of 700 school parents), which allowed Americans more time to experience Omicron’s effects.
This blog post highlights some of the ways COVID-19 is affecting Americans’—and especially parents’—perceptions of K–12 education.
Before we get into the key findings, you can visit this page on the newly-improved EdChoice Public Opinion Tracker site to access past polling reports and briefs as well as demographic crosstabs and questionnaires. We also provide a more in-depth description of our methodology. Over the past two years, we have been cataloging education-related polls and surveys during the pandemic. Our K–12 Education Polls Archive is updated on a rolling basis, roughly a few times each month. Please don’t hesitate to let us know if we are missing any surveys, or if there are accidental errors.
Here are six key findings in our latest wave.
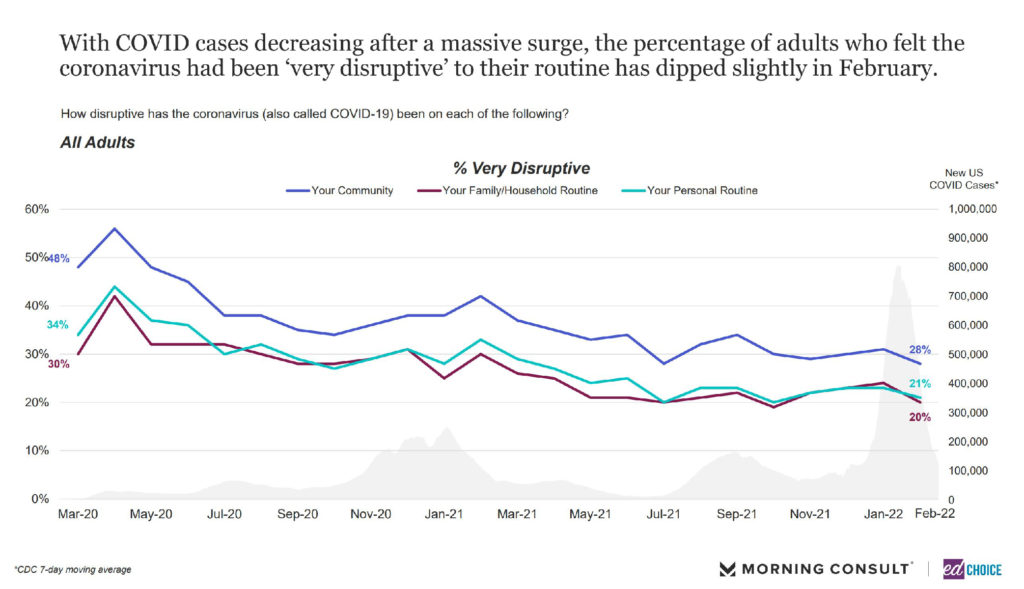
1. COVID-19 apprehension appears to have returned to pre-Omicron levels. Much like the Omicron variant itself, pessimistic tendencies skyrocketed during January but reverted back to “normal” in February. In fact, the share of respondents who said the pandemic was “very disruptive” to their communities were as low as we’ve seen in our monthly tracker (28%). About a fifth of Americans feel COVID-19 is currently very disruptive to their personal or household routines (21% and 20%, respectively).
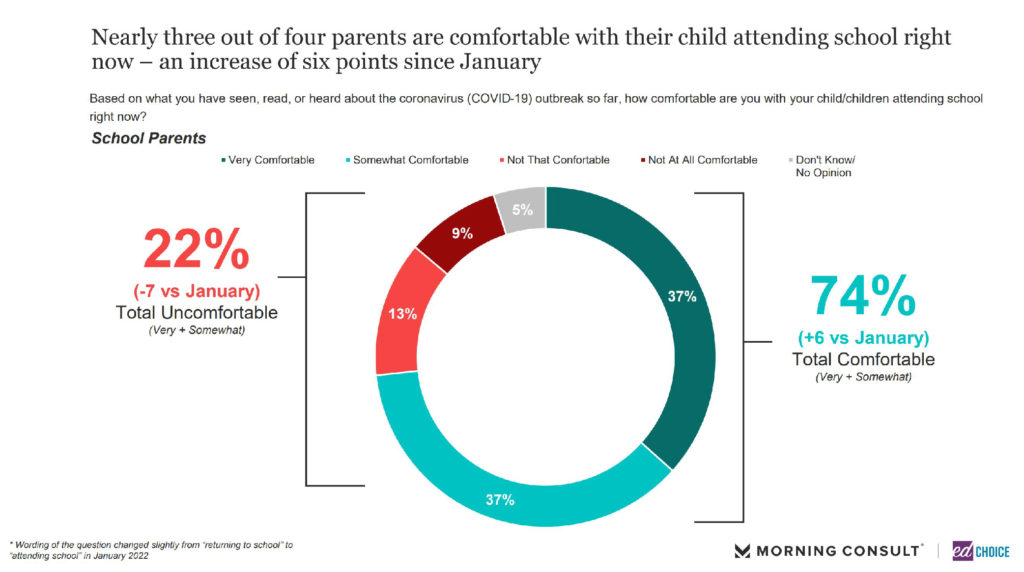
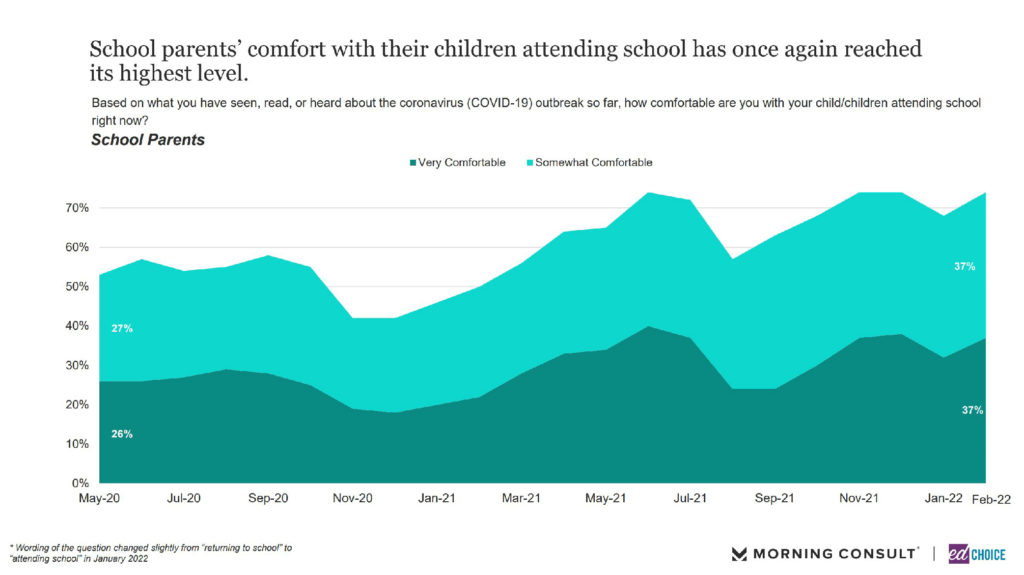
After a dramatic decline in January, the share of parents who say they are comfortable with their children attending school in physical classrooms rose to 74 percent in February, a jump of six percentage points. This ratio is as high as comfort levels have been since we began asking the question.
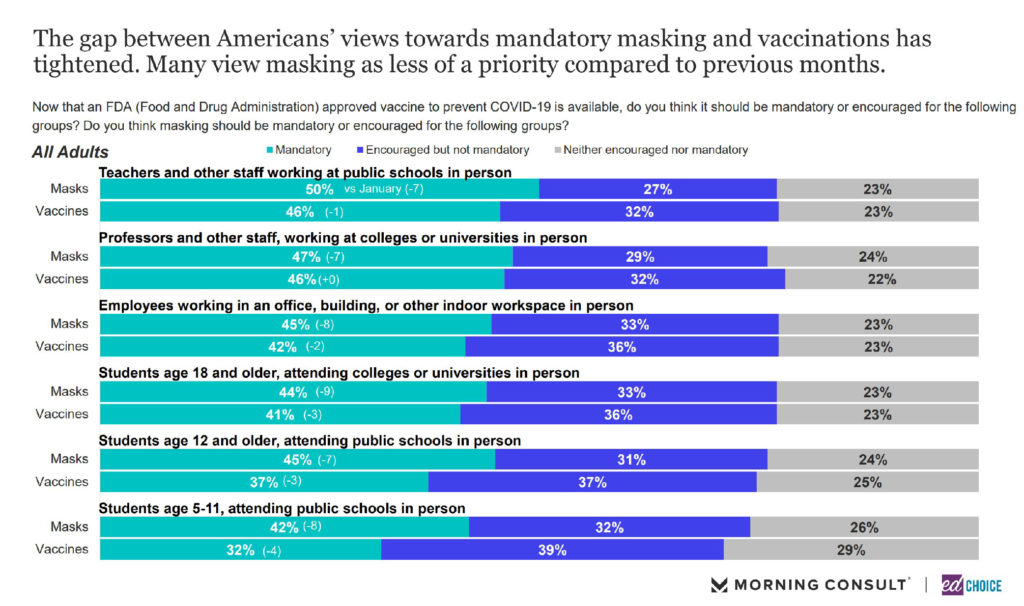
Perhaps another signal that people are more comfortable with COVID-19 than they were last month is a declined interest in masking mandates. Depending on the group and setting presented, respondents who believe there should be mandatory mask mandates declined seven to nine percentage points in February. This drop is more substantial than the rise we saw during the Omicron surge, and across for each group and setting, support for mask mandates is the lowest it has been since we began asking this question in the fall. While there was a decline in favor for vaccine mandates, the change was much less significant than that of mask mandates.
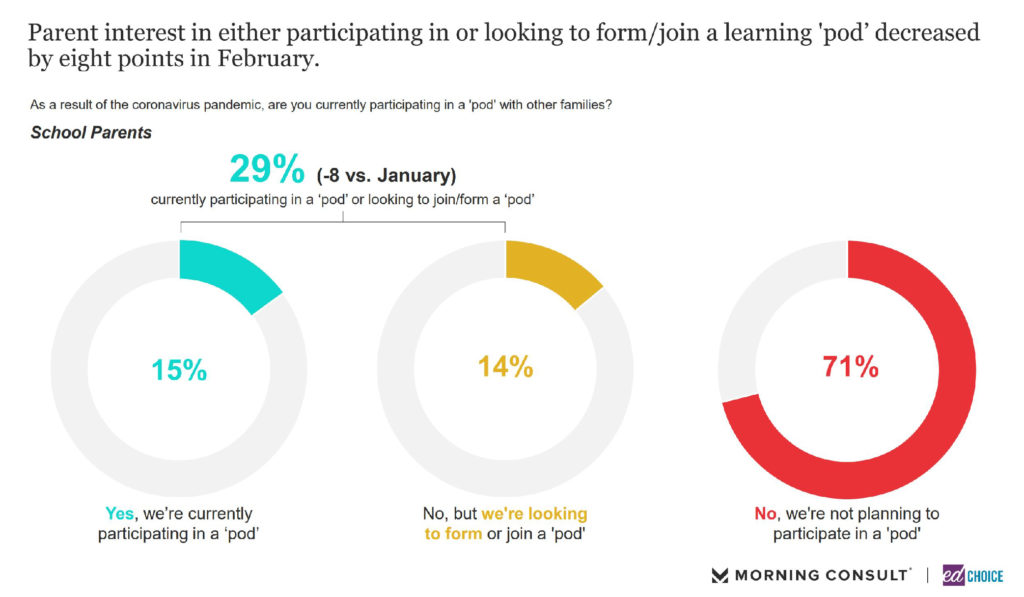
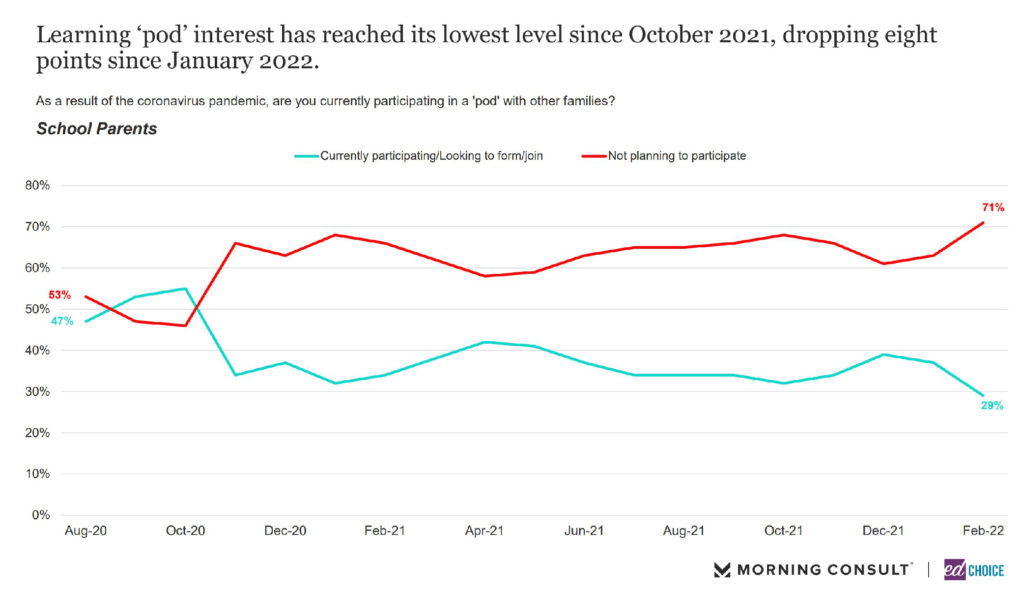
2. Interest in some forms of out-of-school education declined in February. Since January, at least a third of parents indicated they either were participating in or interested in participating in learning pods. This number rose three consecutive months from October to December, when 39 percent of parents said they were at least looking to join a learning pod. In February, that number dropped to 29 percent, which is the lowest number our tracker has seen since we began asking parents about learning pods. Notably, this decline is almost entirely concentrated among parents interested in but not currently participating in pods. In other words, there were essentially no fewer parents participating in learning pods in February compared to January.
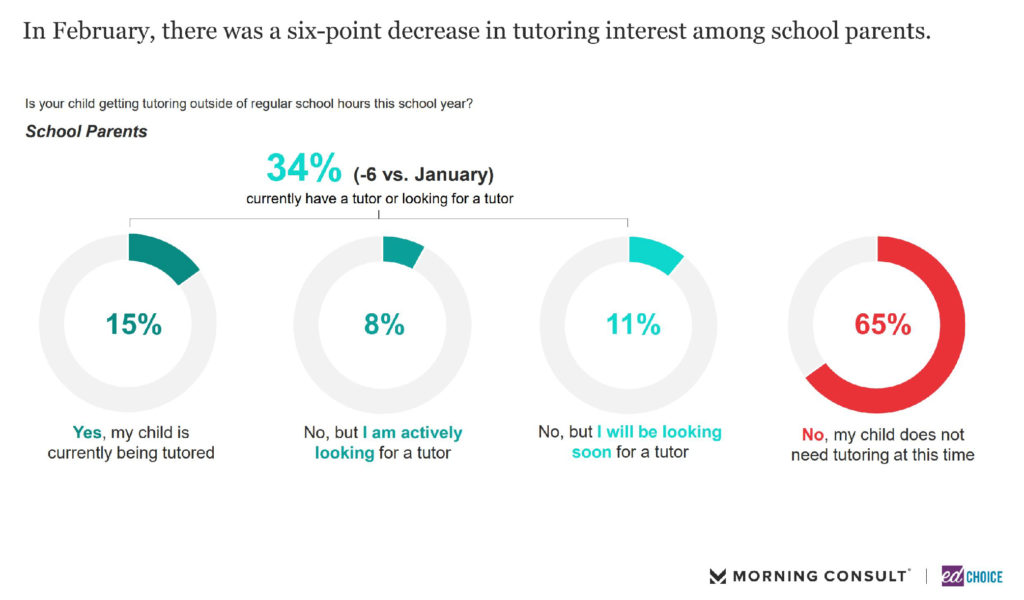
Similarly, more parents indicated that they are not participating in or interested in tutoring for their children in February.
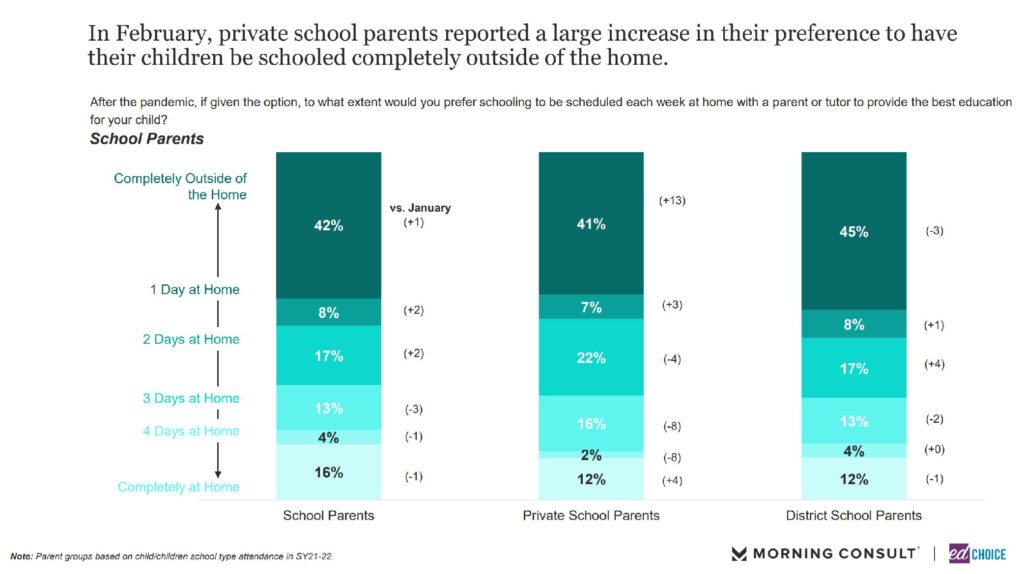
The ideal schooling location preferences among certain parents also appear to have changed from January. Consistently, a majority of parents indicate their ideal school week would involve at least one day of schooling occurring at home. Private school parents have been particularly likely to prefer some schooling to occur at home—in January, 72 percent of private school parents said they wanted their children’s schooling to involve at least one day each week at home. In February, however, that number dropped thirteen percentage points to 59 percent. That said, the share of private school parents who preferred all schooling to occur at home increased by four percentage points, and the main shift is attributable to fewer parents preferring some mix of at-home and at-school instruction.
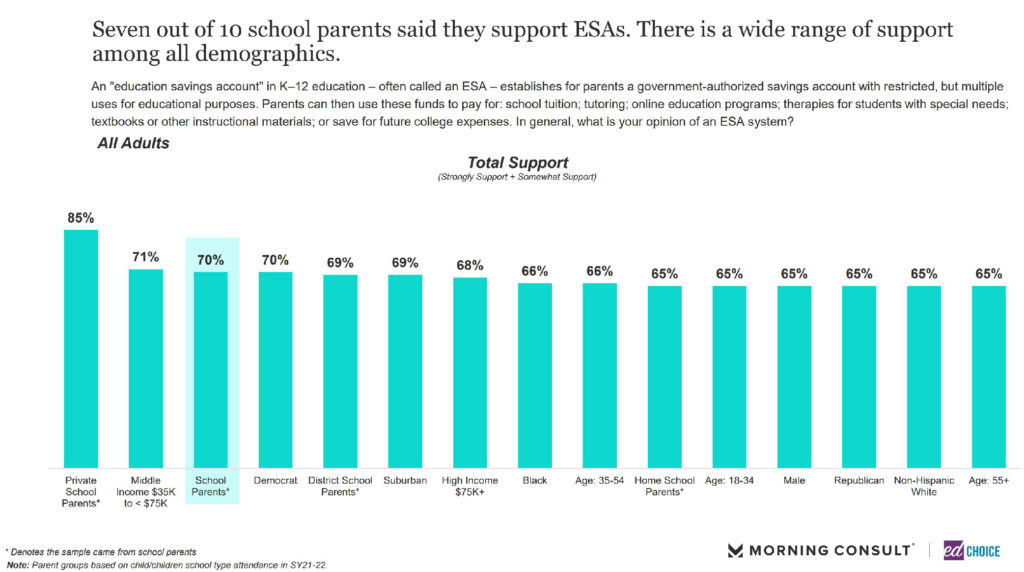
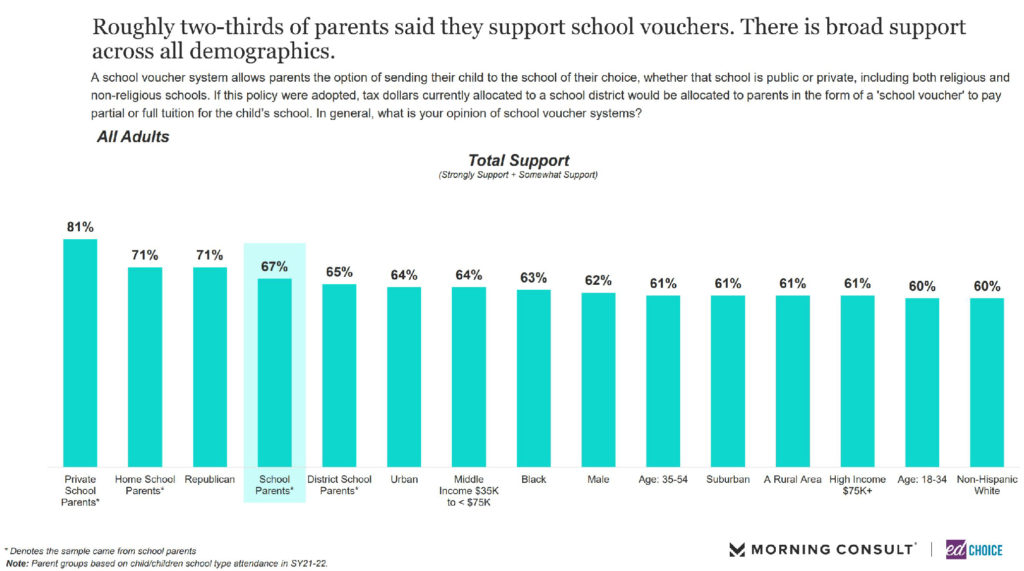
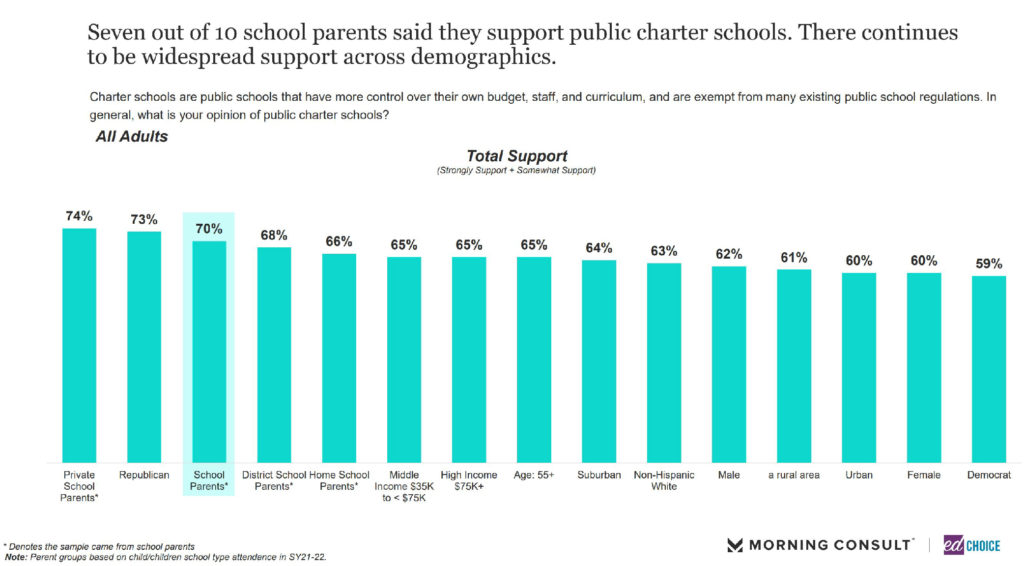
3. Private school choice policies receive strong majority support, though support is weaker this month than in previous months. As has been the case throughout our polling experience, most Americans indicated support for education savings accounts (ESAs), school vouchers, and charter schools. Among both parents and the general population, ESAs emerged as a clear favorite of the three private school choice policies, and charter schools just edged school vouchers in popularity.
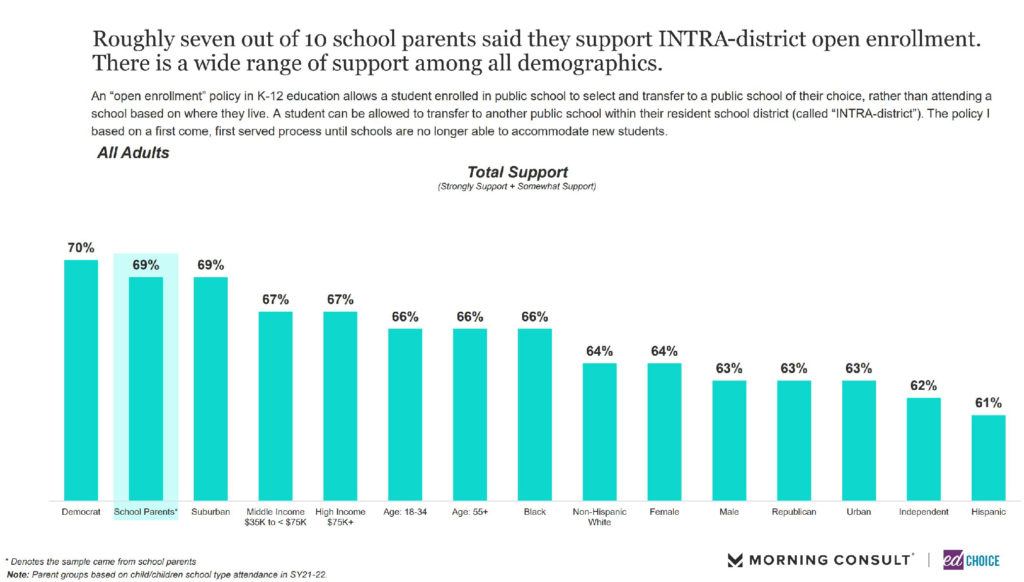
4. Open enrollment policies are popular public school choice policies, especially among Democrats. We included questions about two forms of public school choice for the first time in the February survey. We asked about intra-district choice, a policy that allows students to choose between traditional public schools within the boundaries of their local school district, and inter-district choice, a policy that allows students to choose between traditional public schools outside the boundary of their local school district.
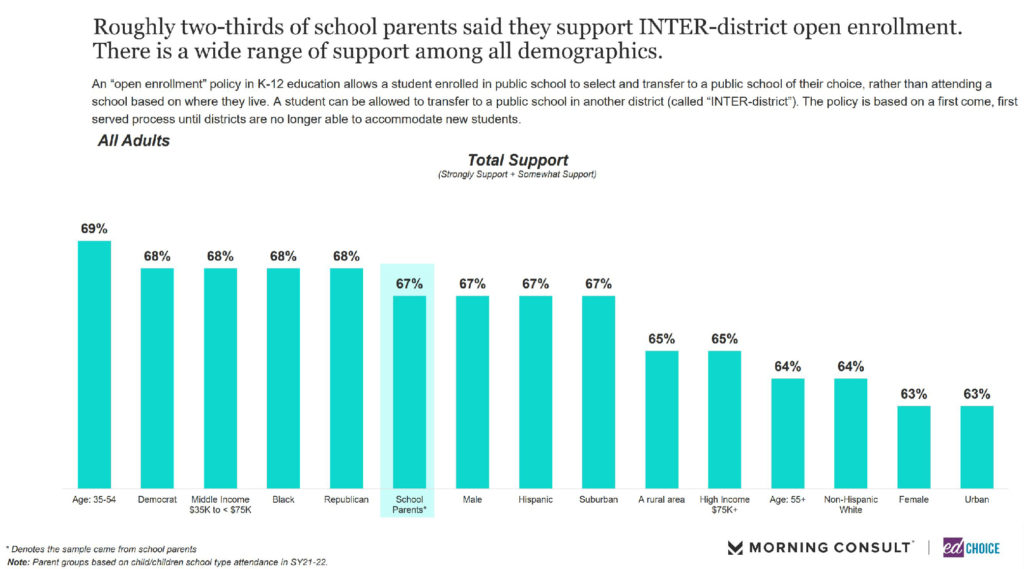
5. Both intra- and inter-district open enrollment were popular policies among both parents and the general population. Among the general population, open enrollment was as popular as ESAs, and among parents, the two policies were on par with ESAs and charter schools. Neither intra- or inter-district choice emerged as noticeably more popular than the other. Taking the two policies together, Democrats were the group most in favor of open enrollment, with 70 percent supporting intra-district choice and 69 percent supporting inter-district choice.
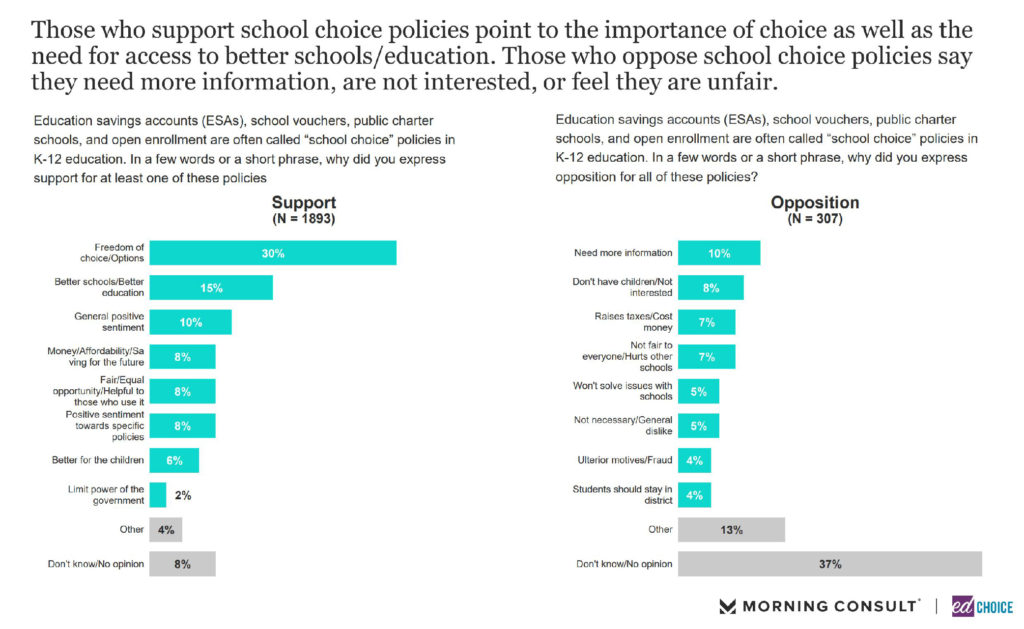
6. Opponents of school choice policies are less likely to have specific reasons for their position than supporters. This wave also marks the first time we asked respondents why they supported or opposed private school choice policies. Those who supported at least one private school choice policy were significantly more likely to answer this text-based question, with 92 percent of supporters providing some sort of explanation. In comparison, just 63 percent of those who opposed all three policies provided a reason.
The nature of responses differed between the supporters and opponents as well. While some supporters gave rather vague reasons for supporting school choice—for instance, about 10 percent of supporters more or less simply said it was good—supporters were more likely than opponents to provide a policy-specific reason for their position. Supporters were most likely to highlight freedom and opportunity the policies would provide (30% of all supporters and 33% of who gave a reason). A distant second reason was the improvement of school and educational quality (15% and 16%).
When asked why they opposed all three private school choice policies, the 63 percent of opponents who gave a reason were most likely to point to factors not related to the policies themselves. These opponents were more likely to say they didn’t know enough about the policies to support them than anything else (10% of all opponents and 16% of opponents who provided an answer). The second-most common explanation was that the opponent did not have children or otherwise was not invested in education policy (8% and 13%).
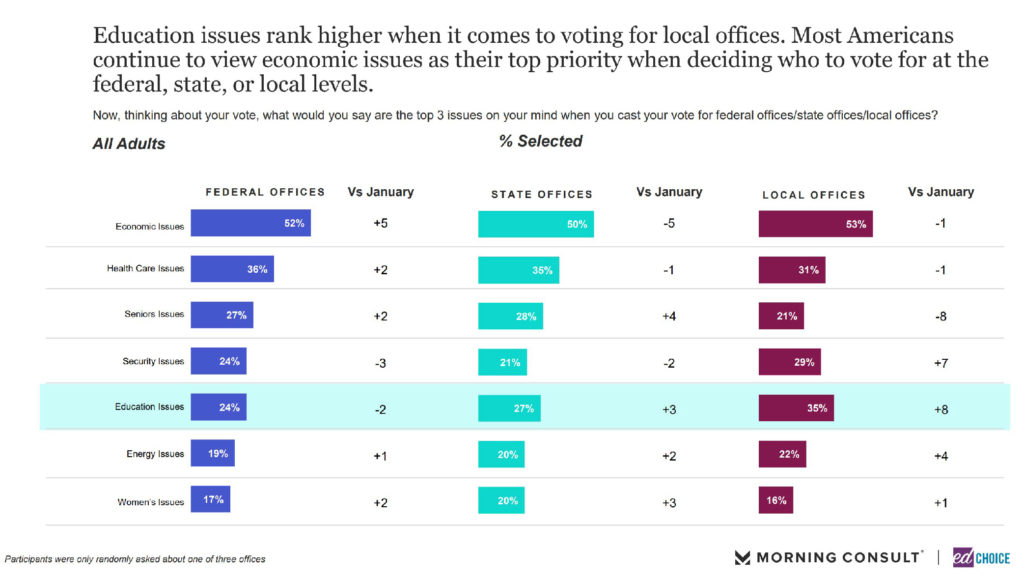
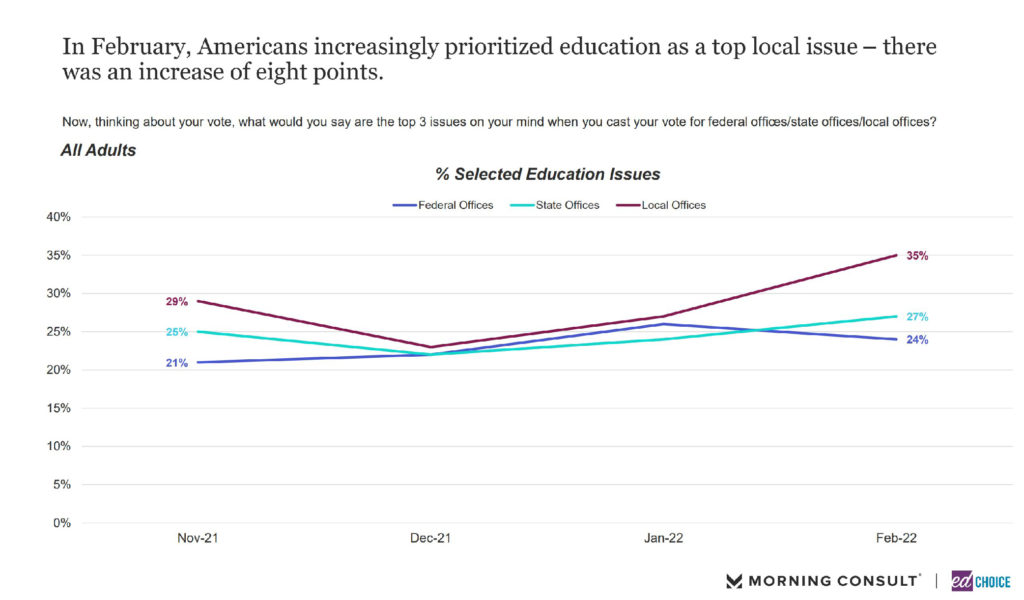
7. Compared to January, people are more likely to value education issues in local elections but less likely to consider them for national offices. We presented seven policy issues to the respondents and asked them to name the three policy issues they consider most when voting for a political office. As has been the norm since we began asking this question in November, economic issues was the top-named policy issue for federal, state, and local elections, being named by over half of respondents for each category. Once again, education issues were most likely to be a top-three issue for a voter in local elections, receiving top-three placements from 35 percent of respondents, second only to economic issues. Education issues were a high-priority issue for local and state elections in February, but education was less likely to be named a top issue for federal elections.