EdChoice Public Opinion Tracker: Top Takeaways July 2022
We are rapidly approaching the beginning of the 2022-23 school year. Vacations are winding down while back-to-school commercials are ramping up. Teachers, administrators, parents, and students have spent the last few school years trying their best to adapt to the changing landscape around them. While this school year undoubtedly feels more normal than the previous years living amidst COVID-19, there is a lot left to be answered.
Since time is of the essence, let’s dive into the July wave of EdChoice’s monthly Public Opinion Tracker. Working together with Morning Consult, we survey a nationally representative sample of adults 18 and older (N=2,200) each month. This latest survey was in the field from July 14-15. With additional sampling, we obtained responses from 1,205 parents of school aged children.
Here are the key findings that we learned in July:
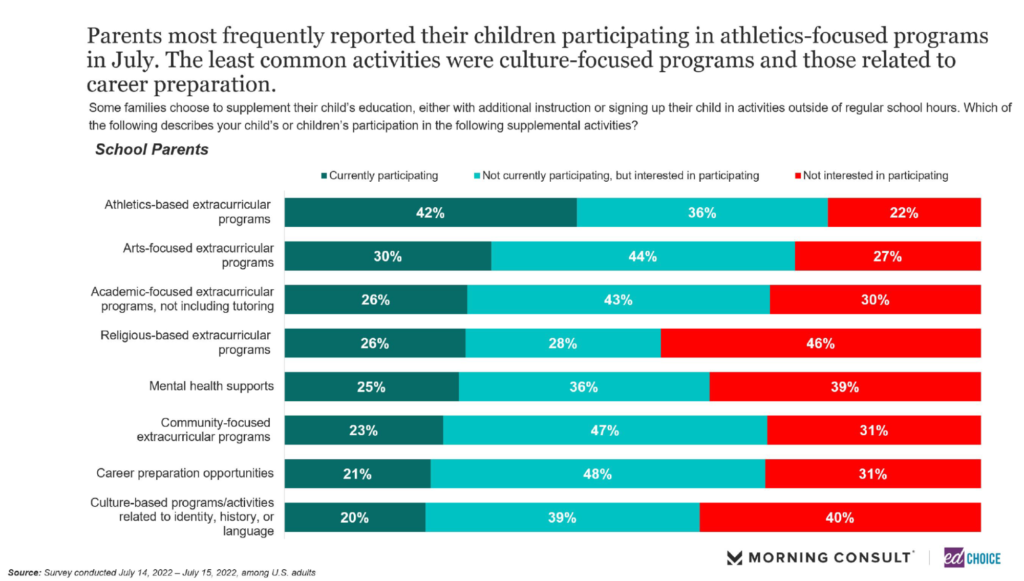
1. Athletic based activities are the most popular extracurricular activity this summer. For the first time in our monthly polling, we asked parents to dive into specifics regarding their child’s extracurricular activities. Athletics-based activities were easily the most popular in terms of active participation, with more than 40 percent of parents saying their child is currently participating in them. Career preparation activities (internships, apprenticeships) and community-focused extracurricular activities (volunteer opportunities) were the two most popular activities that parents indicated their child was not currently participating but had interest in. At the other end of the spectrum, nearly 50 percent of parents indicated their child was not interested in participating in religious-based extracurricular activities.
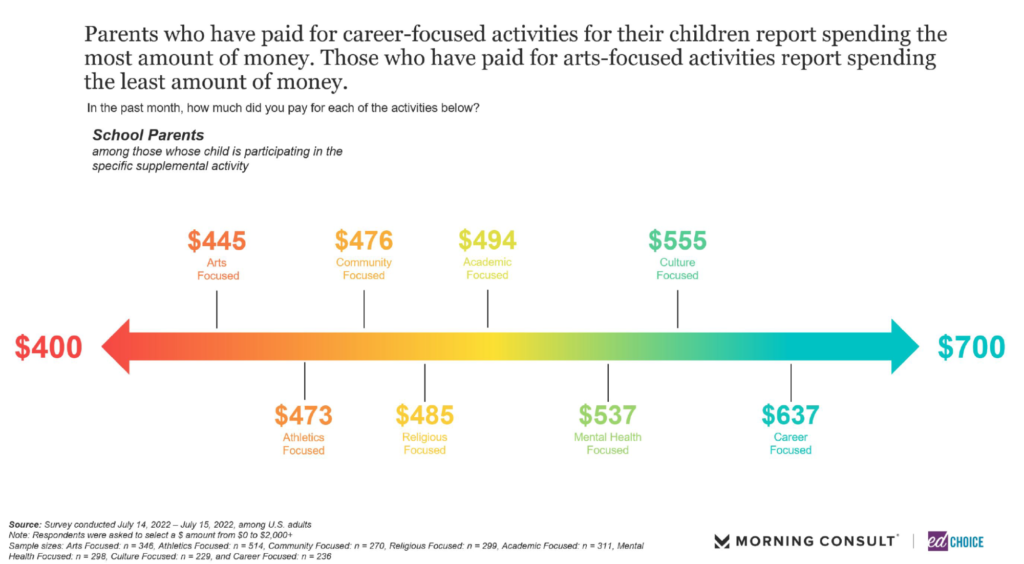
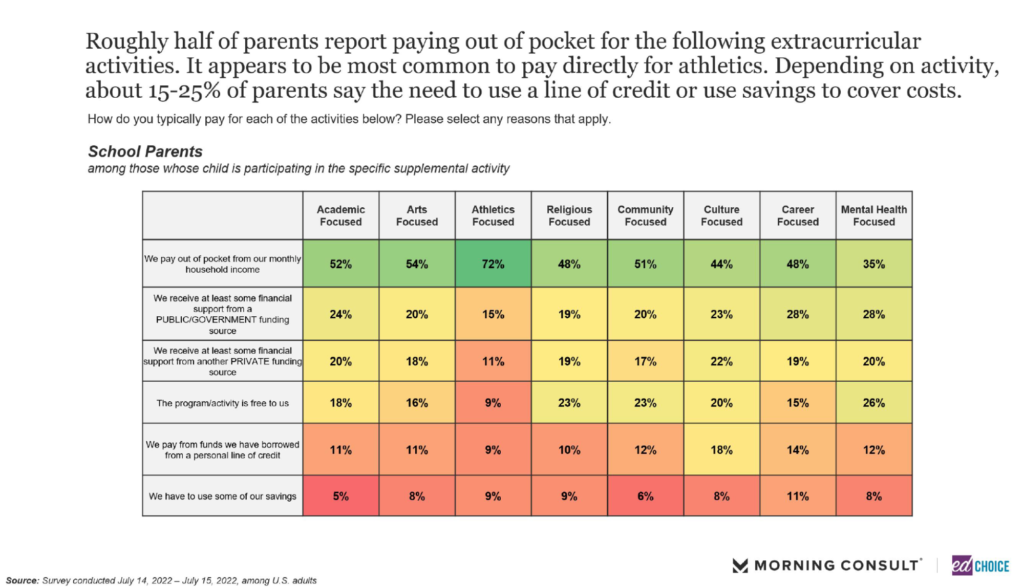
We also asked parents about the cost of each activity. Notably, the cheapest activities were the ones with the most participation, arts-focused activities ($445/month) and athletics-based activities ($473). Also worth mentioning is that the most expensive activity by a wide margin ($637), career-preparation activities, was the activity that had the most interest among parents and their children. We also asked parents about how they pay for each activity, with the majority of parents saying they pay out of pocket from their monthly income.
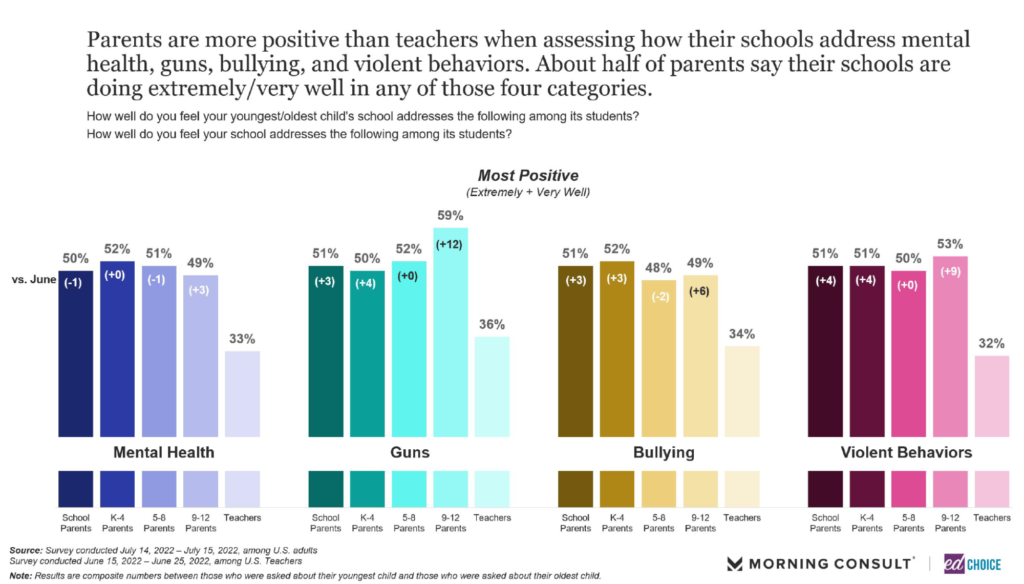
2. Teachers are much less positive than parents when assessing how their schools address mental health, guns, bullying, and violent behaviors. Academics were not the only thing in schools negatively affected by the pandemic. The social and mental well-being of students suffered greatly, as well. Schools have an uphill battle to climb in that respect, but many schools have already implemented strategies to boost social and emotional support. Schools probably needs to do something, as only roughly one-third of teachers say their school is doing well or extremely well when it comes to addressing mental health, guns, bullying, and violent behaviors. Parents, on the other hand, are much more positive. Roughly 50 percent of parents feel their child’s school is doing well in addressing those issues. Parents’ positivity has increased slightly since we first asked the question in June in response to the Uvalde tragedy.
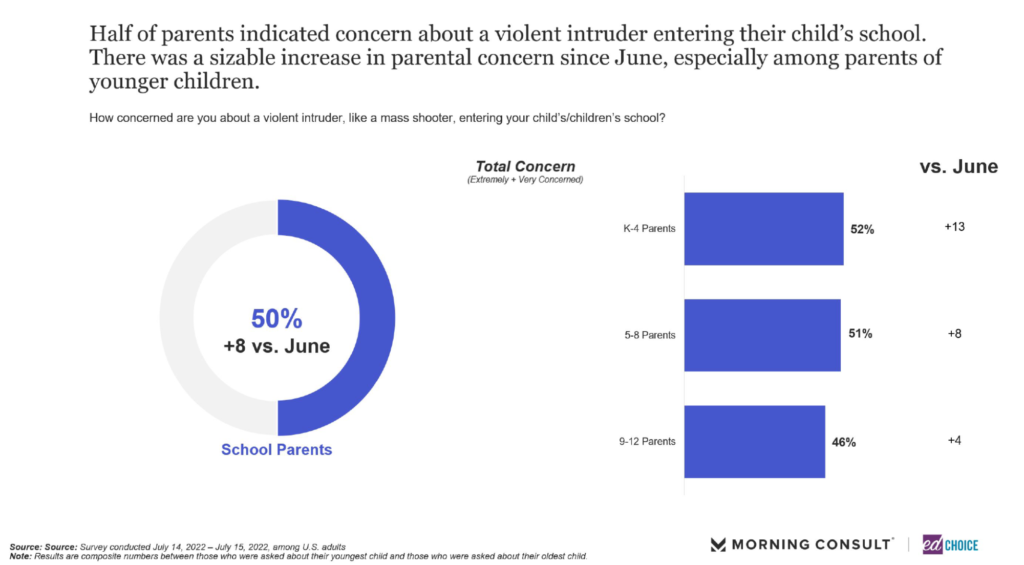
Roughly 50 percent of parents are concerned about the likelihood of a violent intruder entering their child’s school. That is an 8-point increase from June. Parents of younger children are the most concerned, up 13 points from June to 52 percent. There was an increase in concern among parents of middle school children, as well as parents of high school children, albeit to a lesser extent (8- and 4-point increases, respectively).
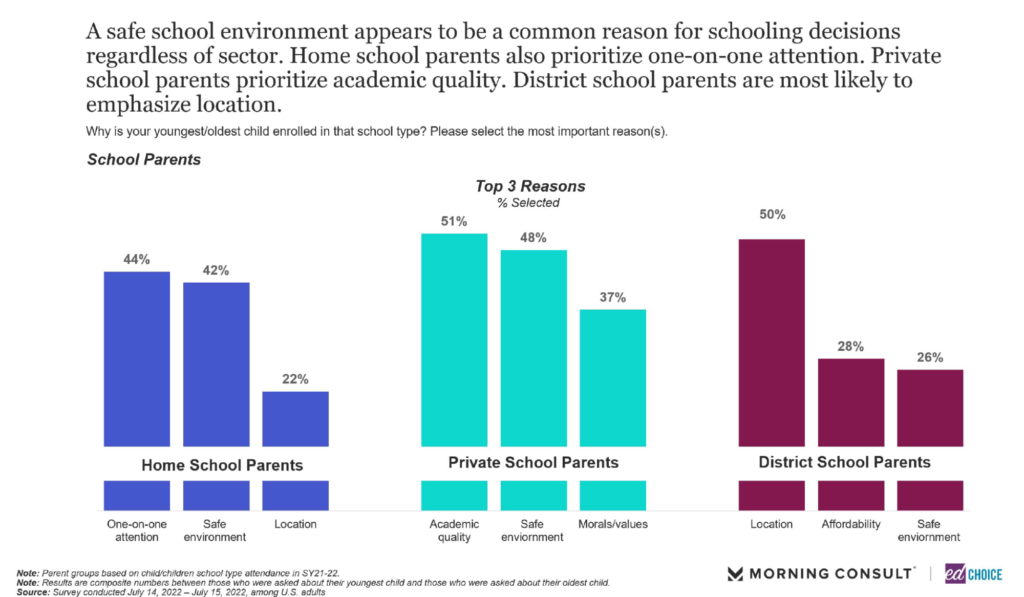
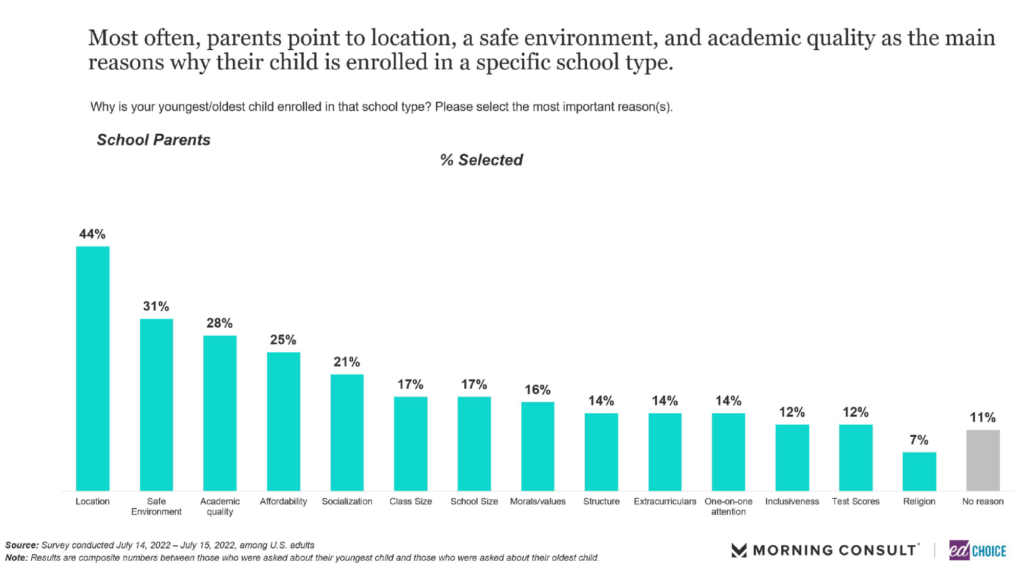
3. Location, a safe environment, and academic quality were the top reasons parents enrolled their child in a specific school type. We asked parents about the reasoning that led to enrolling their child in the type of school they currently attend. Location (44%) was the most popular reason, with safe environment (31%) and academic quality (28%) following behind. When broken down by schooling type, exactly half of district school parents selected location as their primary reason for choosing their school. The disparity between district school parents’ primary reason and their next most popular reason (affordability, 28%) was large. Private school parents and home-schooling parents had a bit less certainty in their top choice. Home-schooling parents’ top reasons were one on one attention (44%) and a safe environment (42%). As for private school parents, academic quality was the main reason at 51 percent, with a safe environment following closely behind at 48 percent.
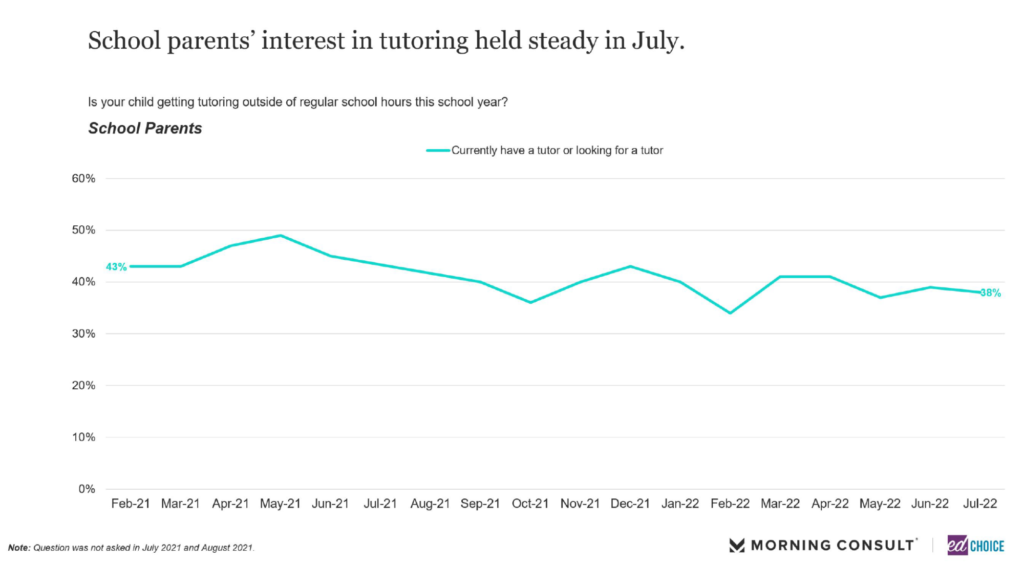
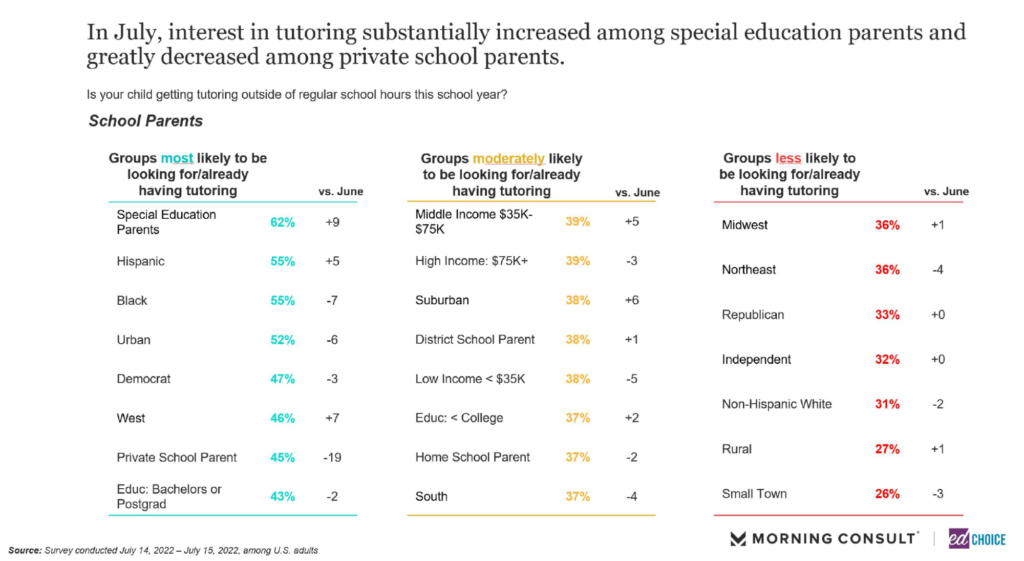
4. Tutoring interest held steady in July. Many schools have begun placing a much larger emphasis on tutoring to try and combat the unprecedented learning loss sustained over the last several years. Currently, more than one-third of parents are getting their child tutored outside of school hours. Diving into the demographics, nearly two-thirds of special education parents indicated they are currently participating in or seeking out tutoring, up 9 points from June. Private school parents, typically one of the groups most interested in tutoring, saw their interest fall 19 points to 45 percent in July.
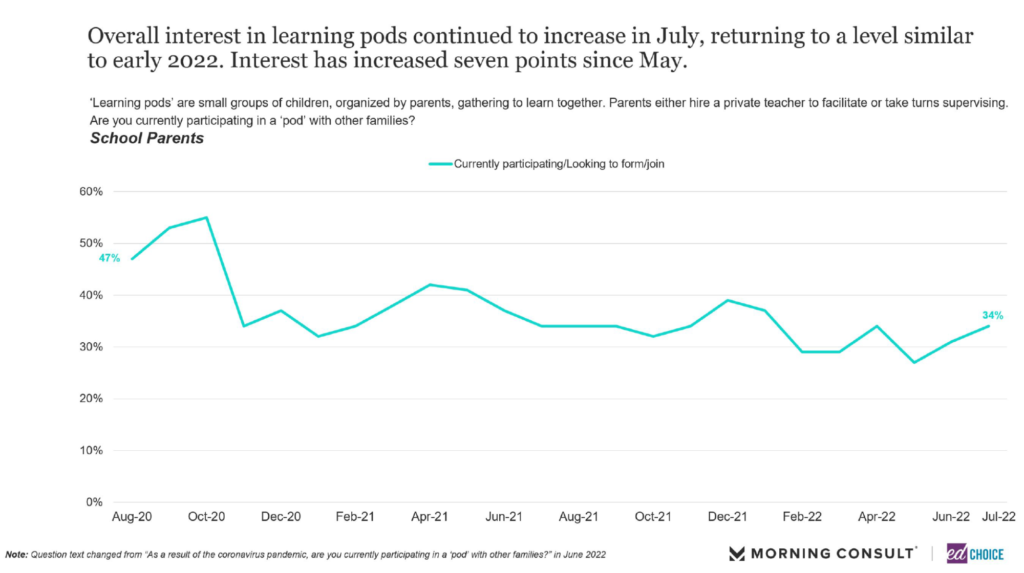
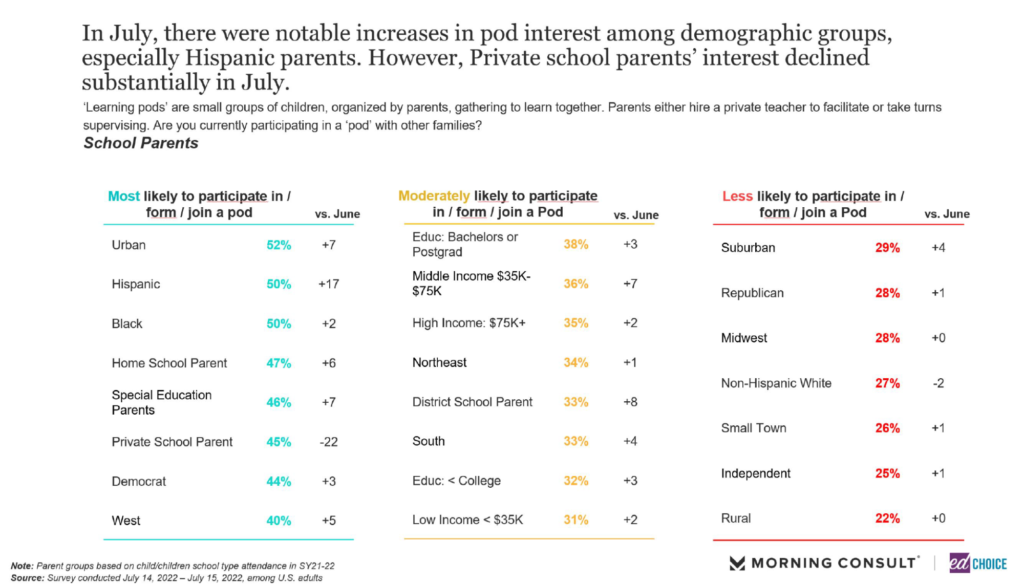
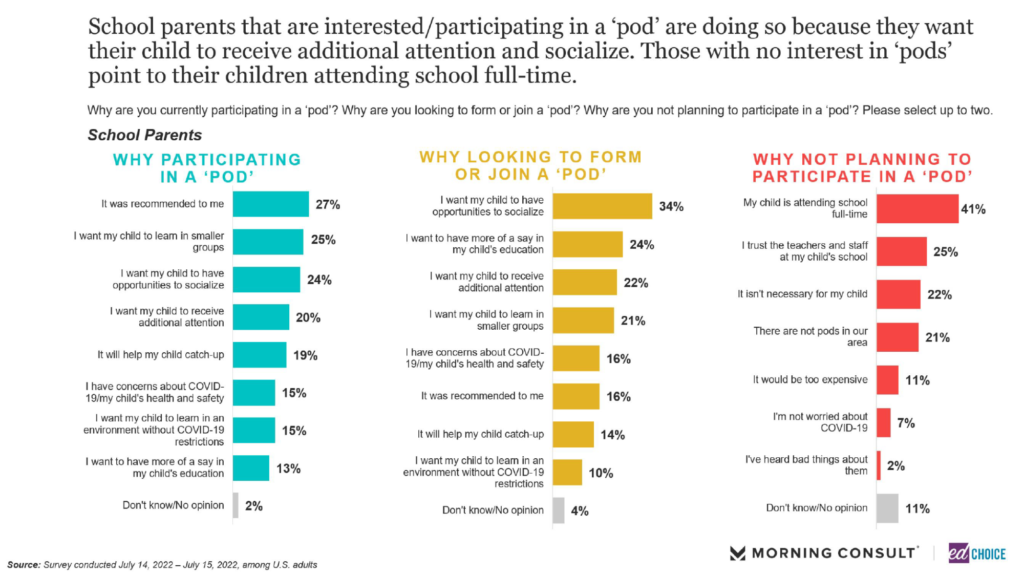
5. Learning pod interest increased for the second consecutive month. After falling below 30 percent for the first time in our polling, interest in learning pods jumped back to 34 percent of parents in July. Why do parents want their child in a pod? One of the tops reasons was a desire for their child to have opportunities to socialize. Similar to tutoring, learning pods experienced a serious decline (22 points) in interest from private school parents. On the other hand, Hispanic parents’ interest in learning pods increased 17 points in July.
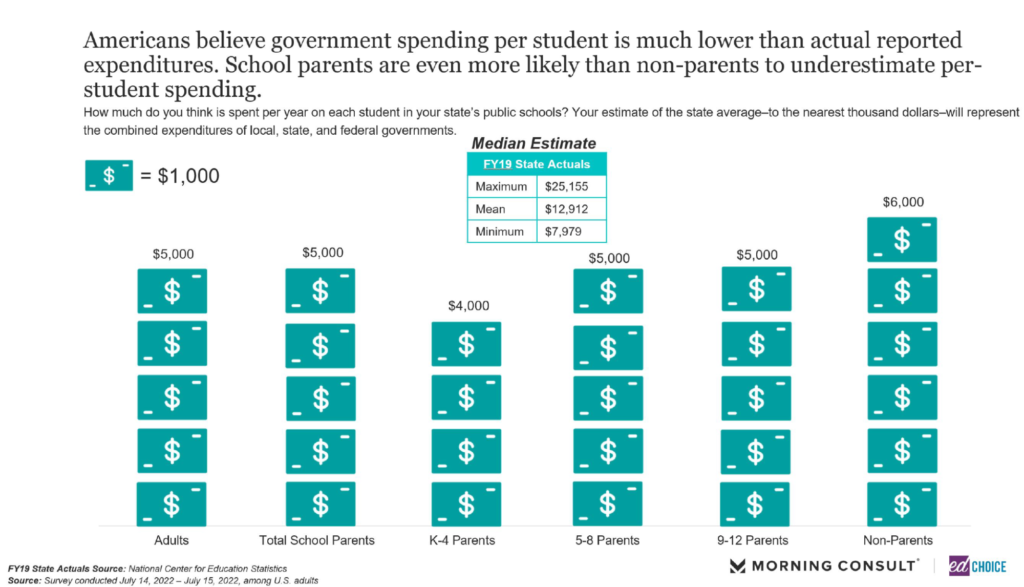
6. School parents are more likely than non-parents to underestimate per-student spending in public schools. When asked to estimate how much is spent annually on each student in public schools, parents estimated $5,000 while non-parents guessed $6,000. Both groups could double their guesses and still be underestimating the amount of school spent per student in public schools. The true average amount spent per state is slightly less than $13,000.
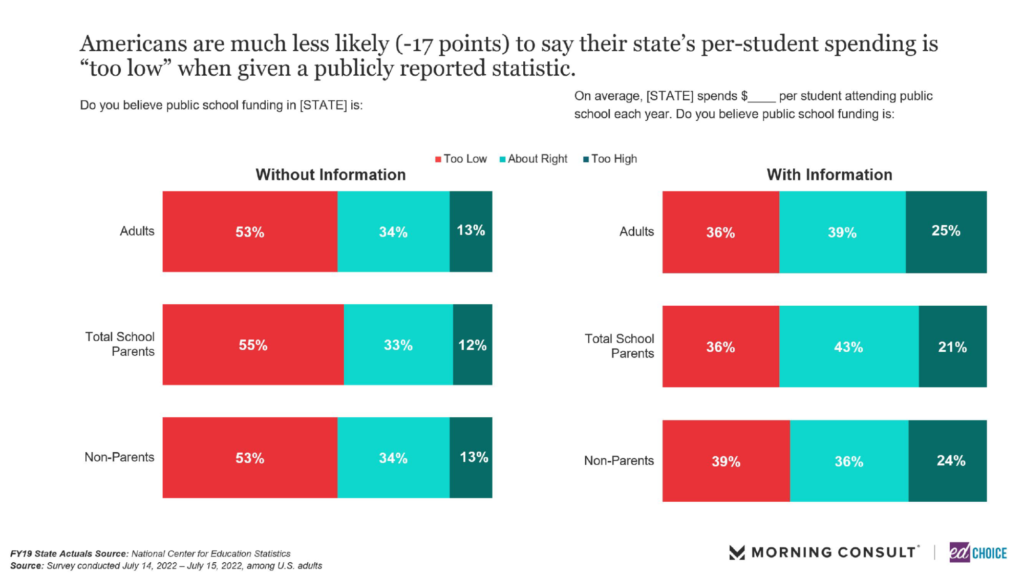
When asked if public school funding is too low, more than half of school parents agreed with that statement without being supplied with any sort of statistic on the matter. When presented with the spending figures, only one-third of school parents believe the funding in public schools is too low. The percentage of school parents who believe public school funding is too high nearly doubles when presented with the actual amount.
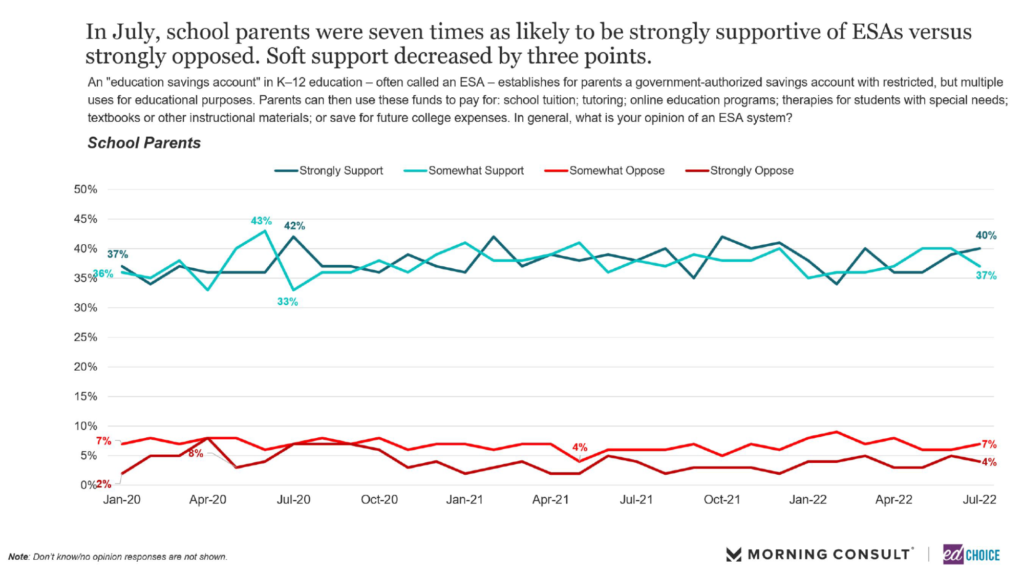
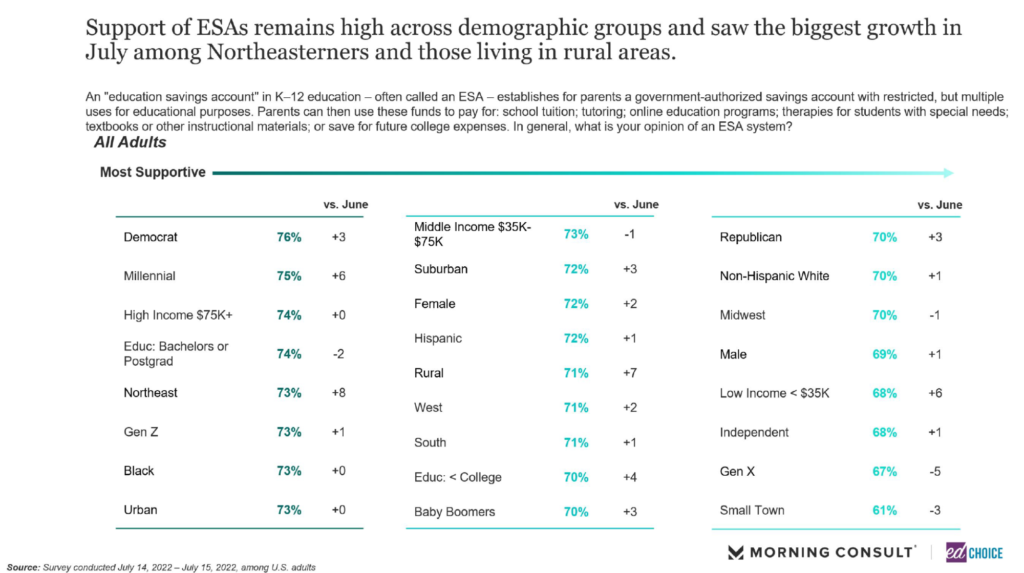
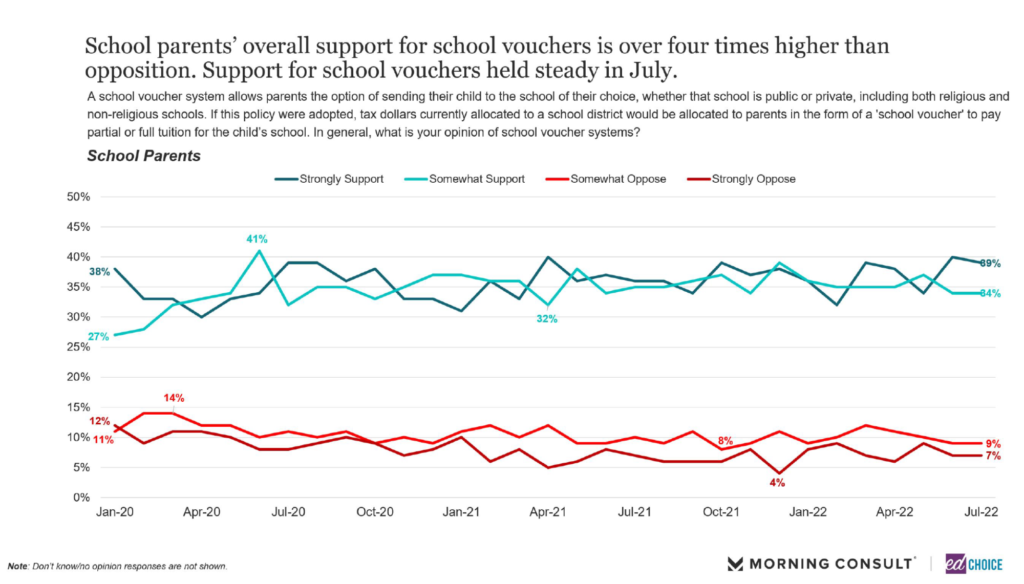
7. Nearly two-thirds of Americans support school choice policies when given a description. Strong support among Americans for each of the four school choice policies we poll about increased in July. Education savings accounts (ESAs) continue to be the most popular of the policies among all adults (71 percent support) as well as school parents (77 percent support). Democrats and Millennials are the groups most supportive of ESAs, with adults living the Northeastern part of the country trailing just behind after the largest increase in support (8 points) from June. The demographic breakdown of support for school vouchers yielded interesting findings, as well. Black adults, a group that is often near the top of support for vouchers, decreased 10 points from June. Hispanics and Republicans were the groups to lead the way in support of vouchers for July.
A bit of good news to report on this front: Recently Arizona’s Governor Doug Ducey passed legislation making ESA’s universal in the state of Arizona. This is the most expansive school choice legislation in the country. More than a million K-12 students in Arizona will have more opportunities to attend the educational setting that best fit their needs
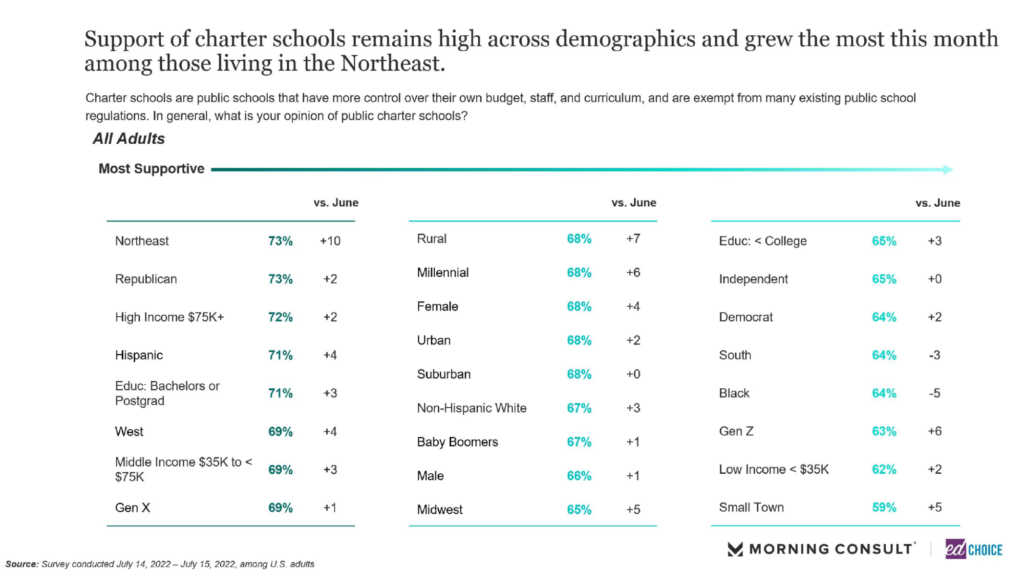
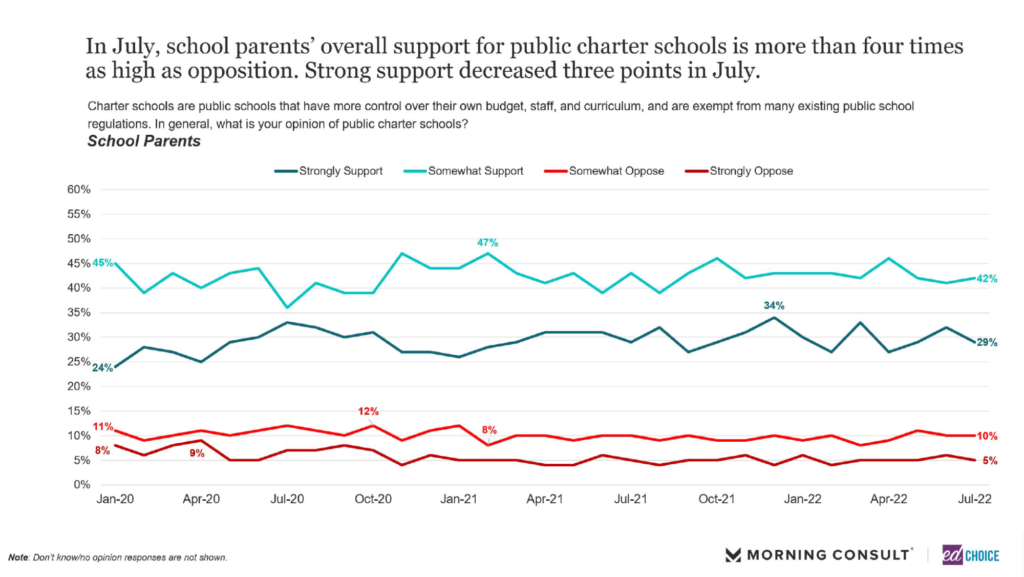
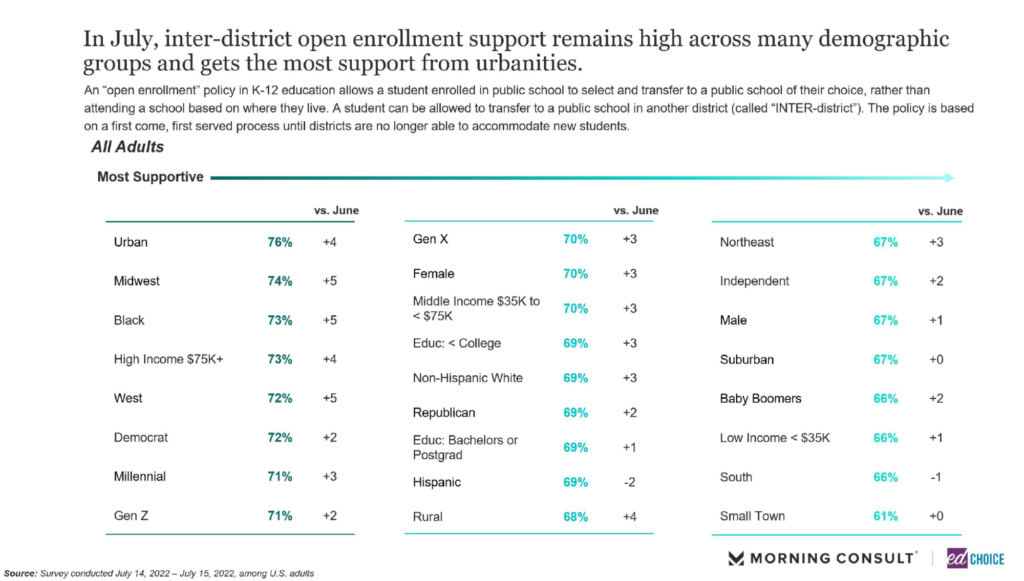
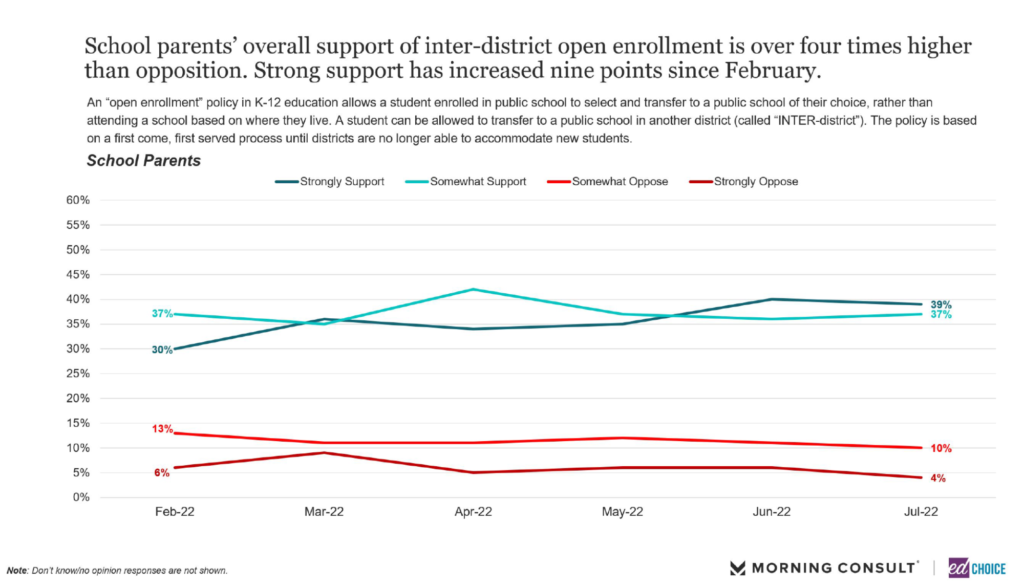
Americans’ support for charter schools increased slightly in July, up to 67 percent. School parents exhibited a decrease in strong support for charter schools in July, though the overall support is still quite strong at over 70 percent. Lastly, when examining support for inter-district enrollment, adults living in urban areas are the most supportive group with 76 percent. People from the Midwest, Black adults, and high-income earners ($75,000+) were the next most supportive groups of inter-district enrollment.
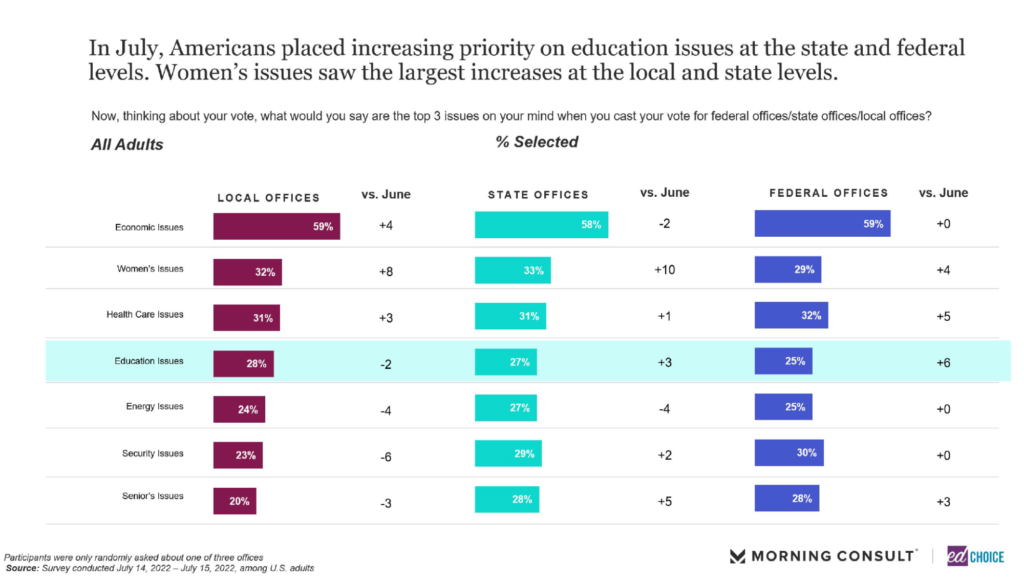
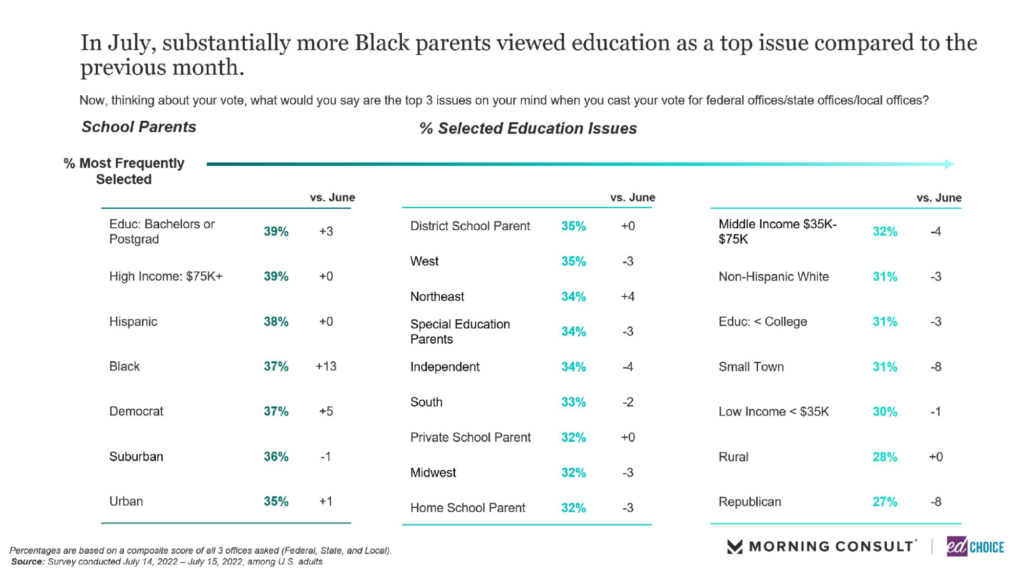
8. Education issues were more important among voters at a state and federal level in July. Compared to recent months, respondents were less likely to name K-12 education as a top-three issue they would consider in a local election. They still were more likely to value education issues at the local level than at the state or national levels. Black voters and educated voters (Bachelor’s degree or higher) were among the groups to prioritize education issues most often. Women’s issues and health care issues were significantly more likely to be prioritized at local, state, and federal levels in July.
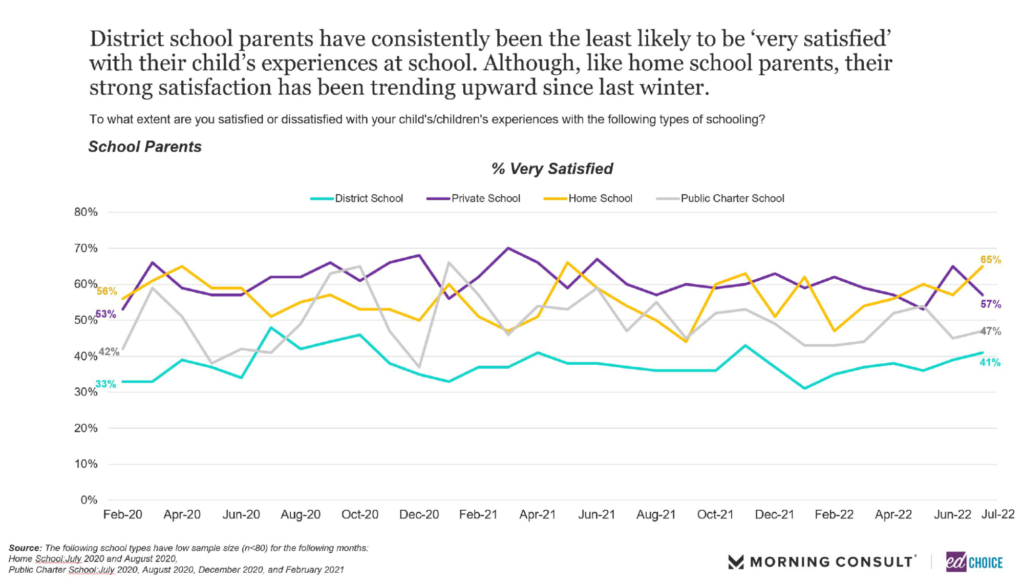
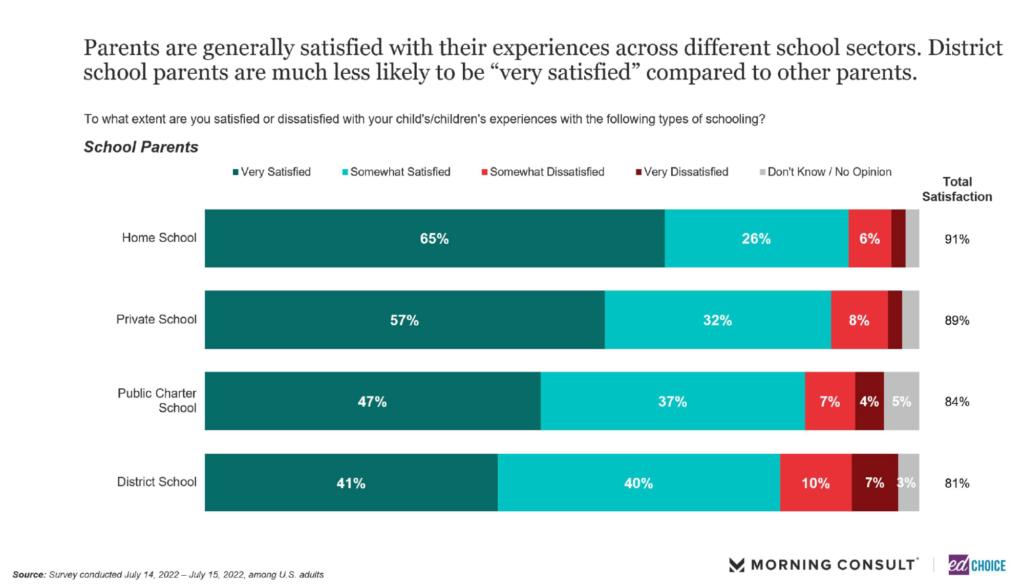
9. The majority of homeschool and private school parents are very satisfied with their child’s experiences at school. In terms of general satisfaction, more than 80 percent of parents are satisfied with their experience, regardless of school type. Even district school parents, typically the least satisfied group, consistently report satisfaction levels above 80 percent. Nearly two-thirds of homeschool parents report being very satisfied with their schooling experience, the highest level we’ve seen since we began tracking the question in February of 2020.
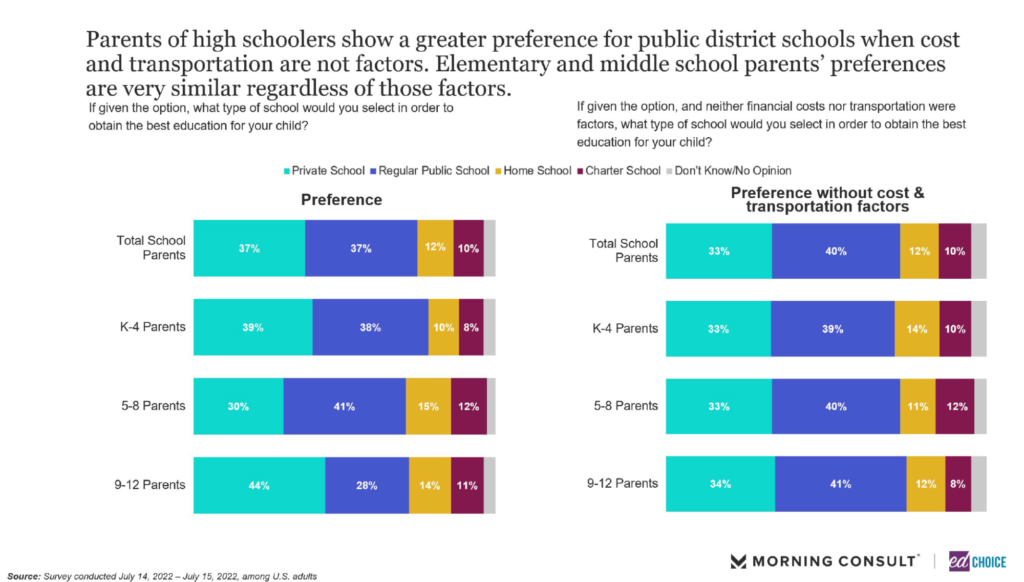
10. Parents’ preference of school type is relatively unchanged when cost and transportation are not factors. Nearly 3 in 4 parents prefer either private or public school for their child. When asked about their preference if cost and transportation were not an issue in the equation, parents’ preference of private and public schools remains static. Parents of high schoolers would prefer their child to be enrolled in private school over any other type of school. Interestingly, their choice changes to public school when asked about their preference without cost and transportation factors involved.
Visit the EdChoice Public Opinion Tracker site to access past reports, crosstabs, and questionnaires. We update our national and state dashboards every month. We also provide a more in-depth description of our research and survey methods.
Our K–12 education polls archive is updated on a rolling basis, roughly a few times each month. Please don’t hesitate to let us know if we are missing any surveys, or if there are accidental errors.