EdChoice Public Opinion Tracker: Top Takeaways June 2020
What will “back-to-school” look like this fall? That question currently is dominating headlines in education news outlets as well as throughout the much broader media landscape. You can check out recent pieces at The New York Times, The Atlantic, Science, USA Today, POLITICO, and Bloomberg—and those have published just this past week!
The summer months are usually calm waters for education reporters and analysts. Not this year. The COVID-19 pandemic has forced wave-upon-wave of public debates surrounding back-to-school plans in the coming months.
Fortunately, we have some terrific resources to help guide you on this journey, especially when it comes to states’ and school districts’ 2020–21 reopening plans, which you can track using Education Week and the Center for Reinventing Public Education’s Evidence Project as well as Johns Hopkins University’s recently launched interactive reopening map. There are also several great collaborations compiling and archiving COVID19-education research, commentary, surveys, and more.
Recently, we have seen a lot of public polling around these contentious and volatile issues. Just in the past few days two major surveys released to the public. Education Next reported their results from a COVID-19 supplemental survey of school parents and teachers. The American Federation of Teachers (AFT) and Hart Research posted a survey of their members.
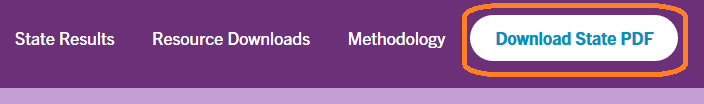
At the same time, EdChoice has updated its monthly tracking poll dashboards and downloadable files on our Public Opinion Tracker website. This month we have added a new feature. Users can download state-specific results now, which is currently a pooled six-month rolling average as of June. You just click the upper-right hand corner button on a given state dashboard and the download starts:
In this blog post I share findings that stand out from our most recent survey wave in mid- June, which includes our second quarterly survey of educators in addition to our monthly tracking of a nationally representative sample of adults 18 years and older.
As always, please let me know at paul@edchoice.org if you have any questions about our data or findings, or if you have ideas for new questions or topics.
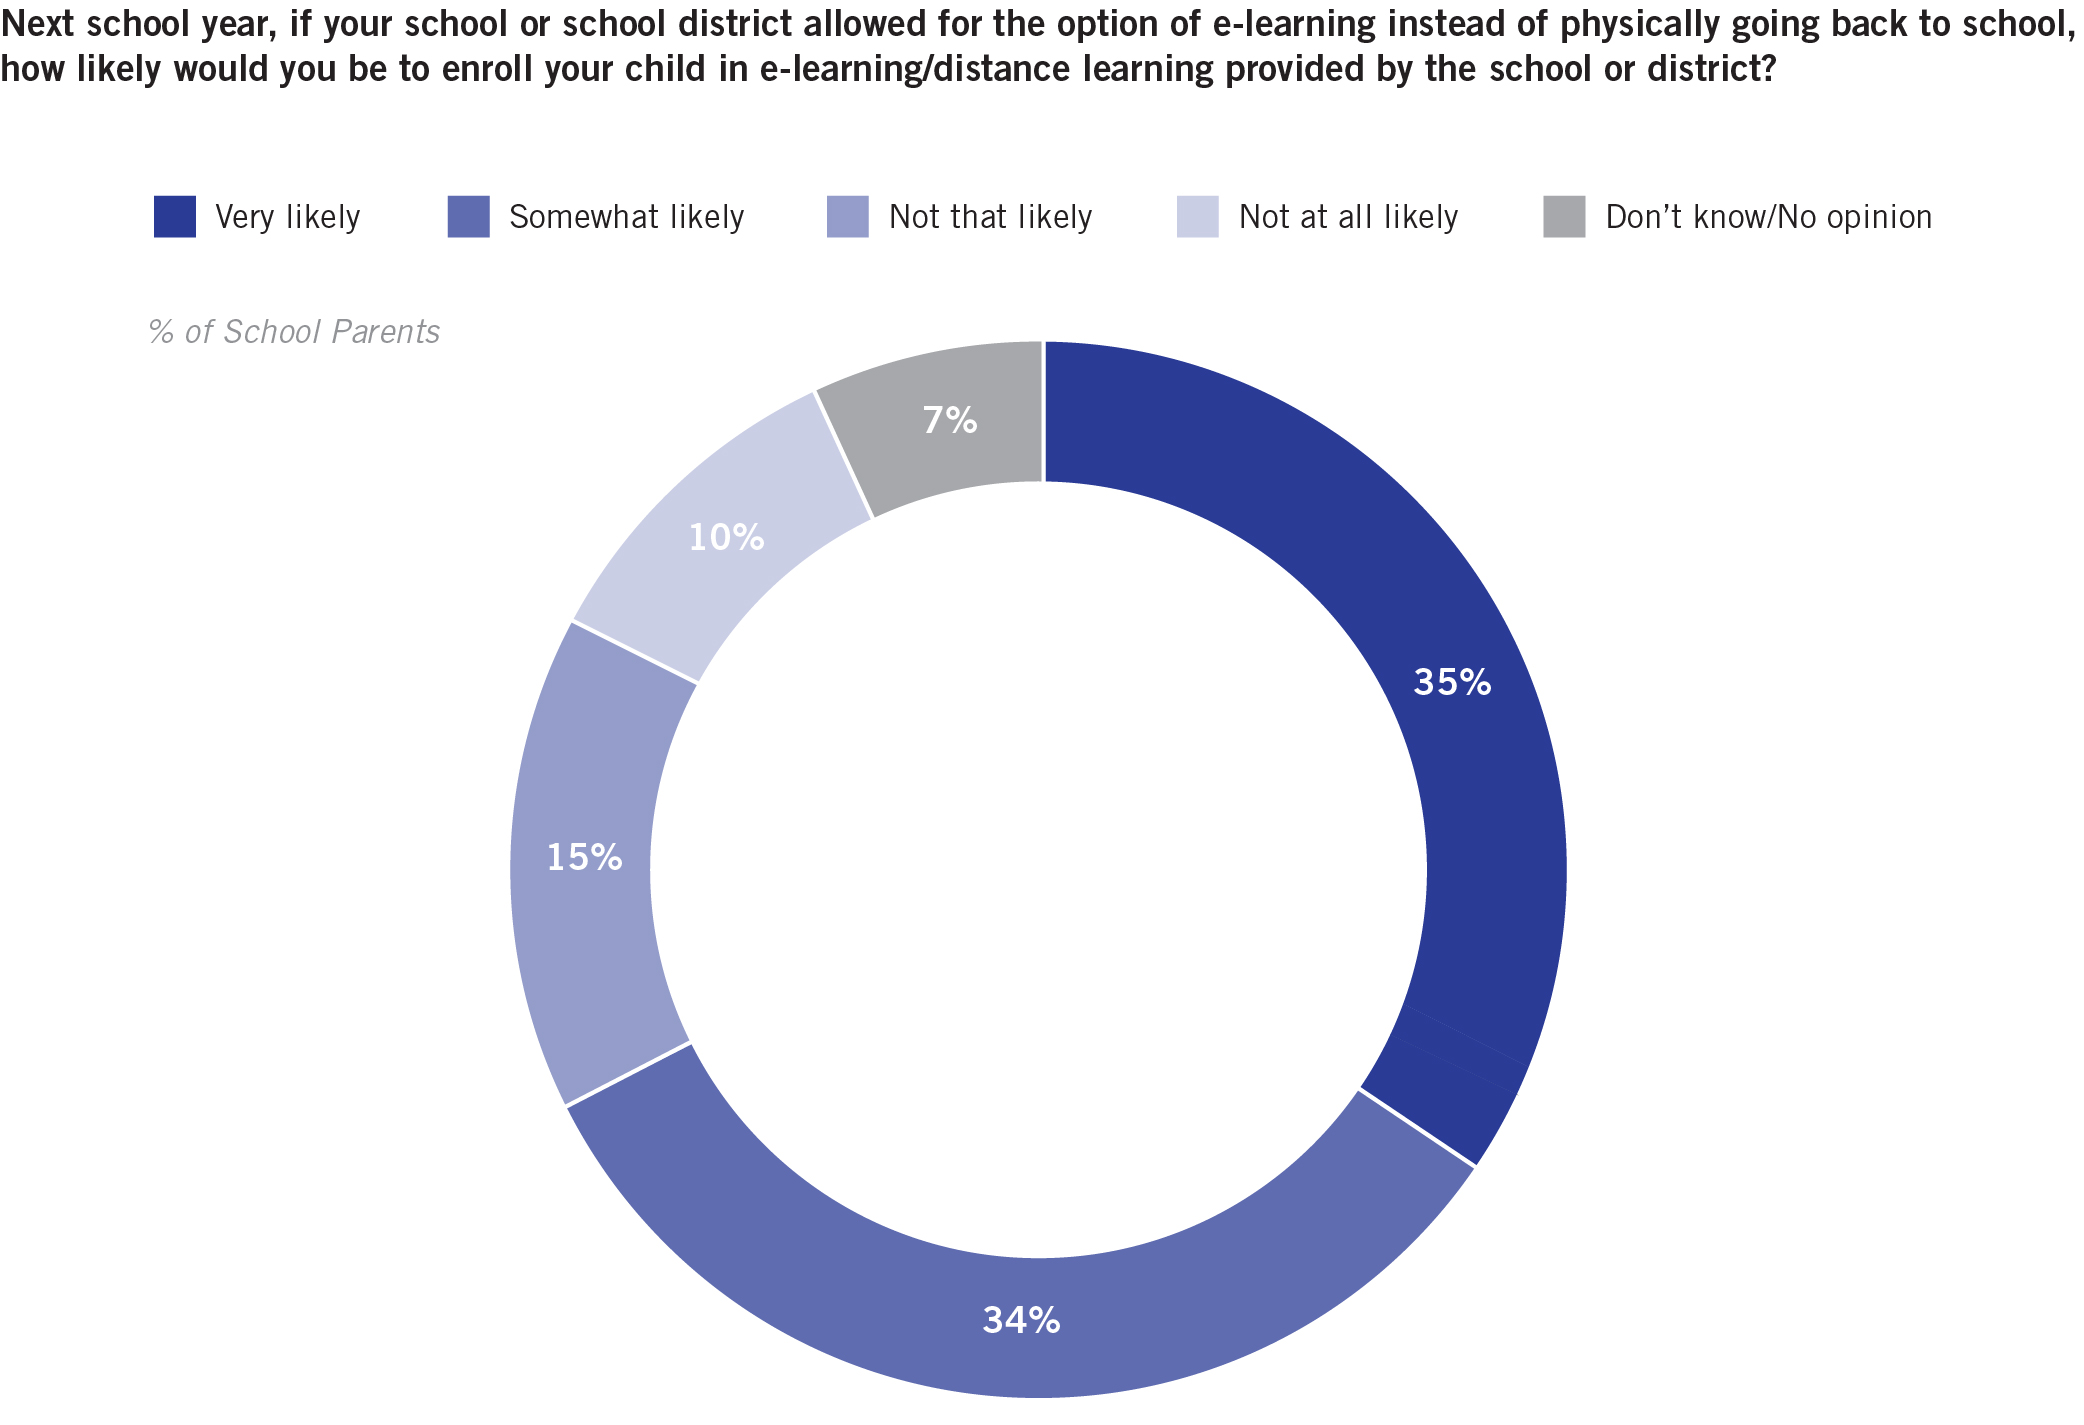
1. Nearly seven out of 10 parents are at least somewhat leaning toward distance learning next school year. More than one-third of K-12 school parents (35%) say they would take an online option for a child, if provided by the local school district. If that figure translates to some corresponding reduction/opt-out of in-person attendance, then there are clear implications for distancing/spacing and other in-person logistics for student learning this fall. Key questions beyond the scope of our survey and very important right now: How many school districts are offering these types of options? How prevalent is another kind of hybrid offering that mixes in-person and online learning? Are we seeing any differentiation by grade(s) or grade spans? How are districts communicating their plans with parents and teachers?
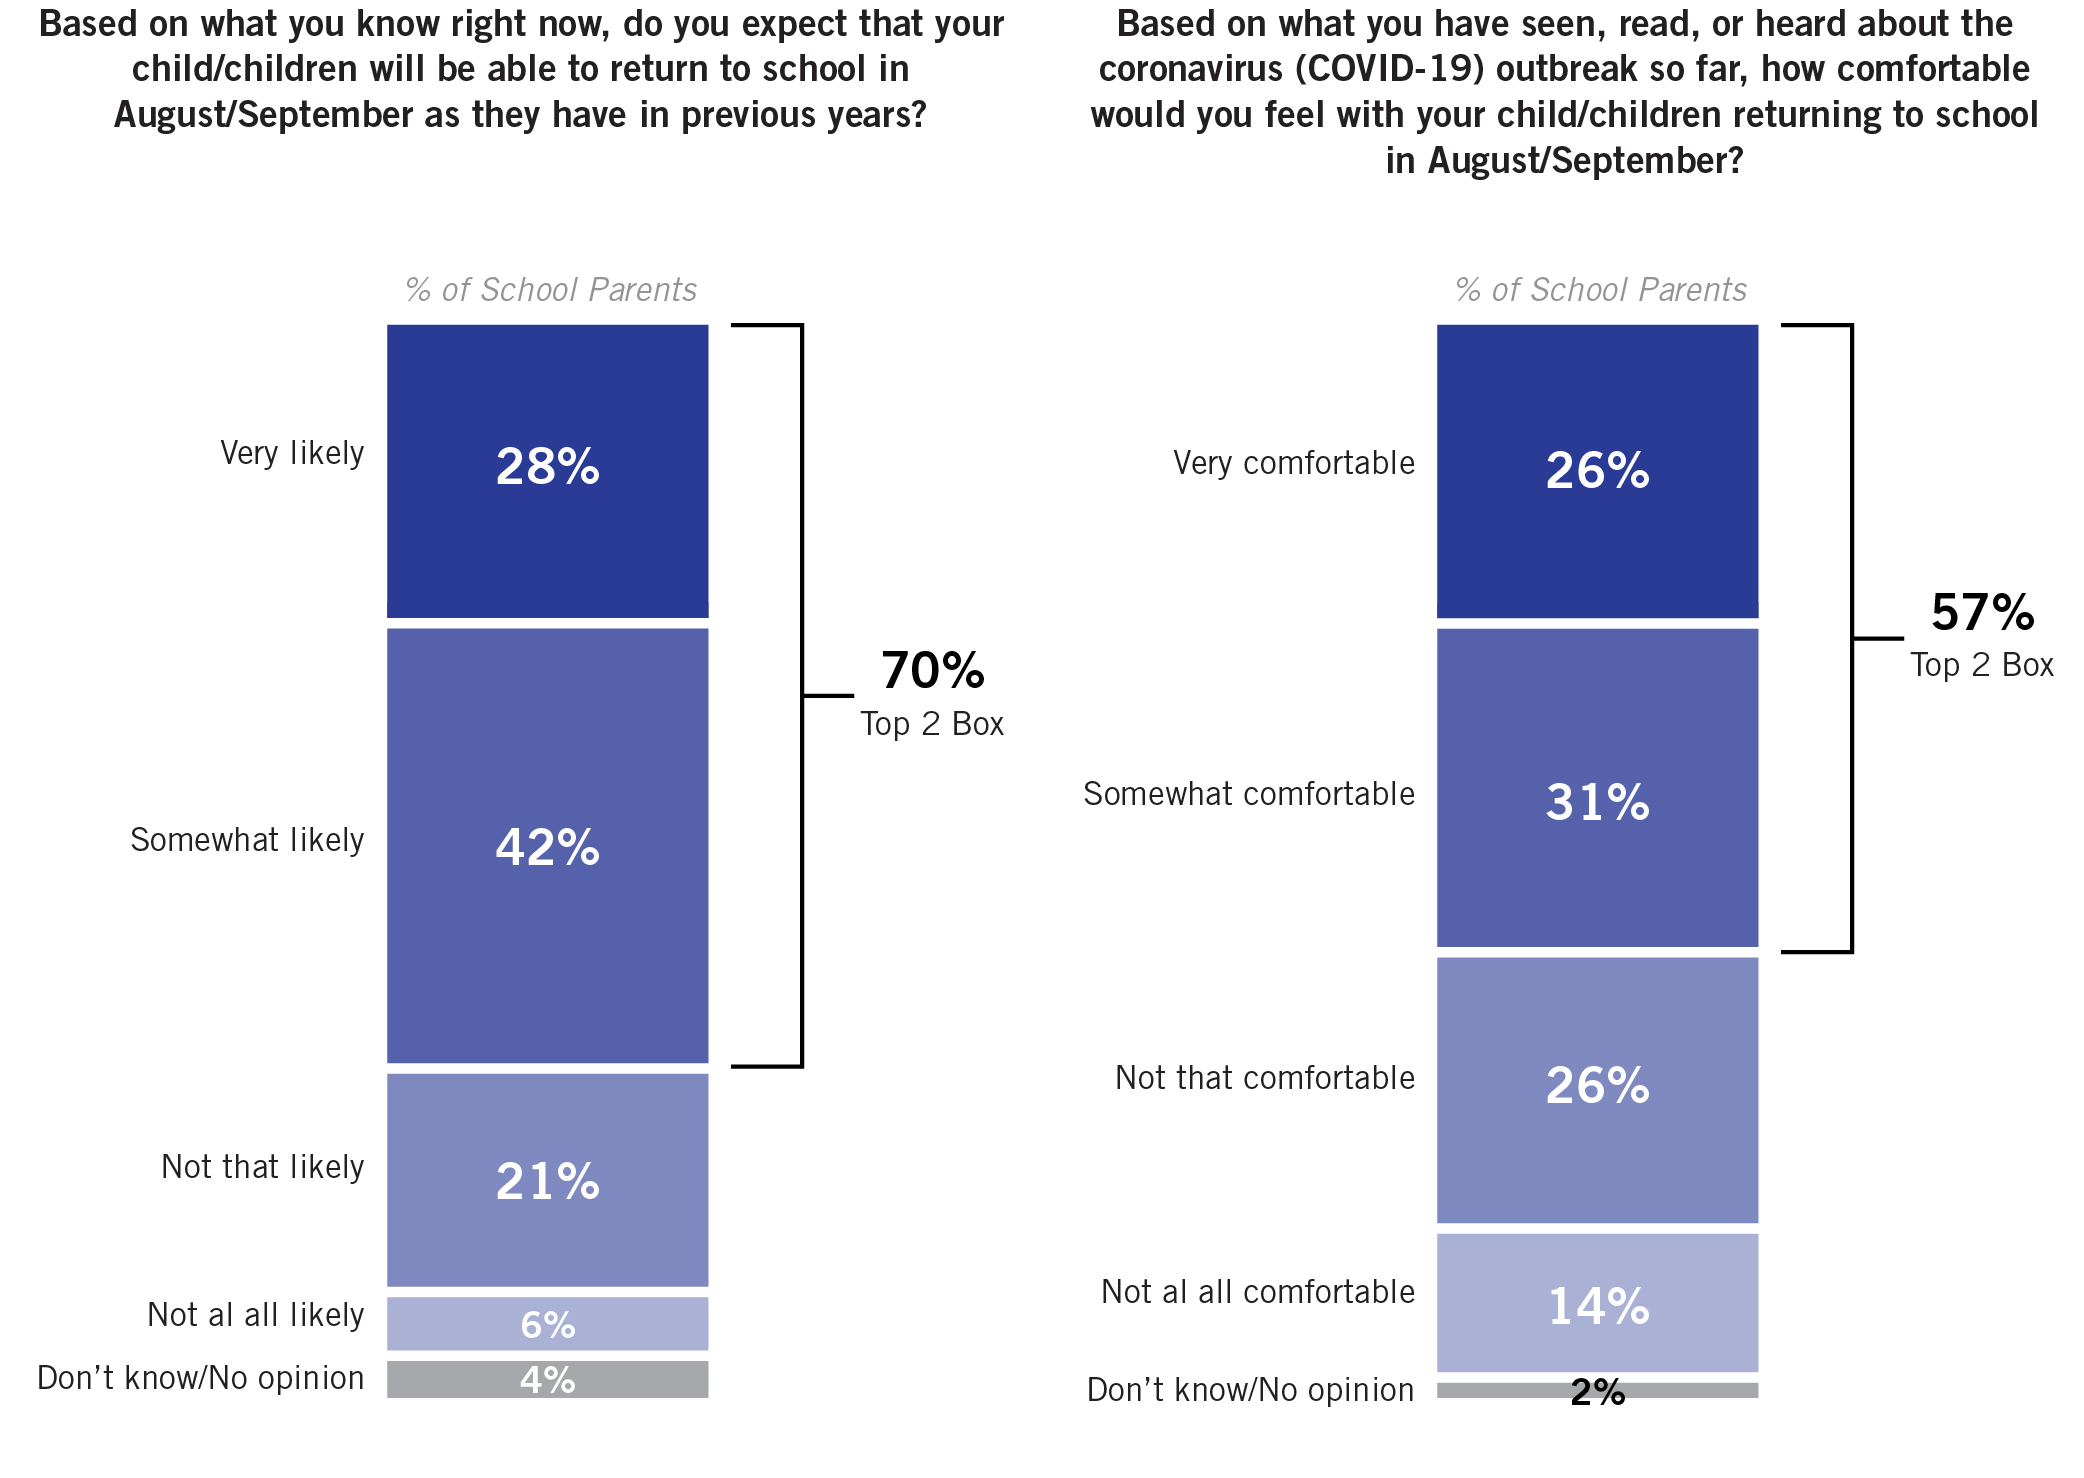
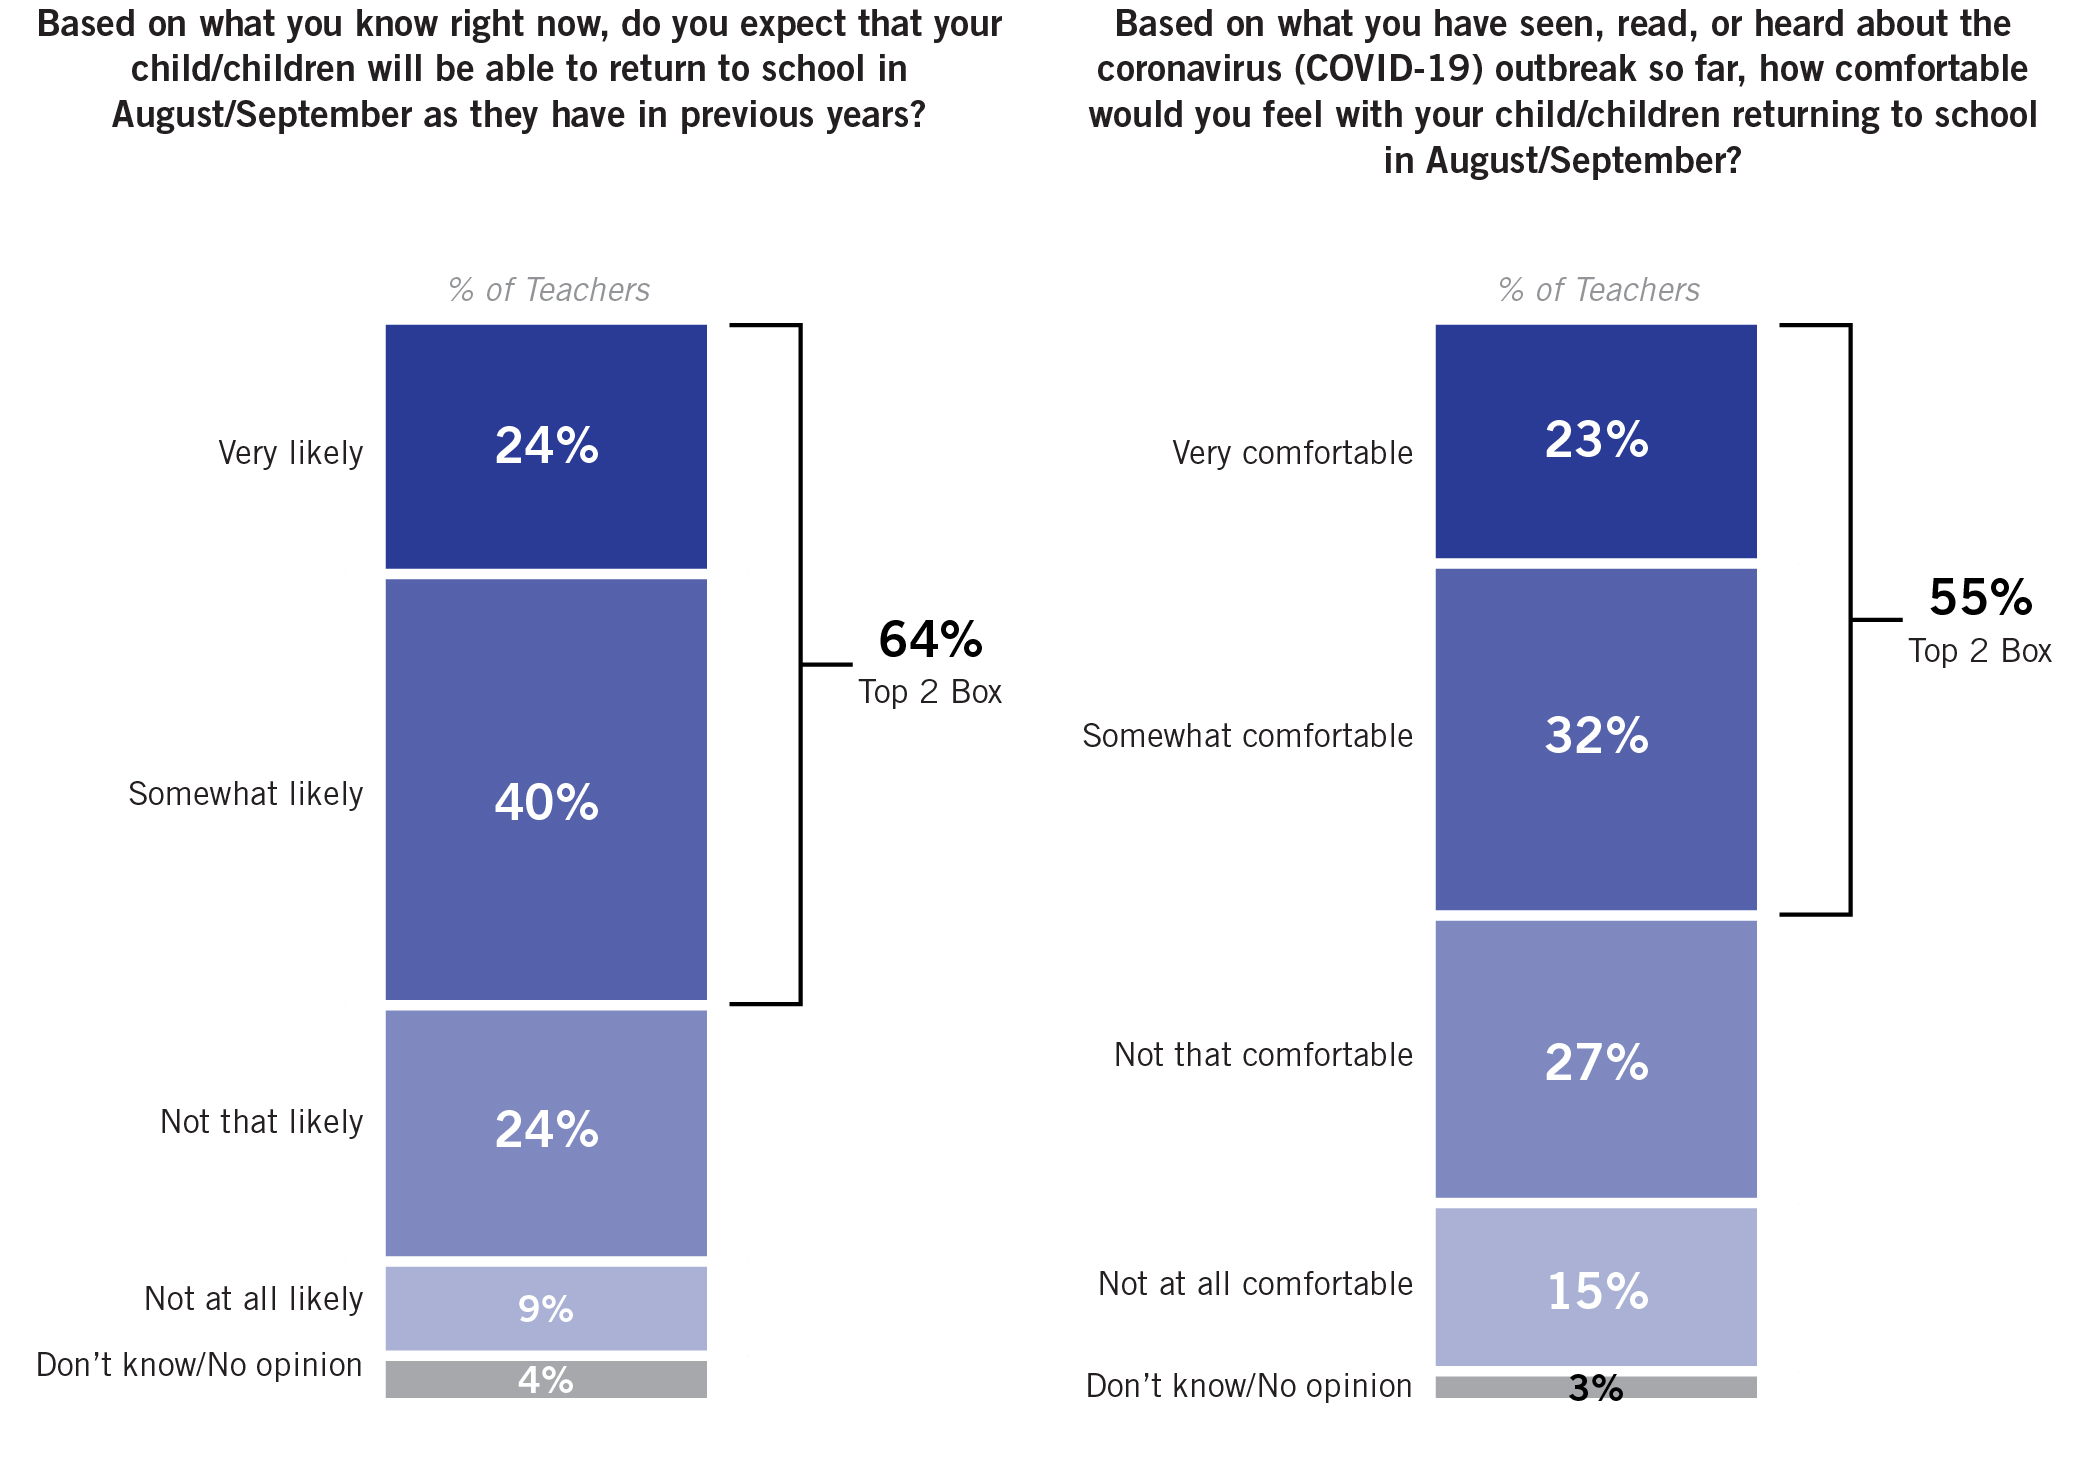
2. Most parents and teachers believe it’s at least somewhat likely back-to-school this August/September will be similar to previous years. But smaller proportions say they are as comfortable with returning to school. Only roughly one-quarter of parents—and about the same number of teachers—say they are “very comfortable” about going back to school.
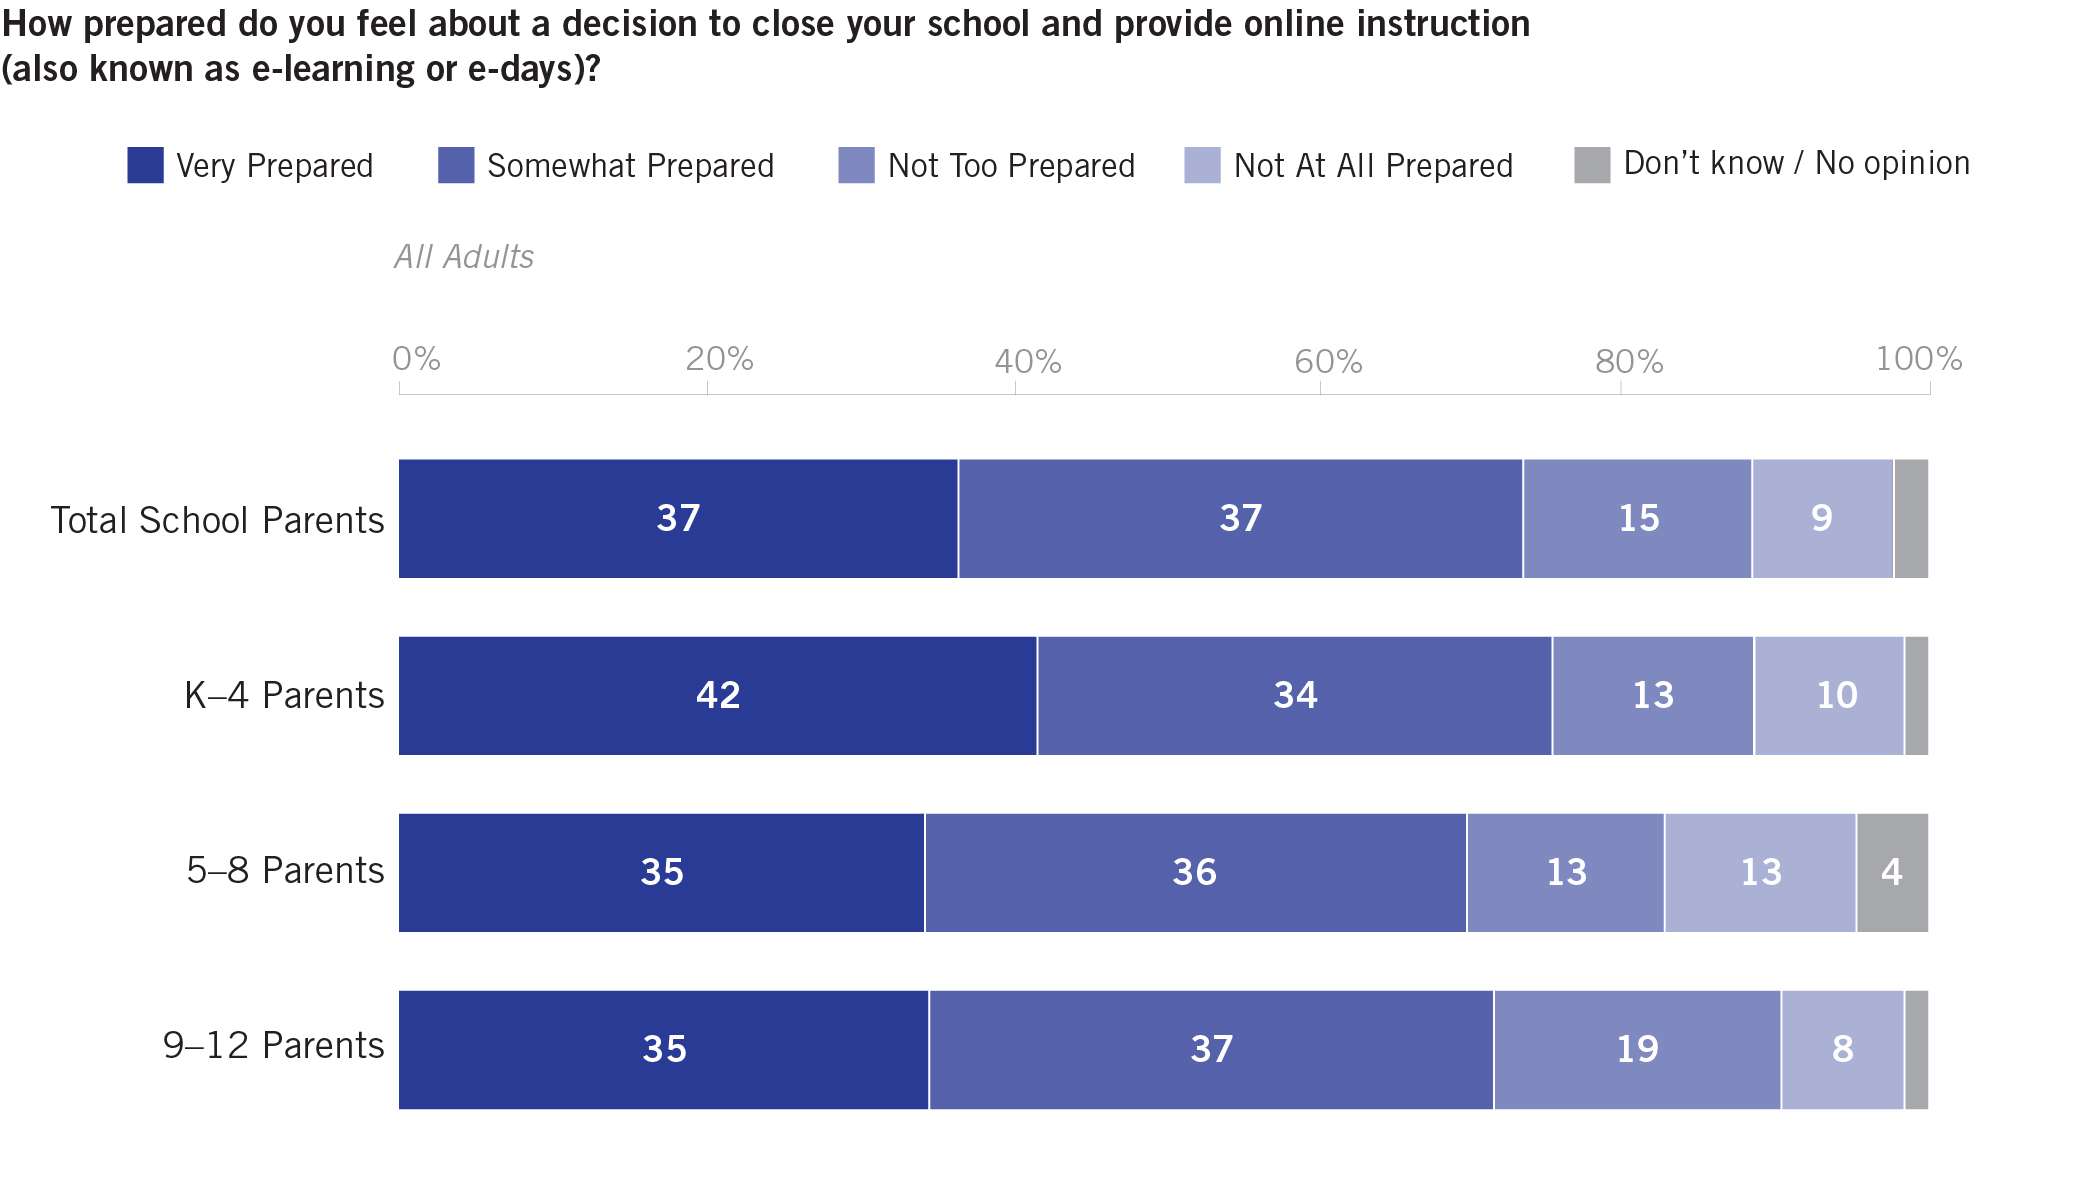
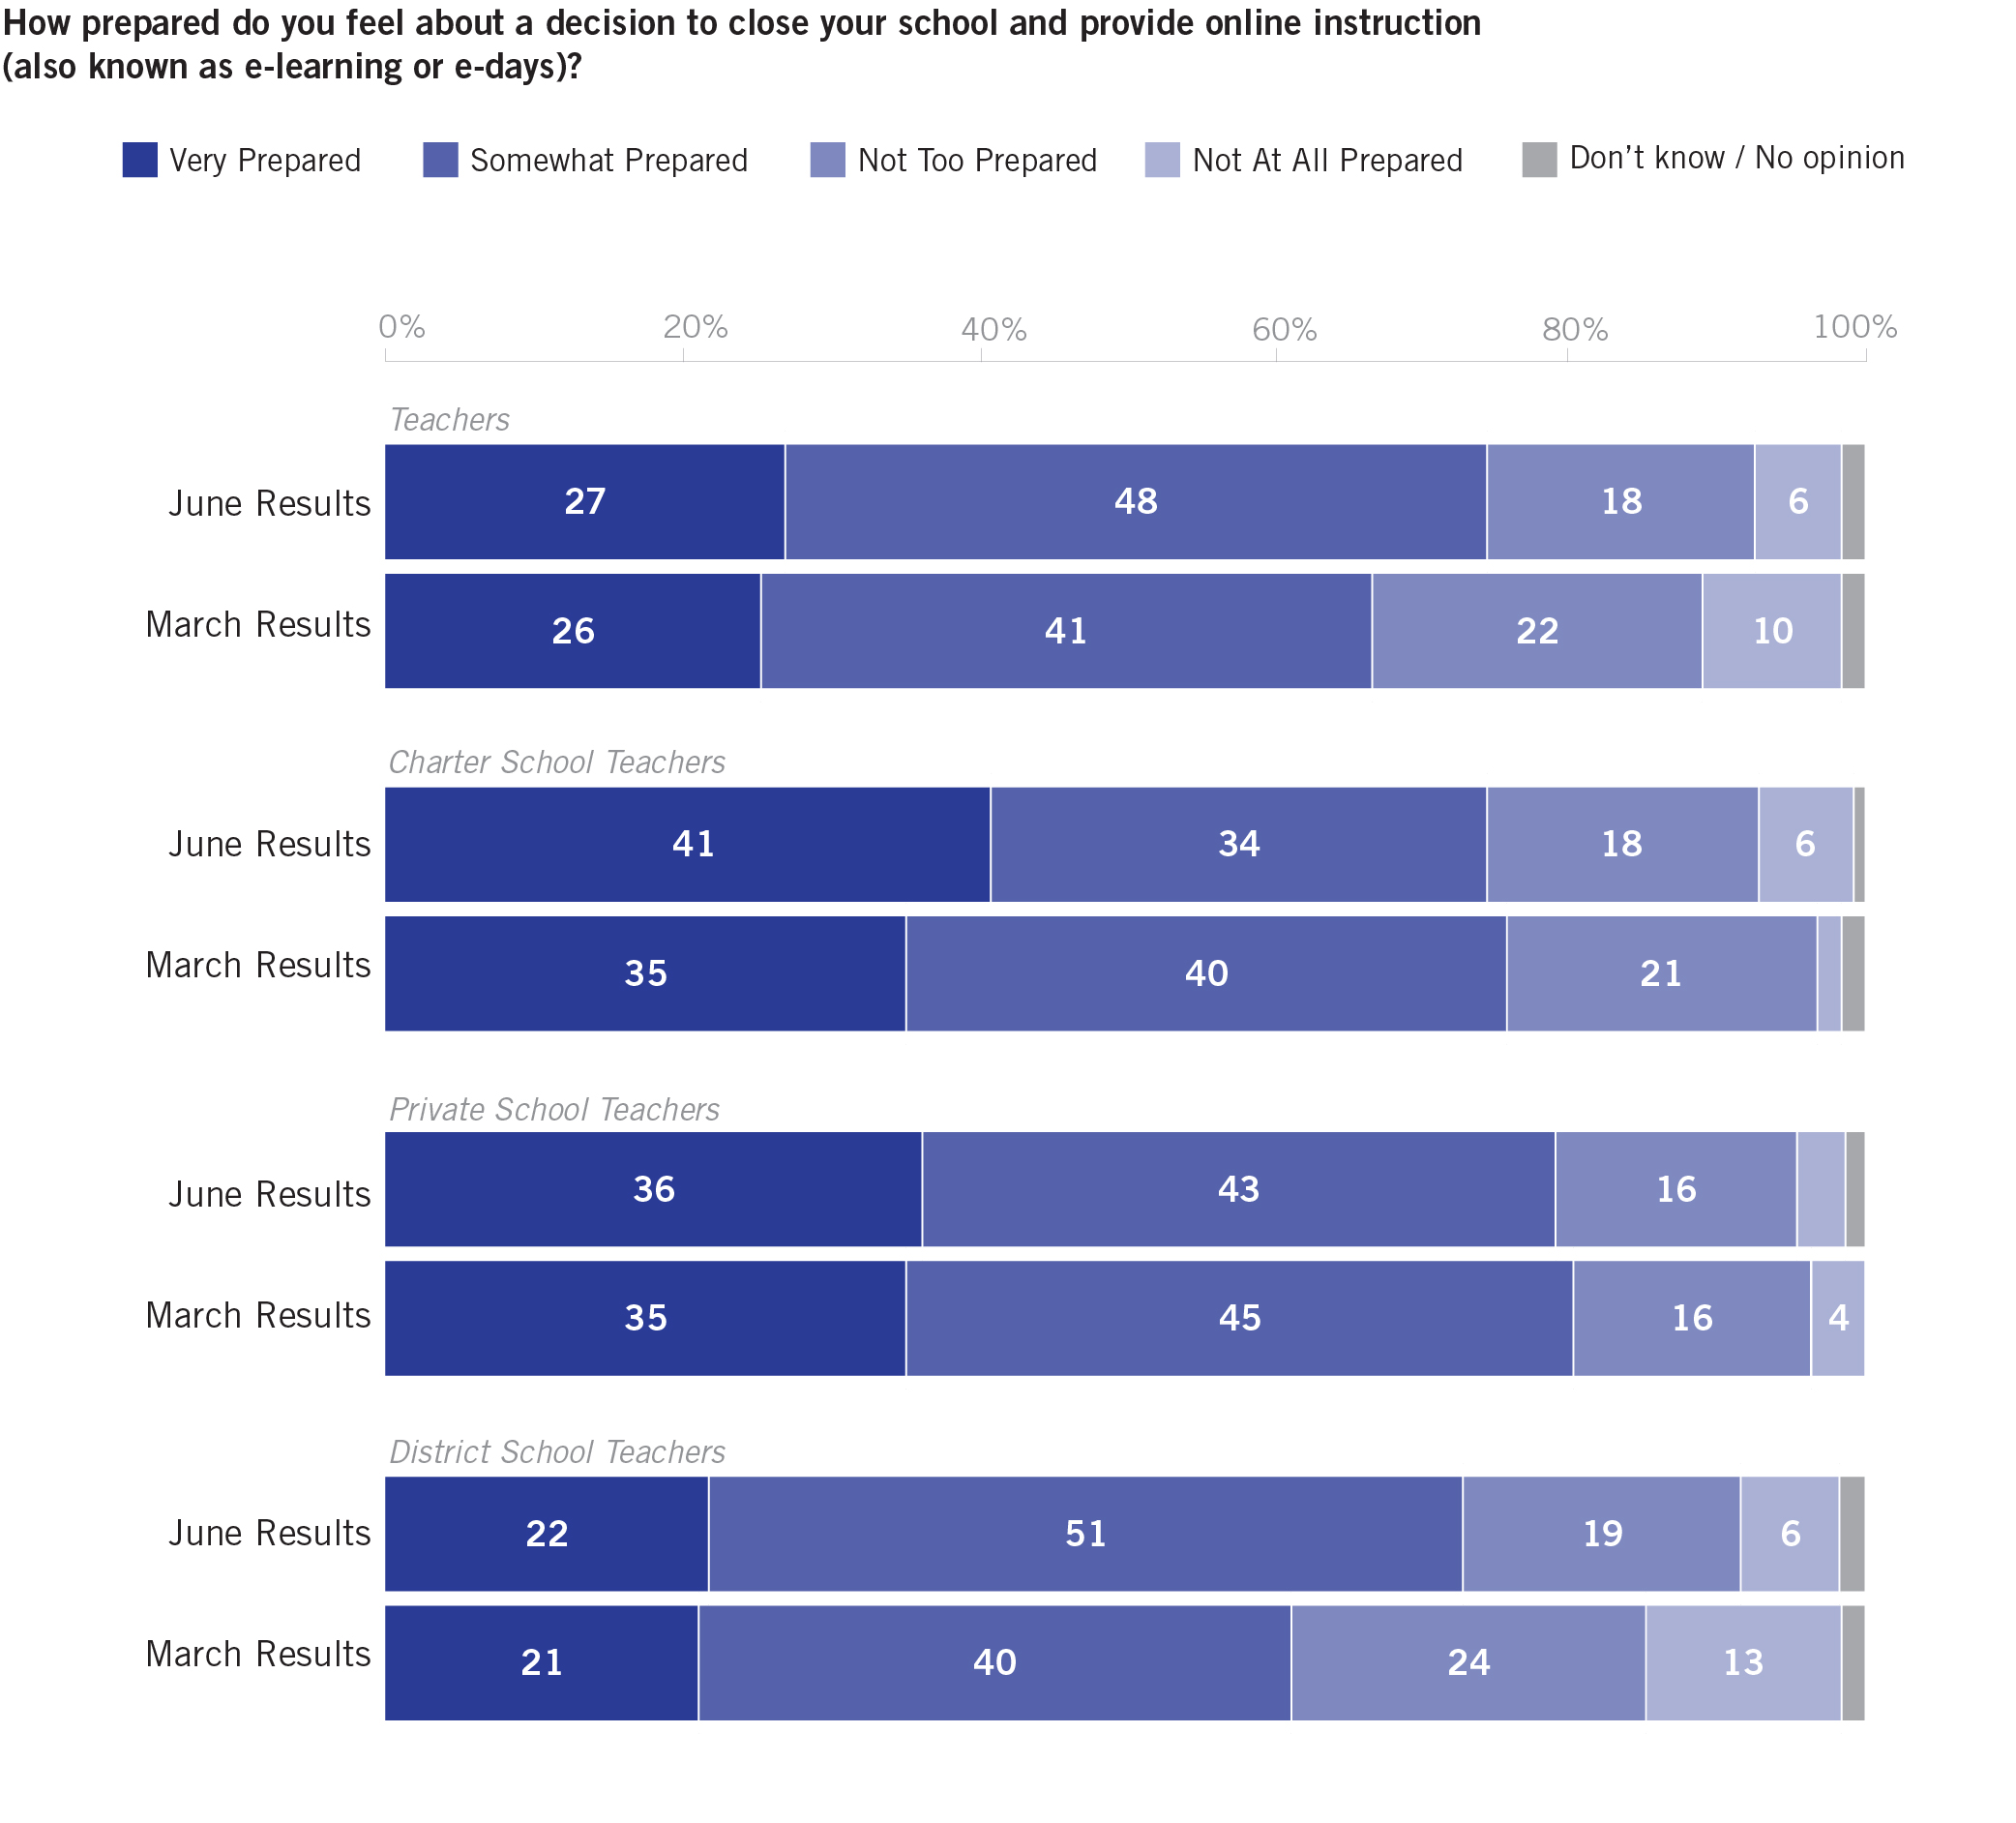
3. At the end of the school year parents were more likely than teachers to say they were feeling “very prepared” about the transition to distance/online learning. The parent-teacher gap on that specific response was 10 percentage points in June. More than seven out of 10 in either group felt at least somewhat prepared at the end of the school year, and these numbers changed very little since the school closures began in March. District school teachers (22%) were much less likely to say they felt “very prepared” compared to charter school teachers (41%) and private school teachers (36%).
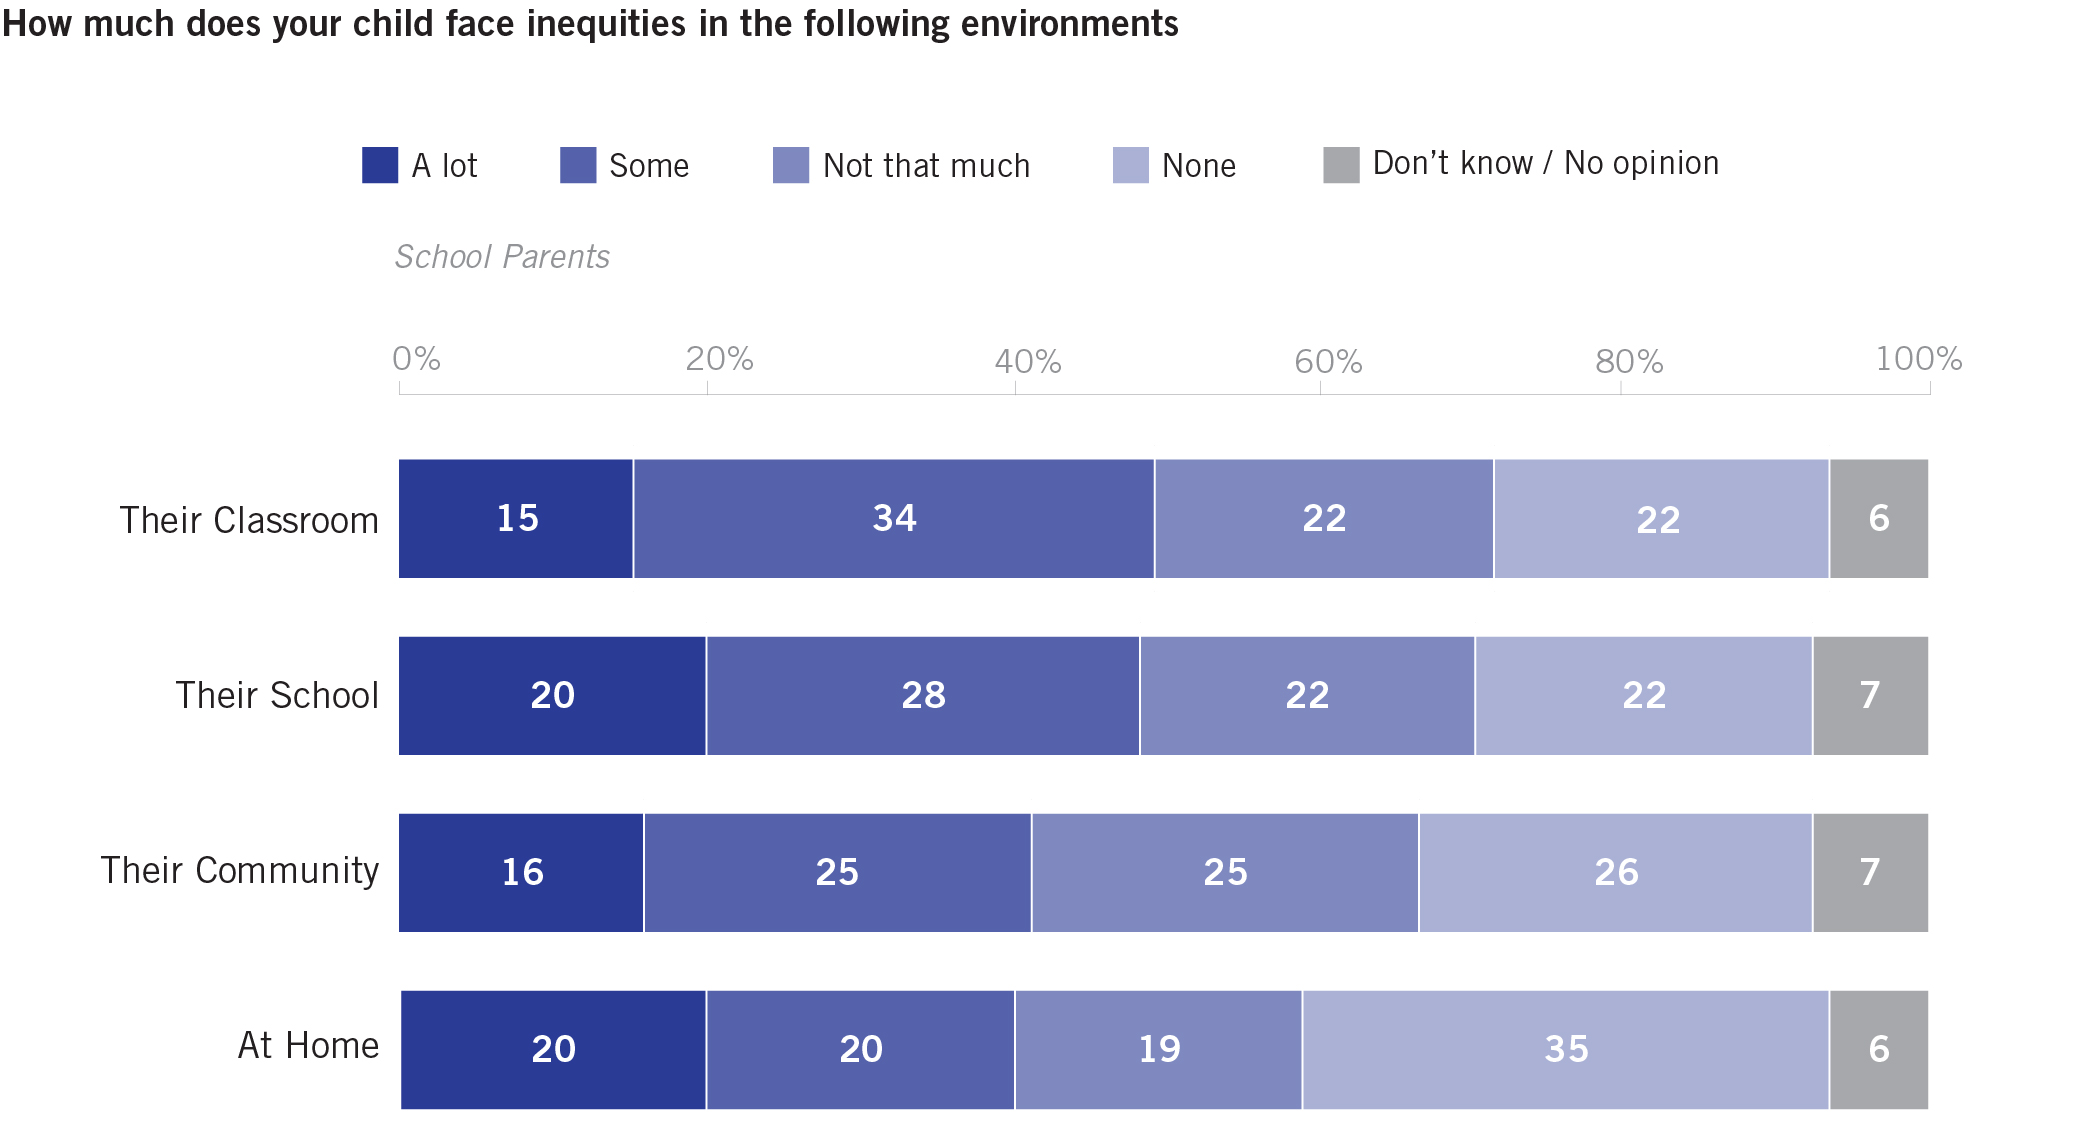
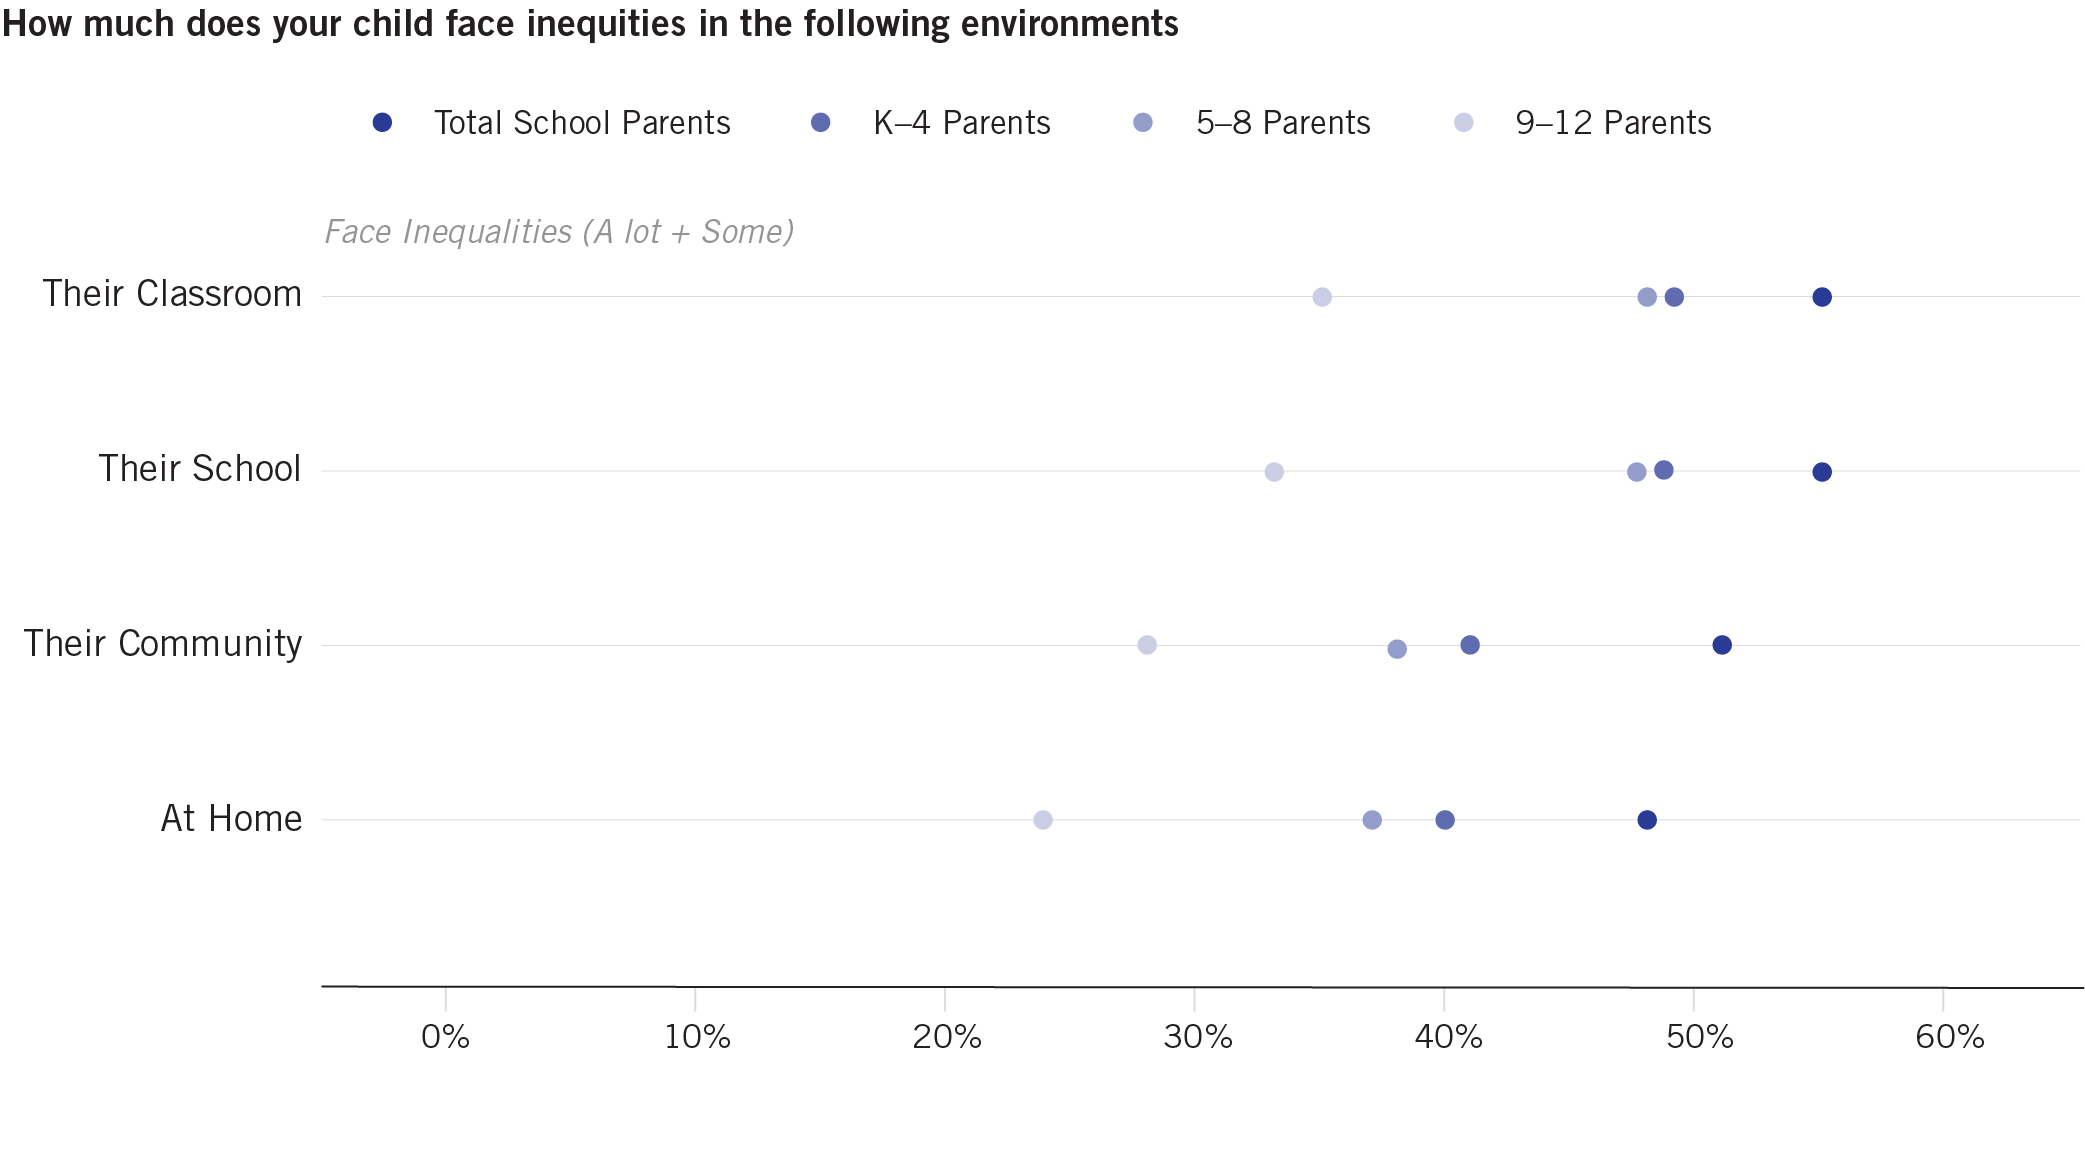
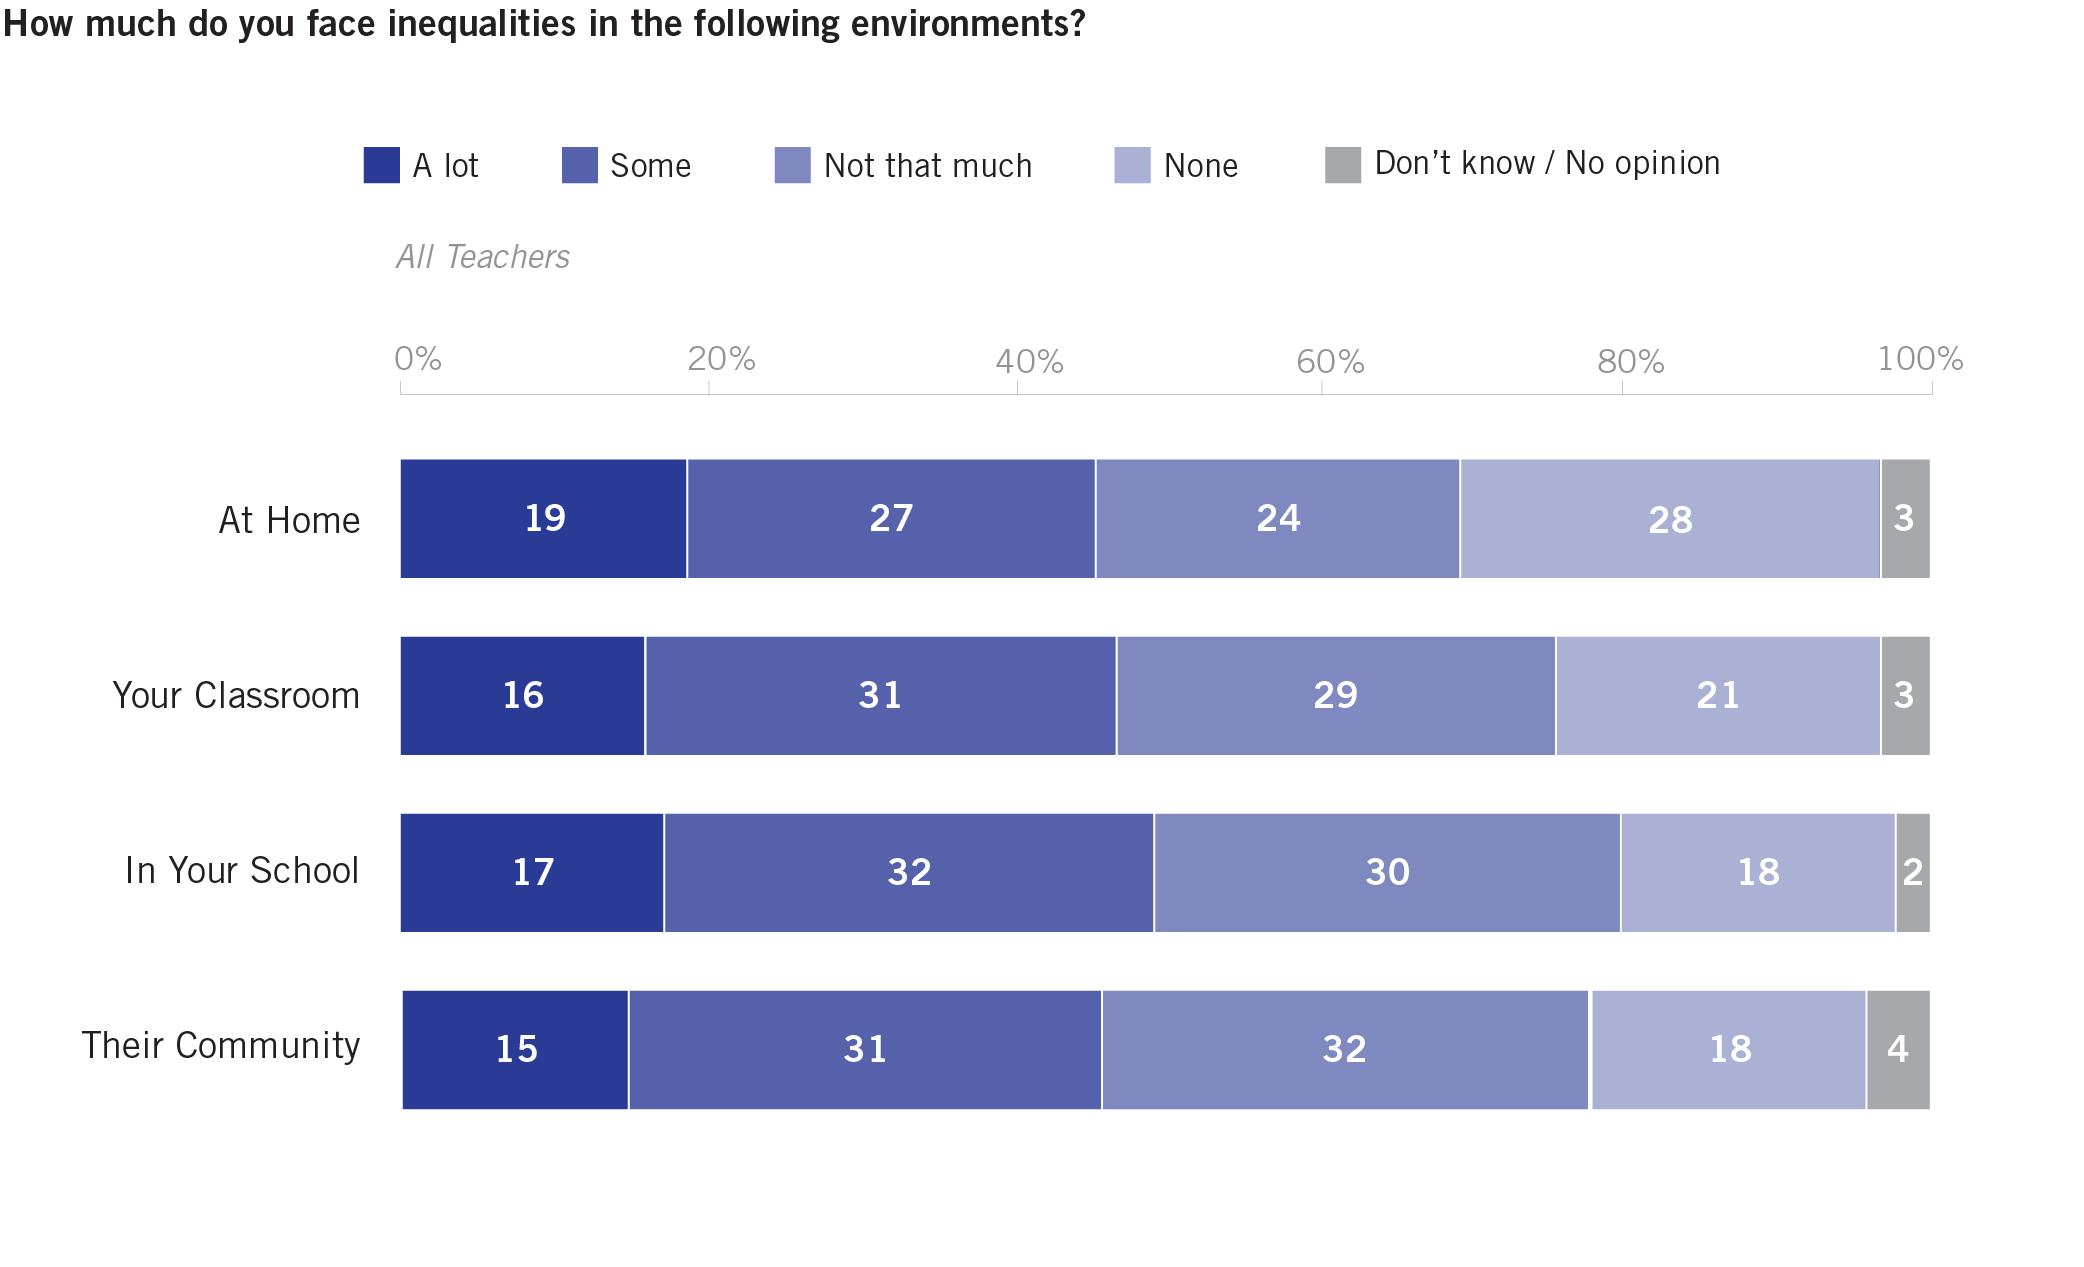
Protests flared up across the nation in June, speaking out against racial bias and police misconduct. In response to those public demonstrations and growing concerns, we added some questions to our survey to explore experiences and attitudes about inequities and racial bias in different environments.
4. At least 15-20 percent of parents and teachers say there are “a lot” of inequities that students and teachers face at home, in the classroom, at their school, and in their community. Parents of younger children (K–4) are much more likely to say their kids are facing at least some inequities across different environments than parents of high school children (9–12).
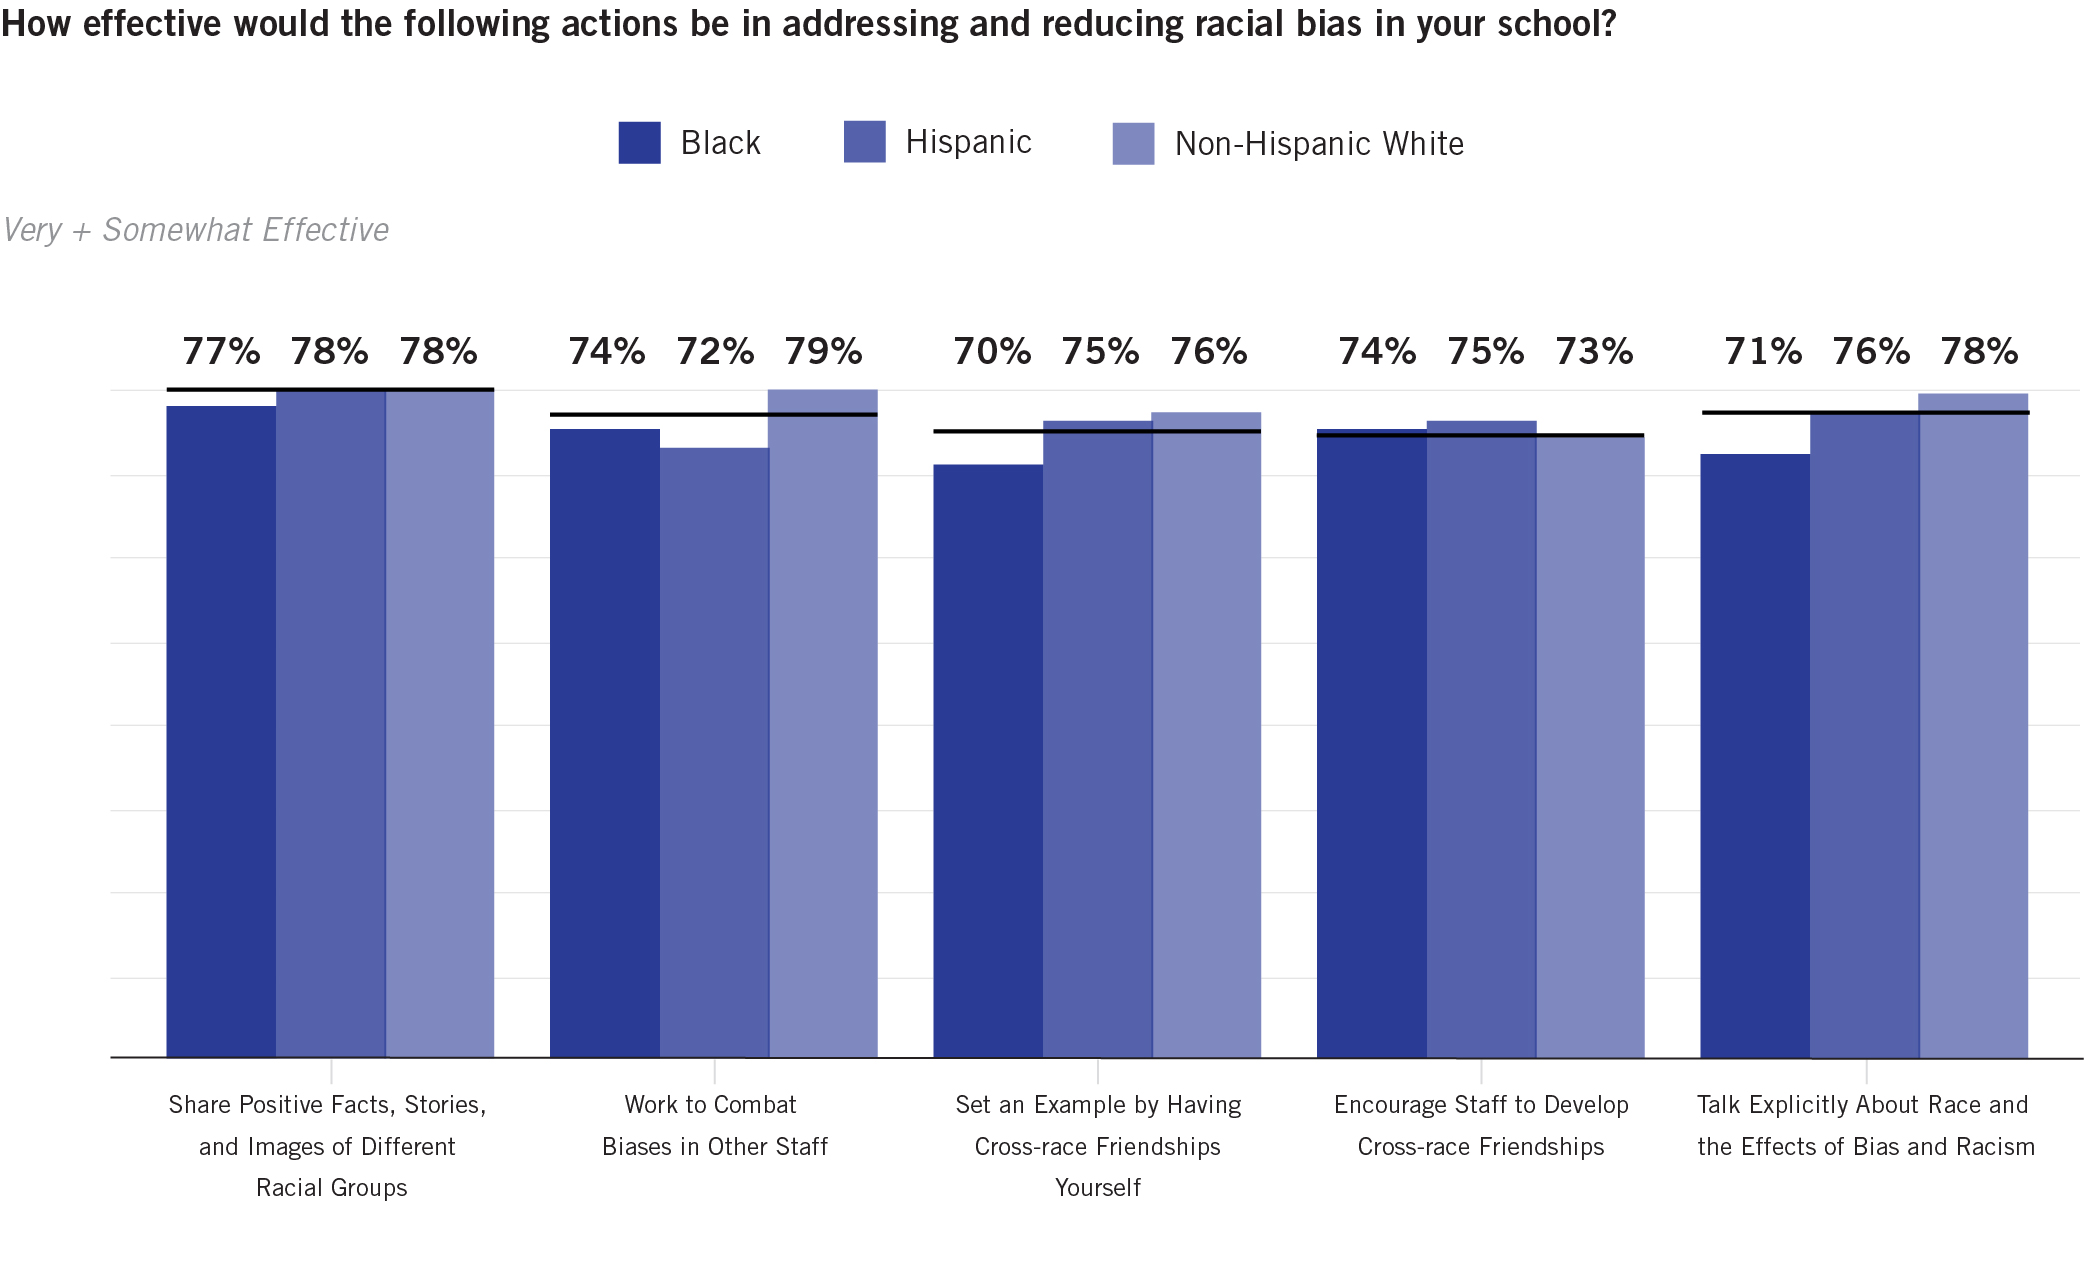
More than 70 percent of parents and teachers say that any one of five proposed remedies—sharing stories, talking about race, setting an example through cross-race friendships, working to combat biases and encouraging others to develop cross-race friendships—could be at least somewhat effective combating racial bias in schools.
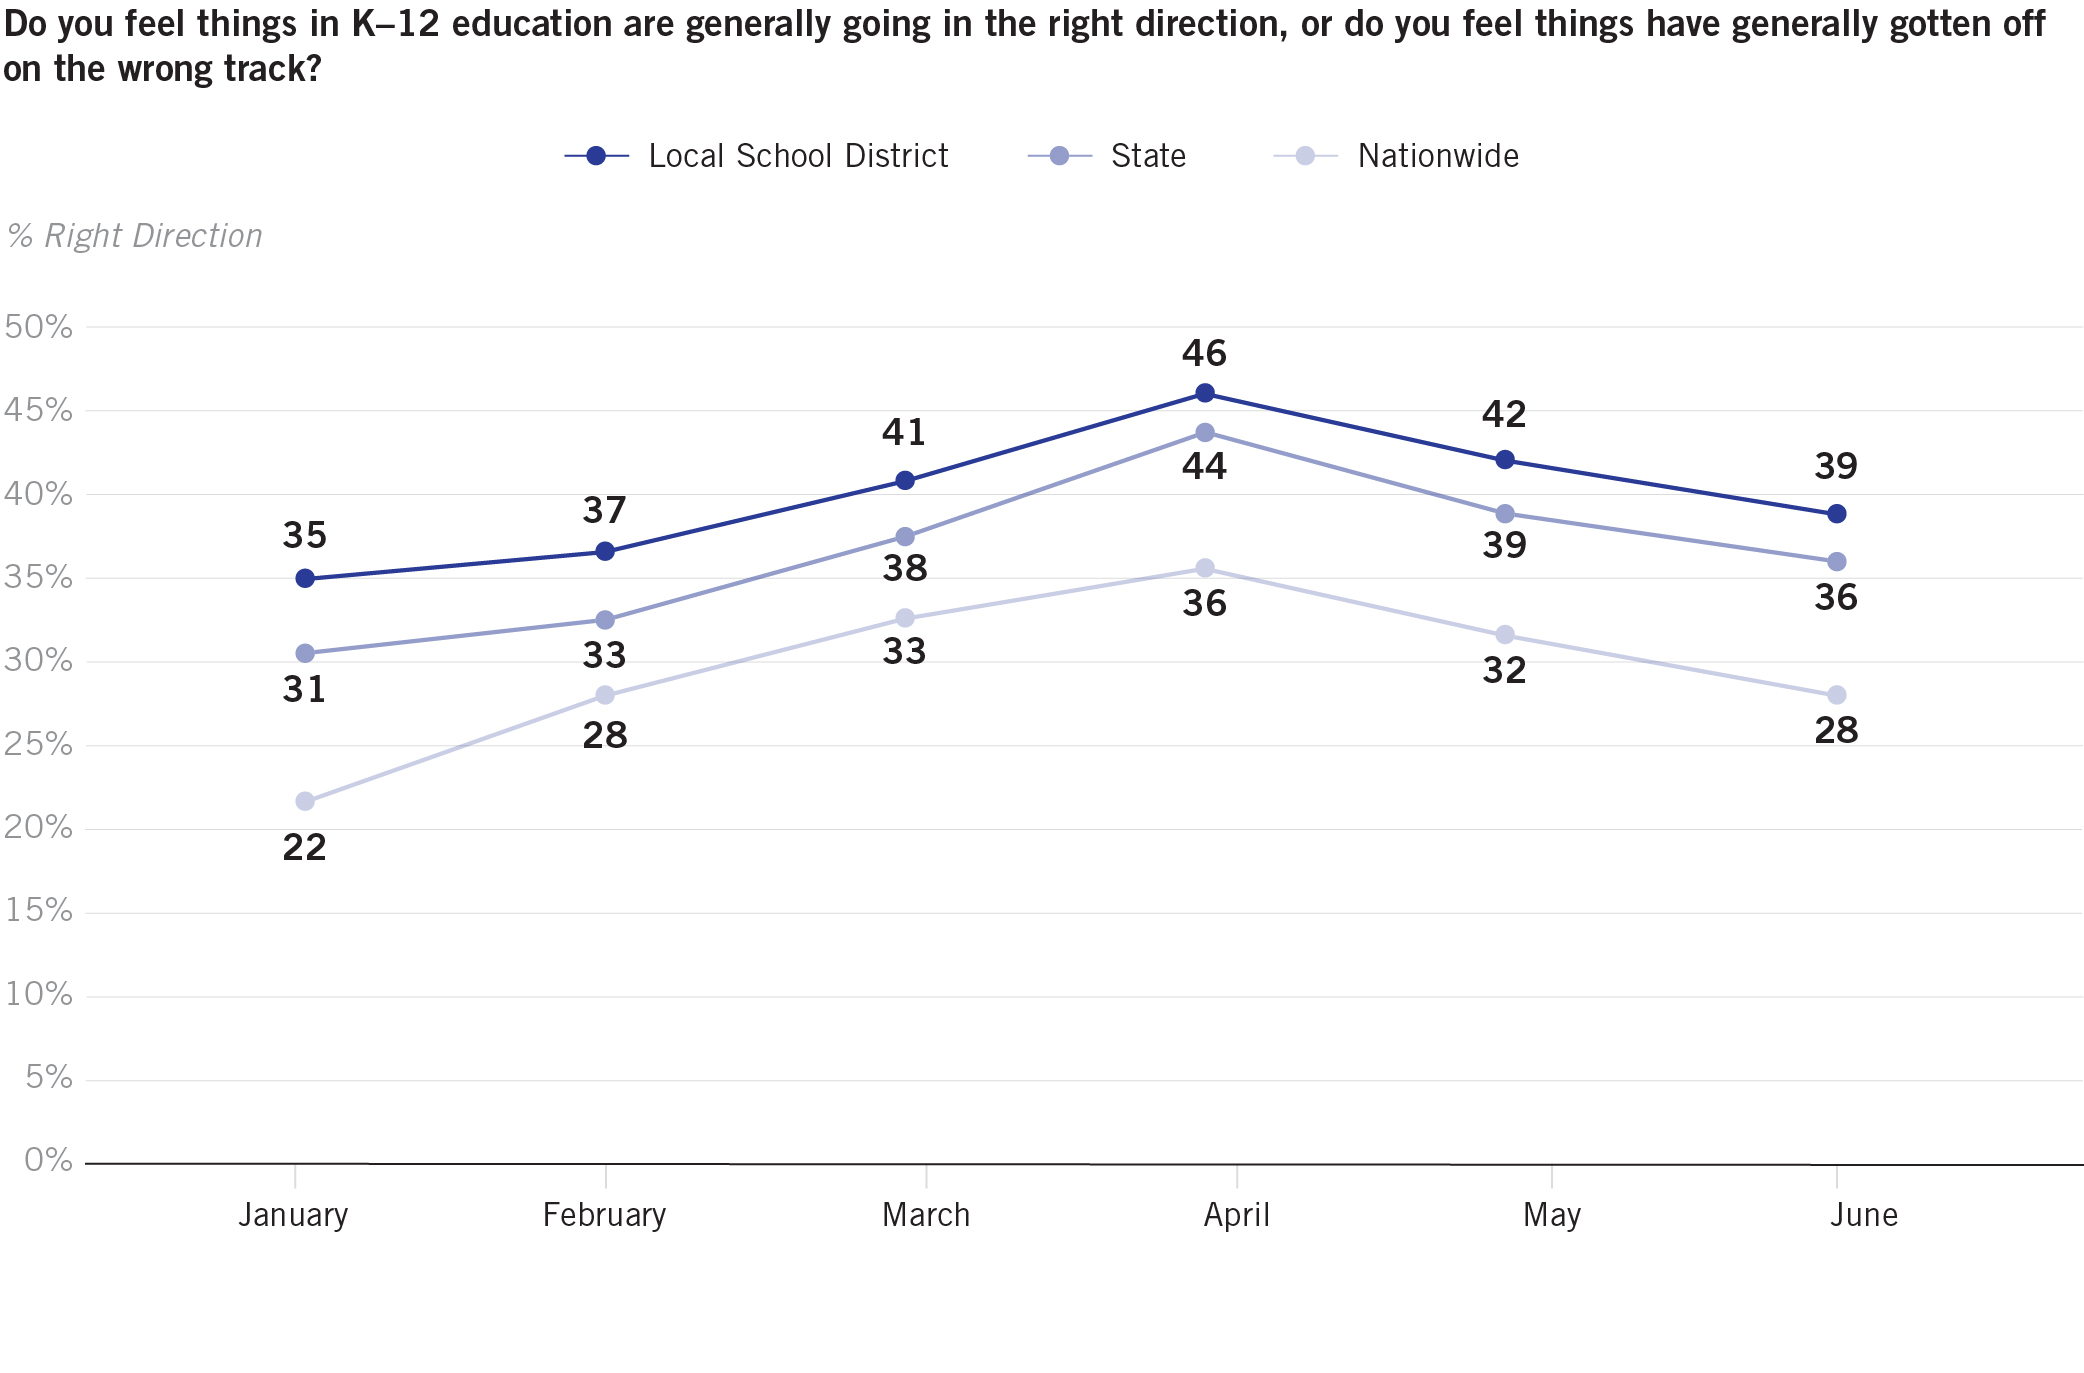
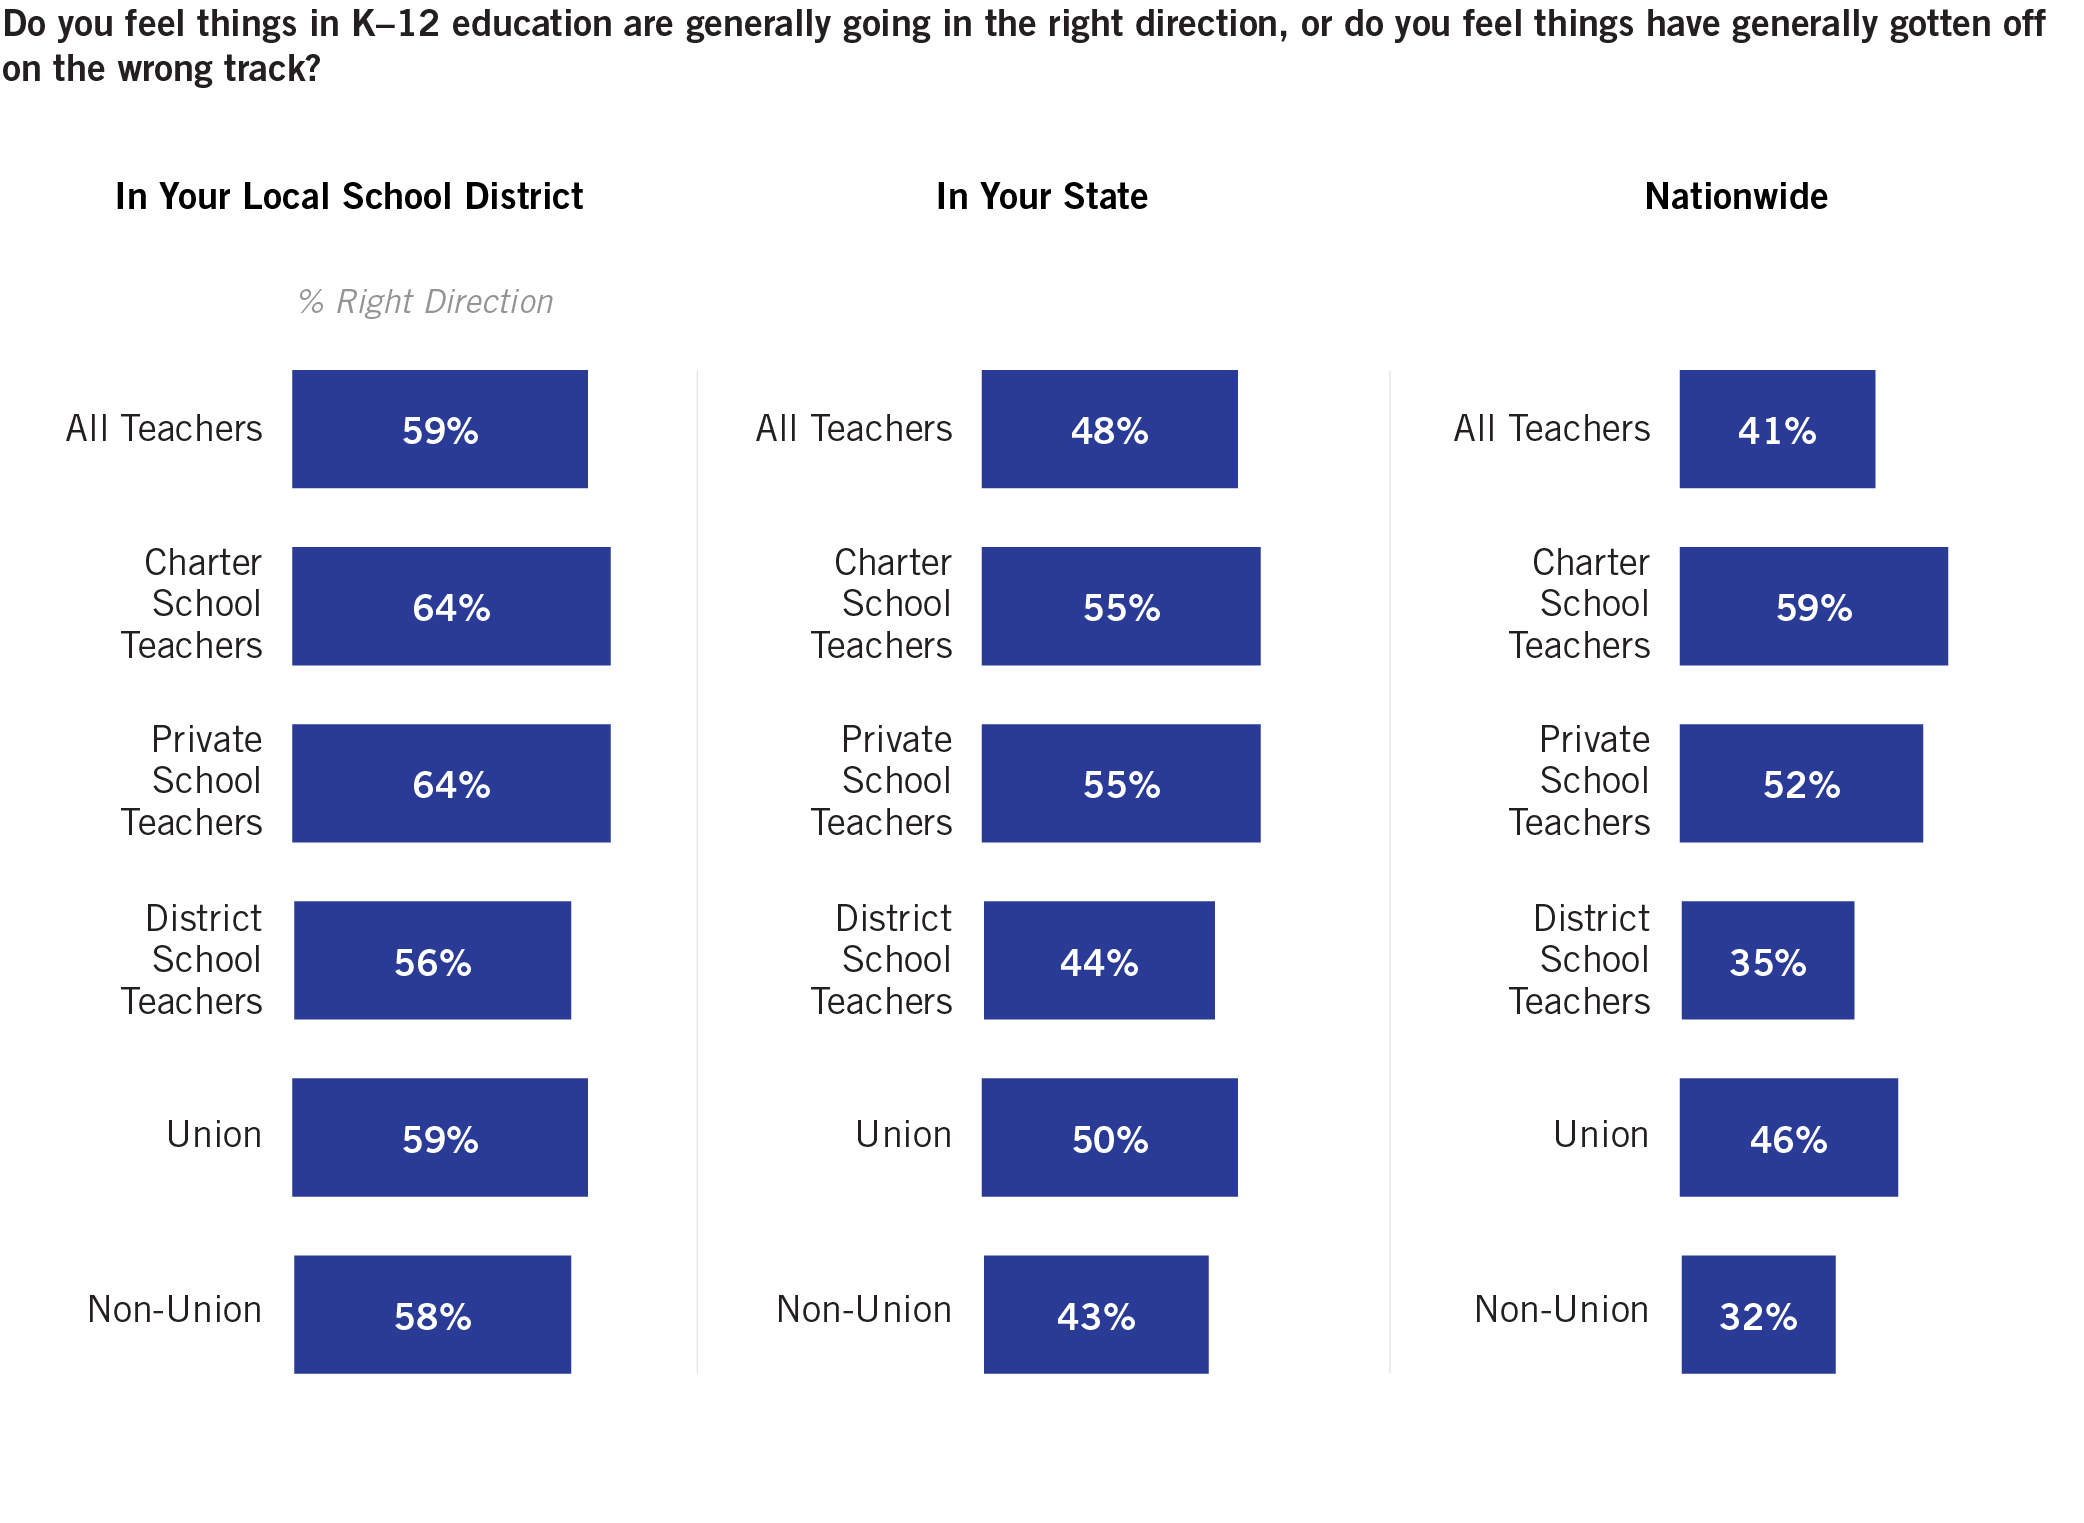
5. Since April, Americans are increasingly less optimistic about K–12 education, and at all levels of governance. Teachers’ views are the same as they were in March. The general public’s positive sentiment has decreased by about 8 percentage points since April. It is looking more and more like there was a “rallying around the schools” atmosphere at that time, when the pandemic was causing school closures. When asking about a forecast for K–12 education with “national” or “state” framing, there are clear differences among educators based on where they teach: charter school and private school teachers tend to be more optimistic than district school teachers. Belonging to a union also appears to be tied to a more positive response when considering national developments.
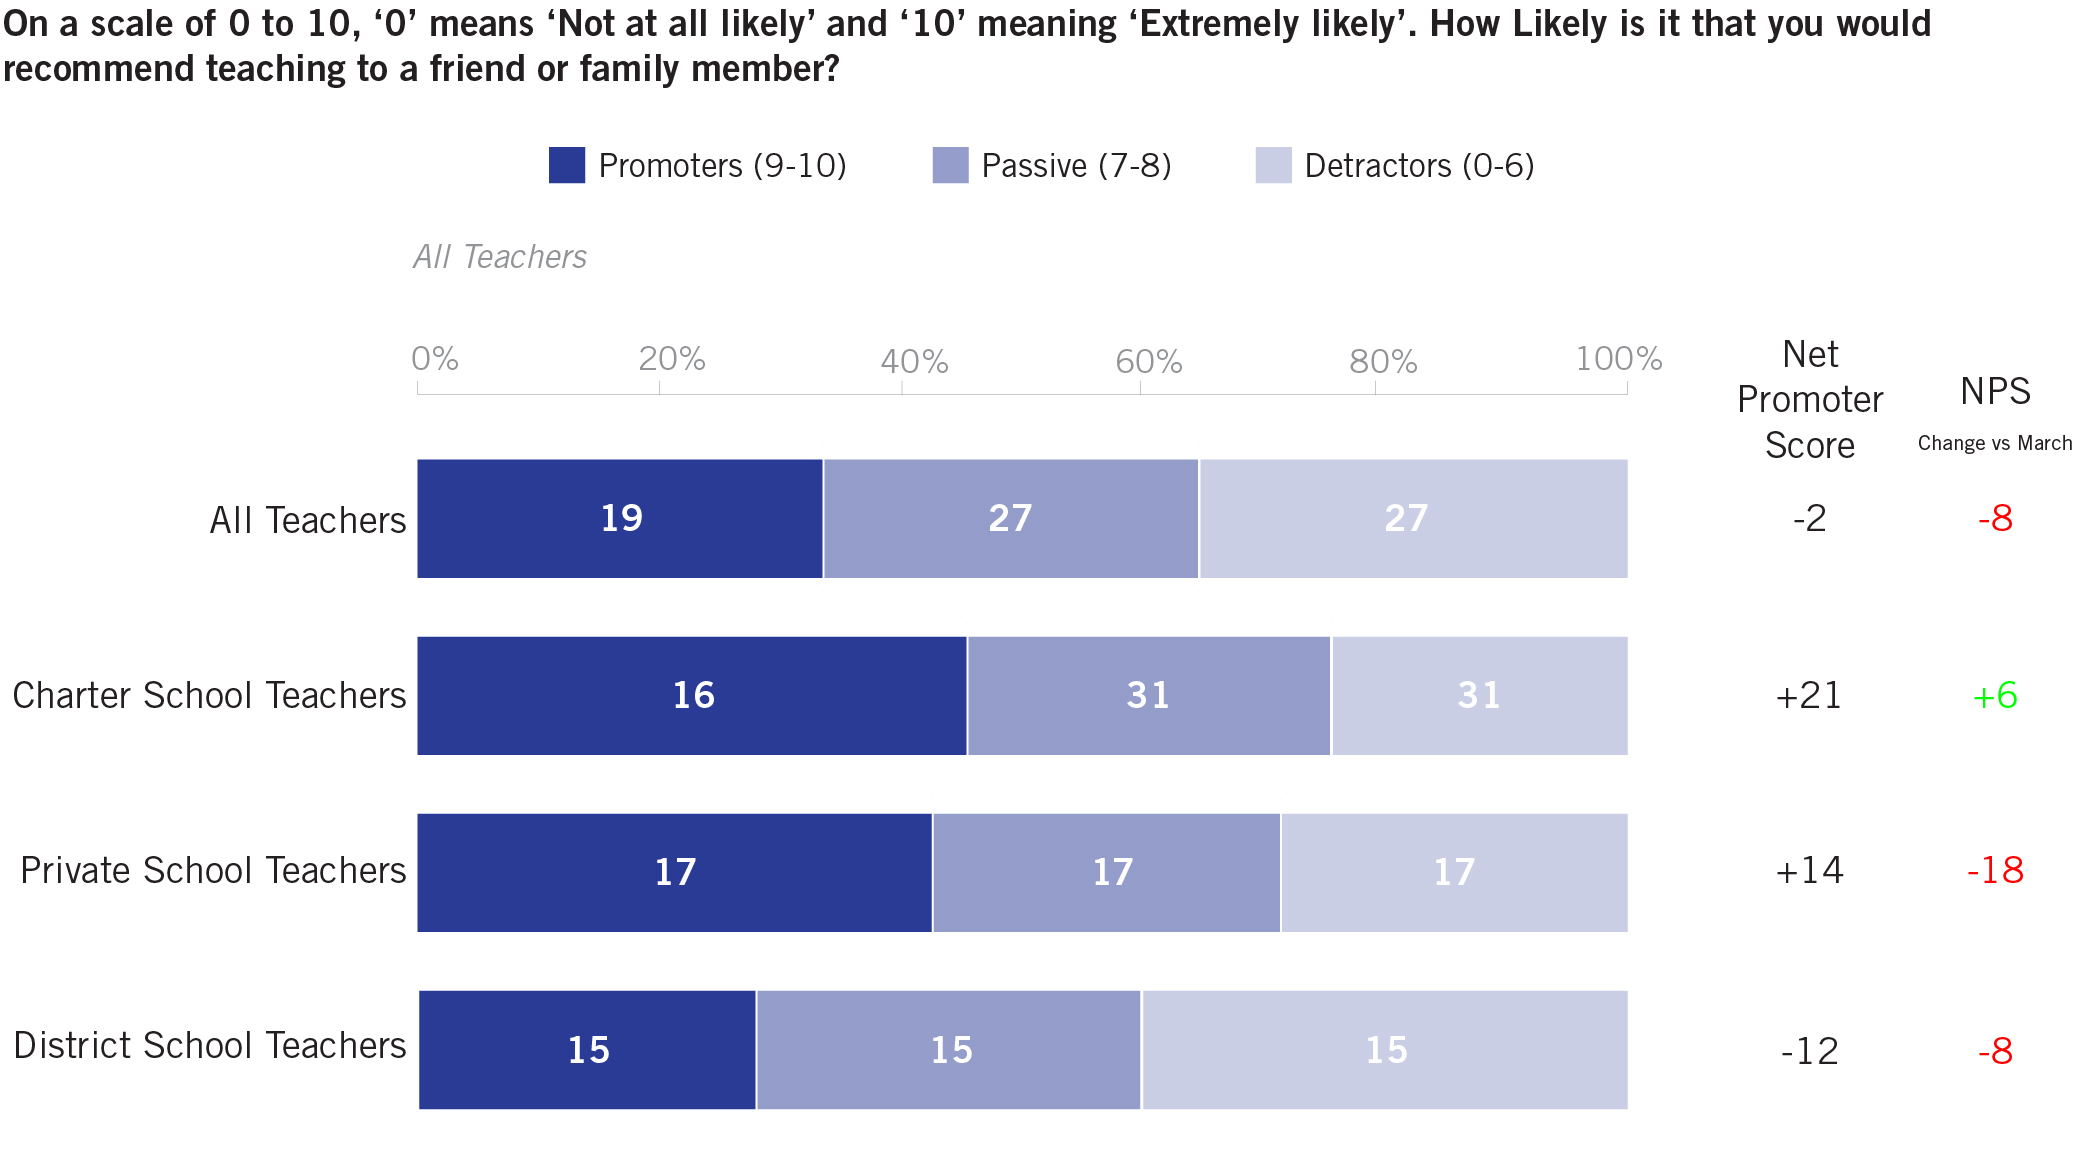
6. Charter school and private school teachers are much more likely to be promoters of the profession than district school teachers. Though we did see a significant dip in private school teachers’ Net Promoter Score (NPS), declining by 18 points since March. The NPS for the other two sectors didn’t change nearly as much: up 6 points among charter teachers; down 8 points among district teachers.
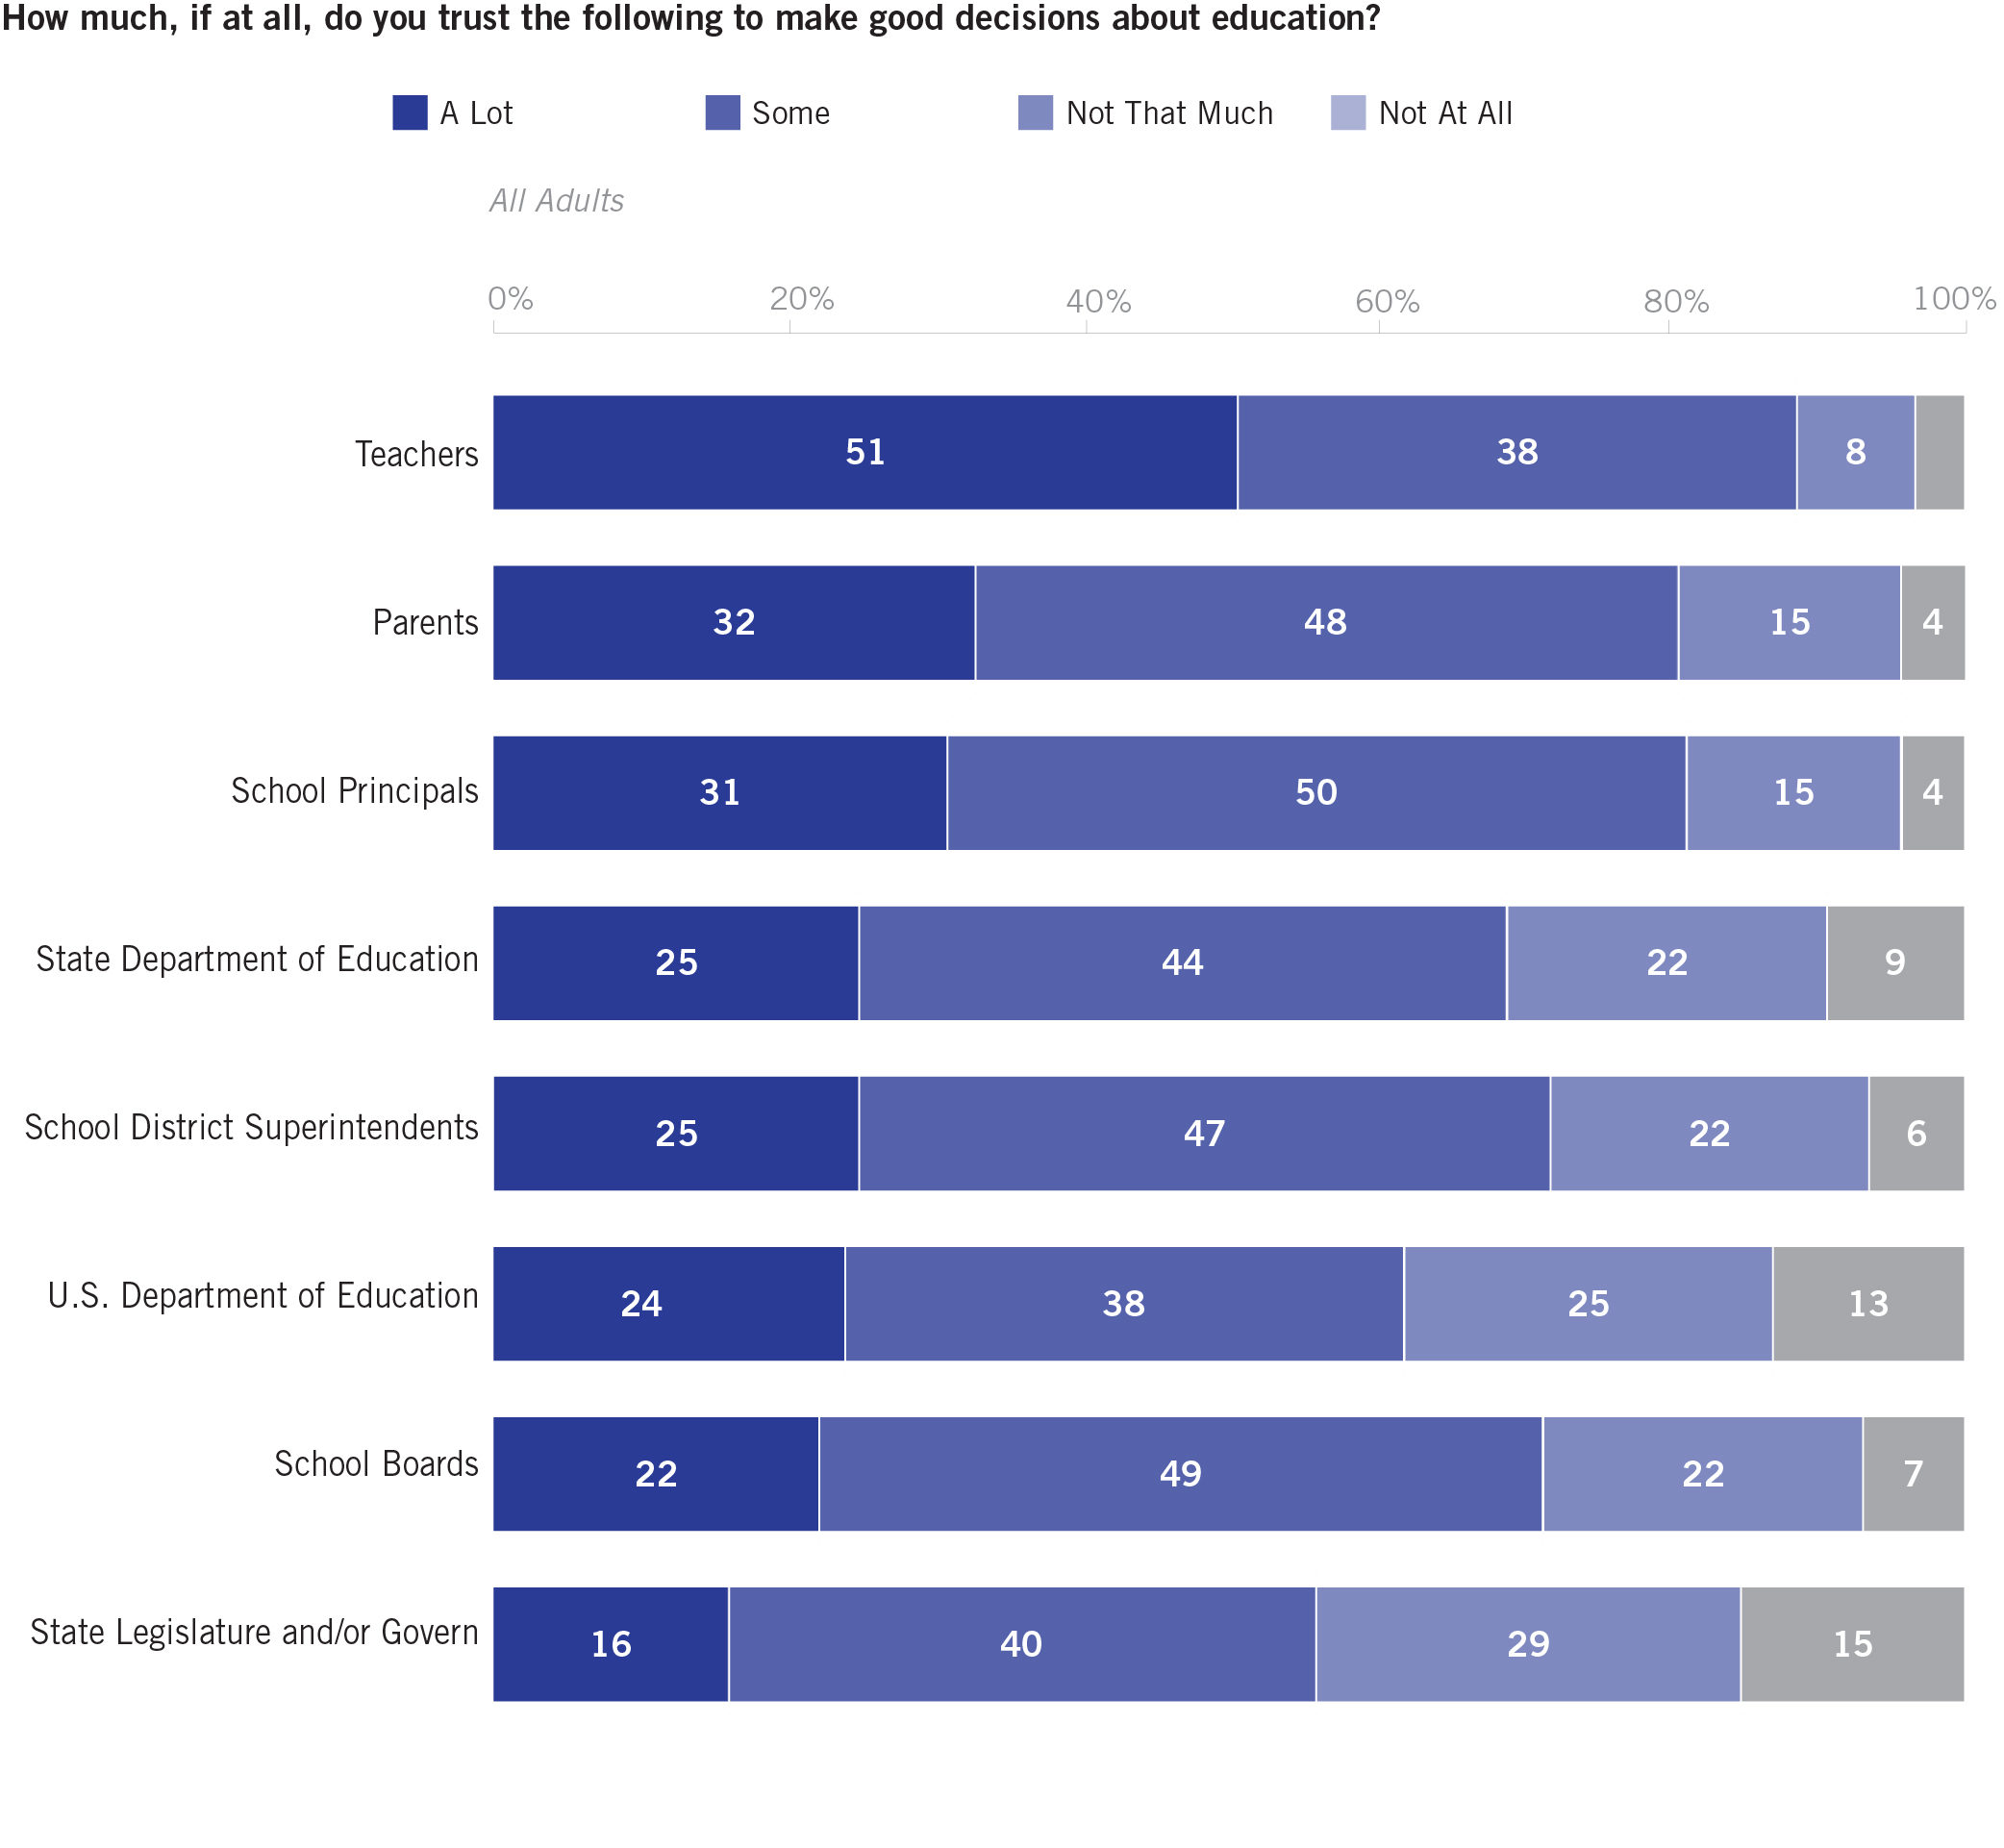
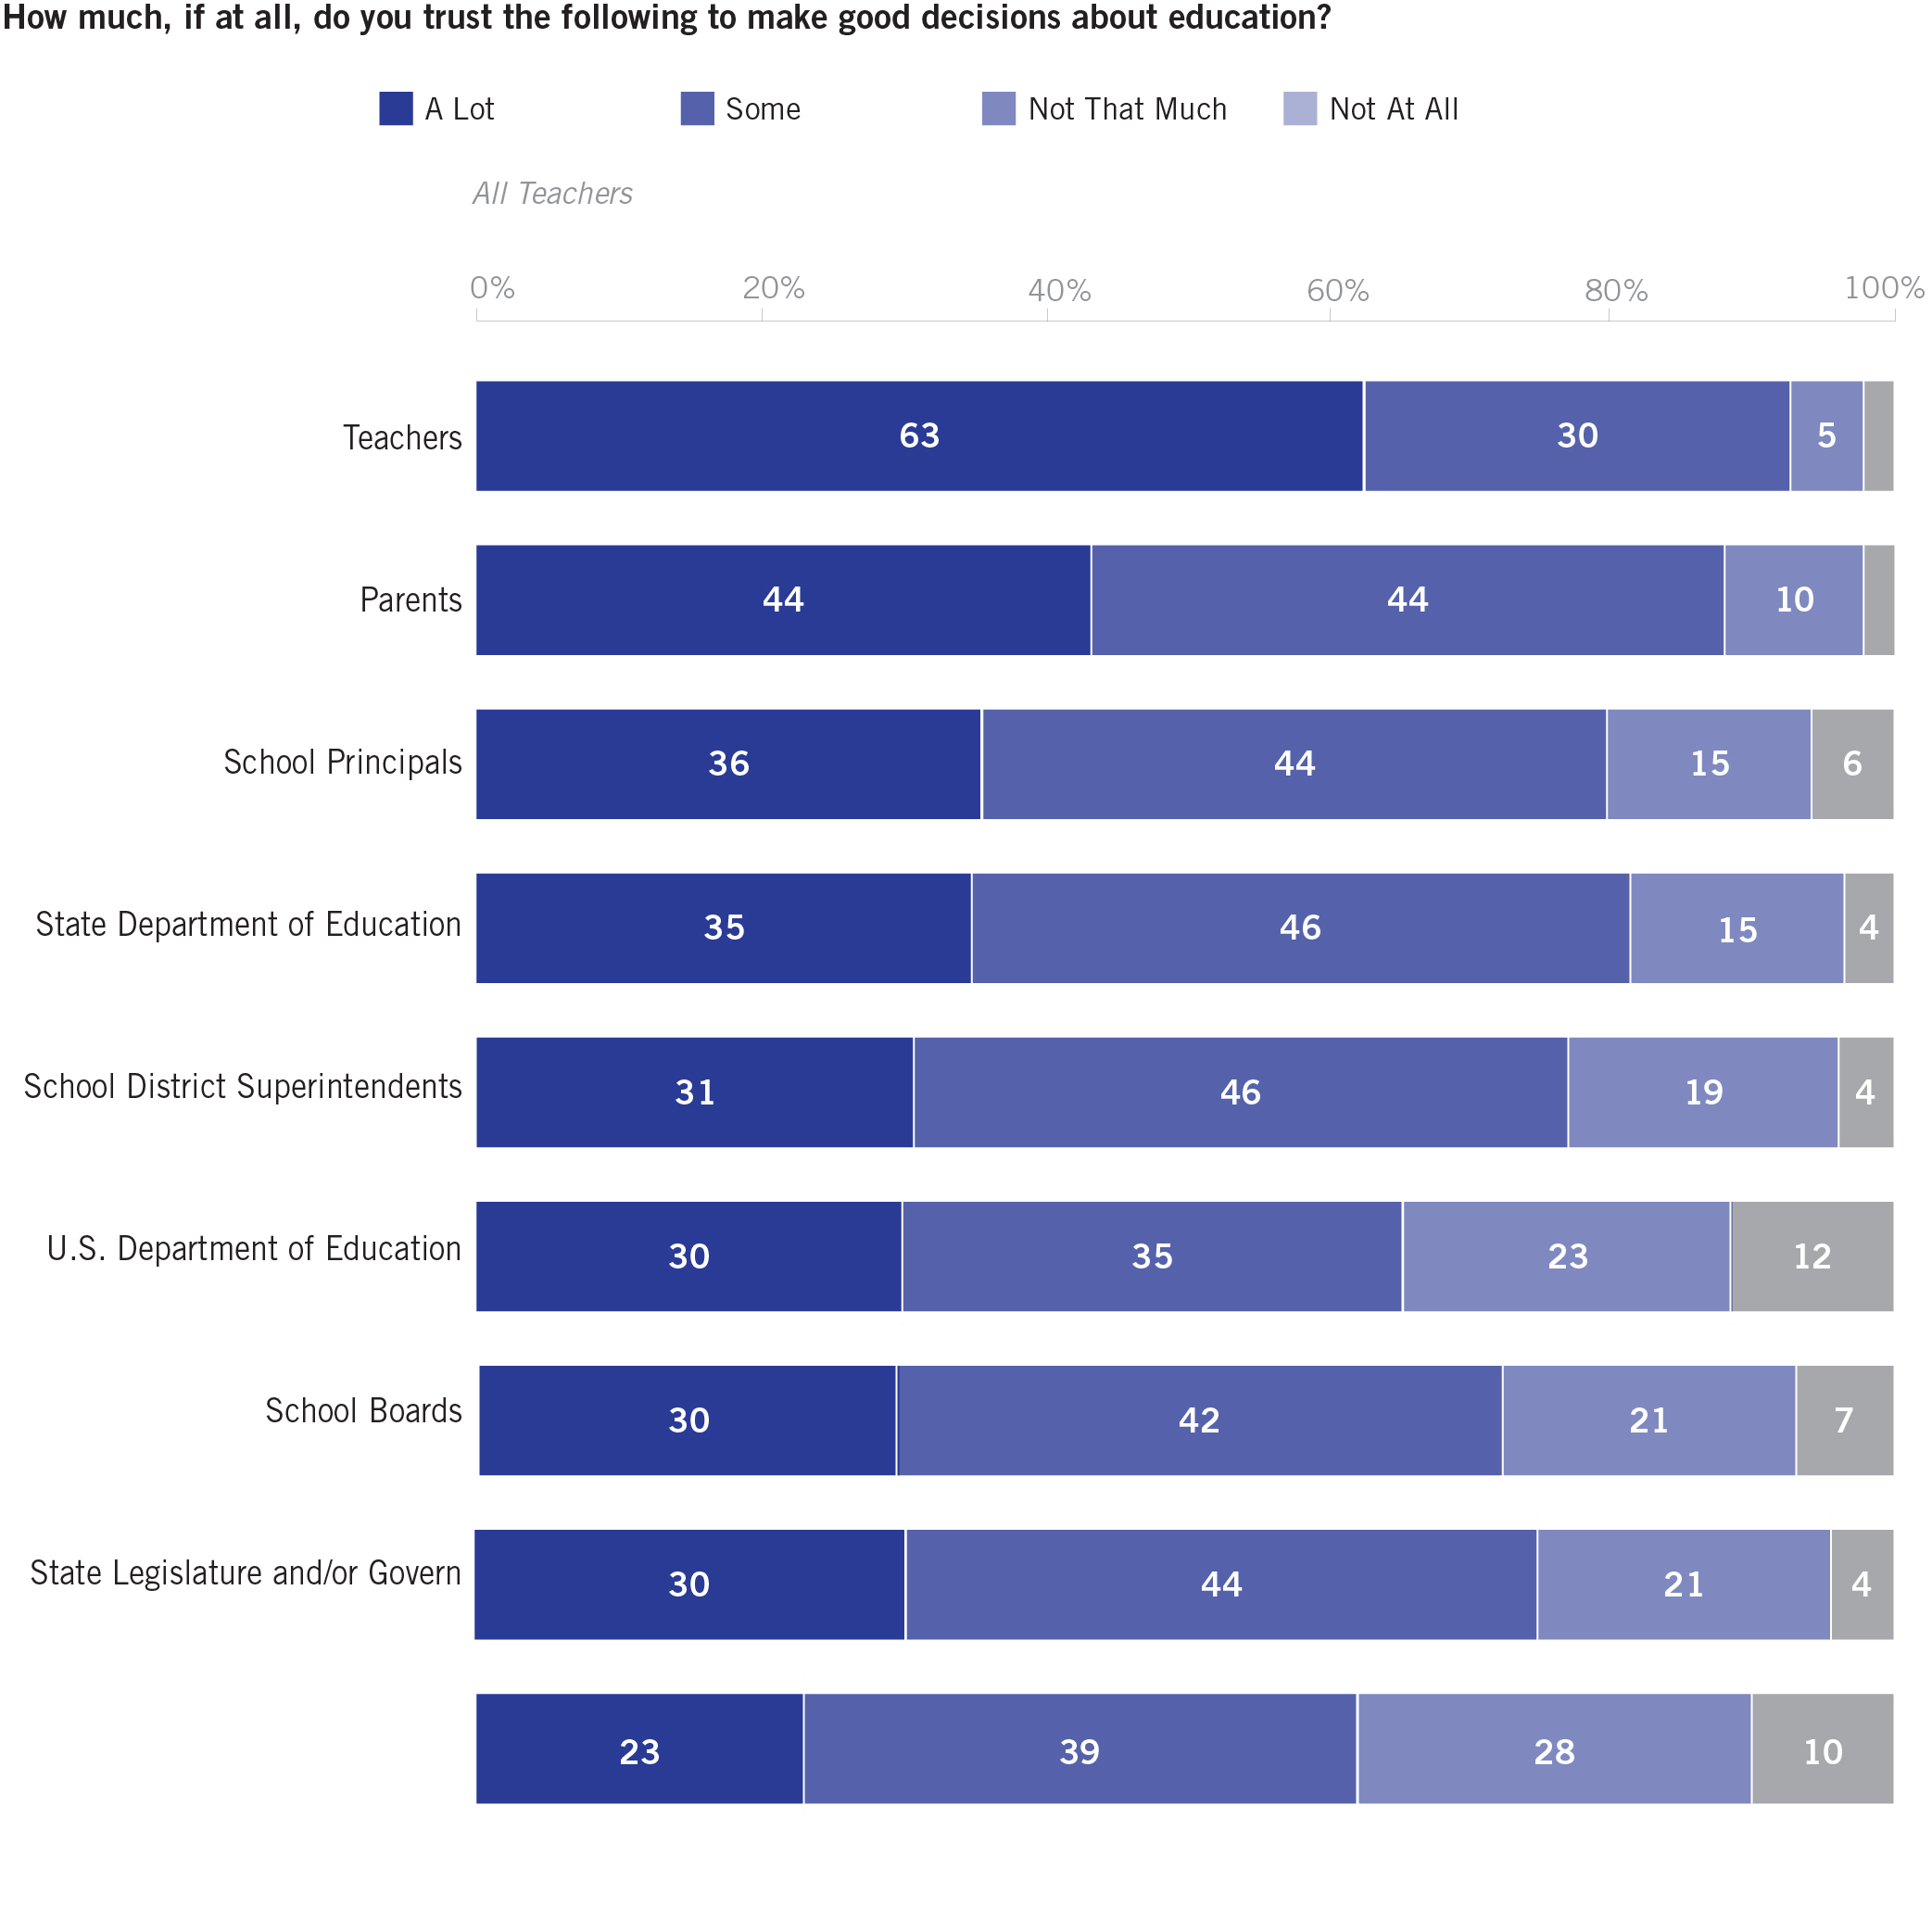
7. Who is most trusted to make good decisions about education? Far and away, educators are deemed most trustworthy. And generally speaking, the state legislature or governor are least trustworthy. Teachers tend to be more trusting of school principals, superintendents, and school boards compared to the general public. Teachers generally are more trusting (proportions saying “a lot of trust”) of education decision-makers than other Americans.
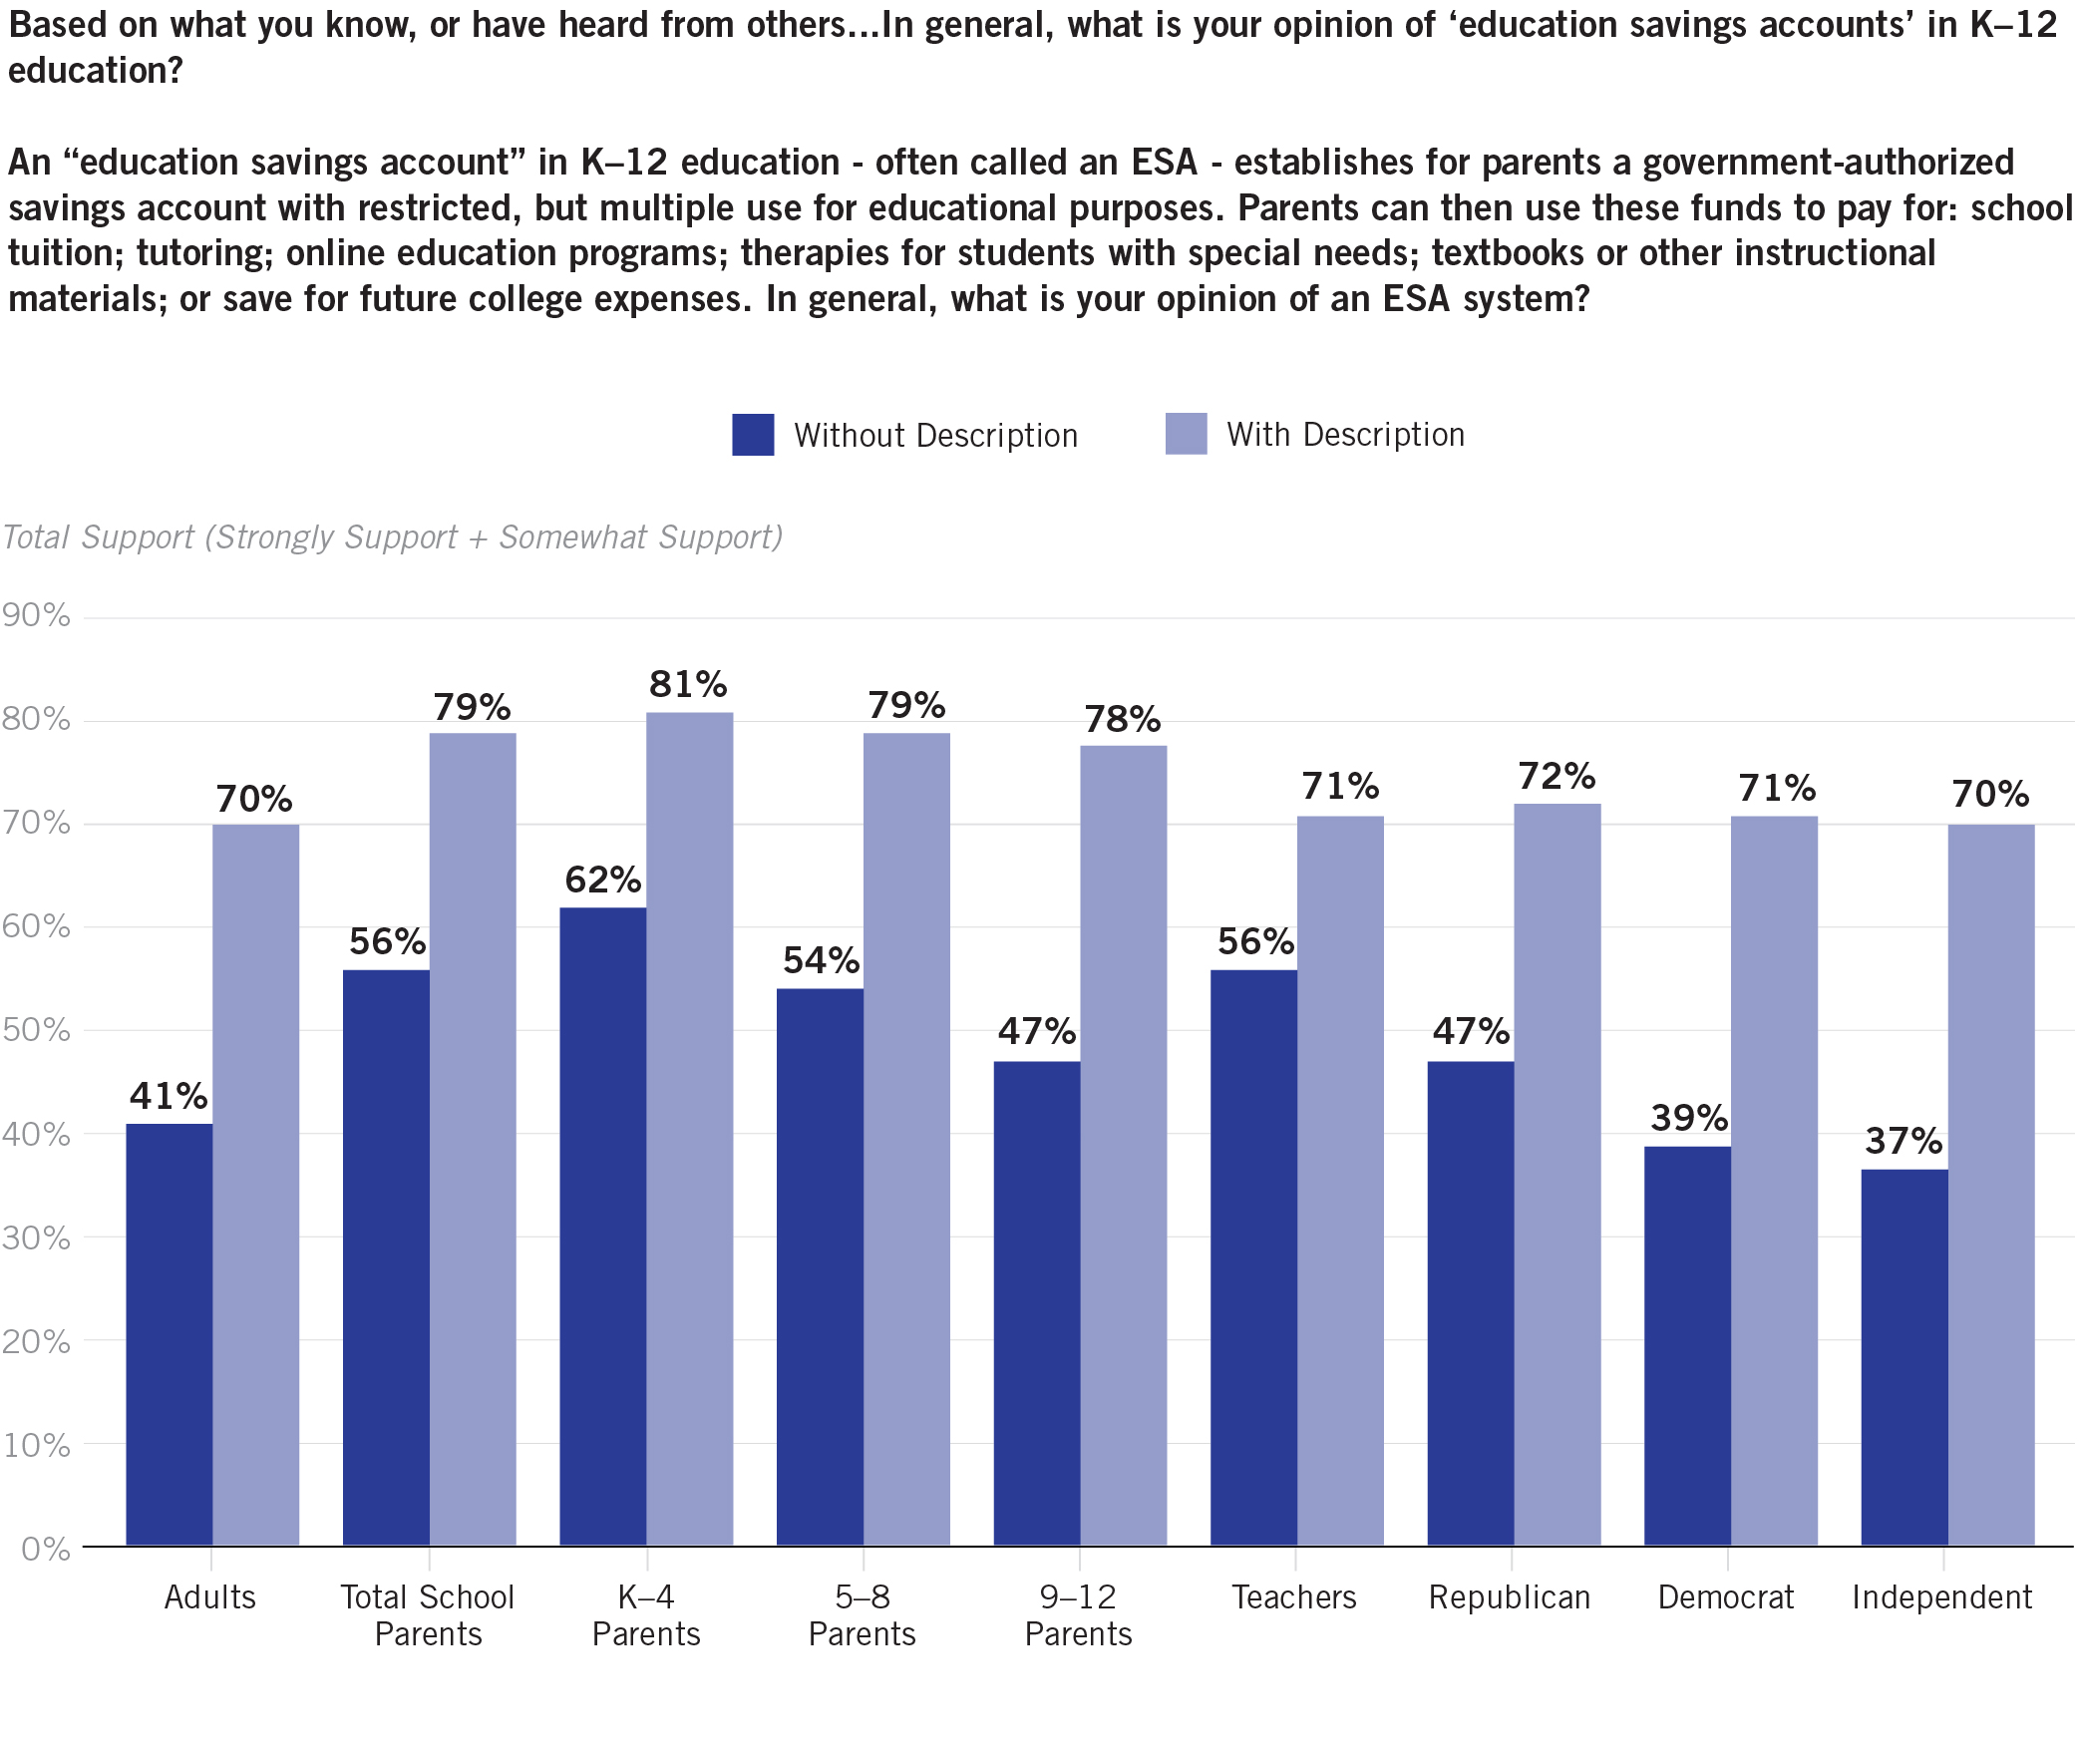
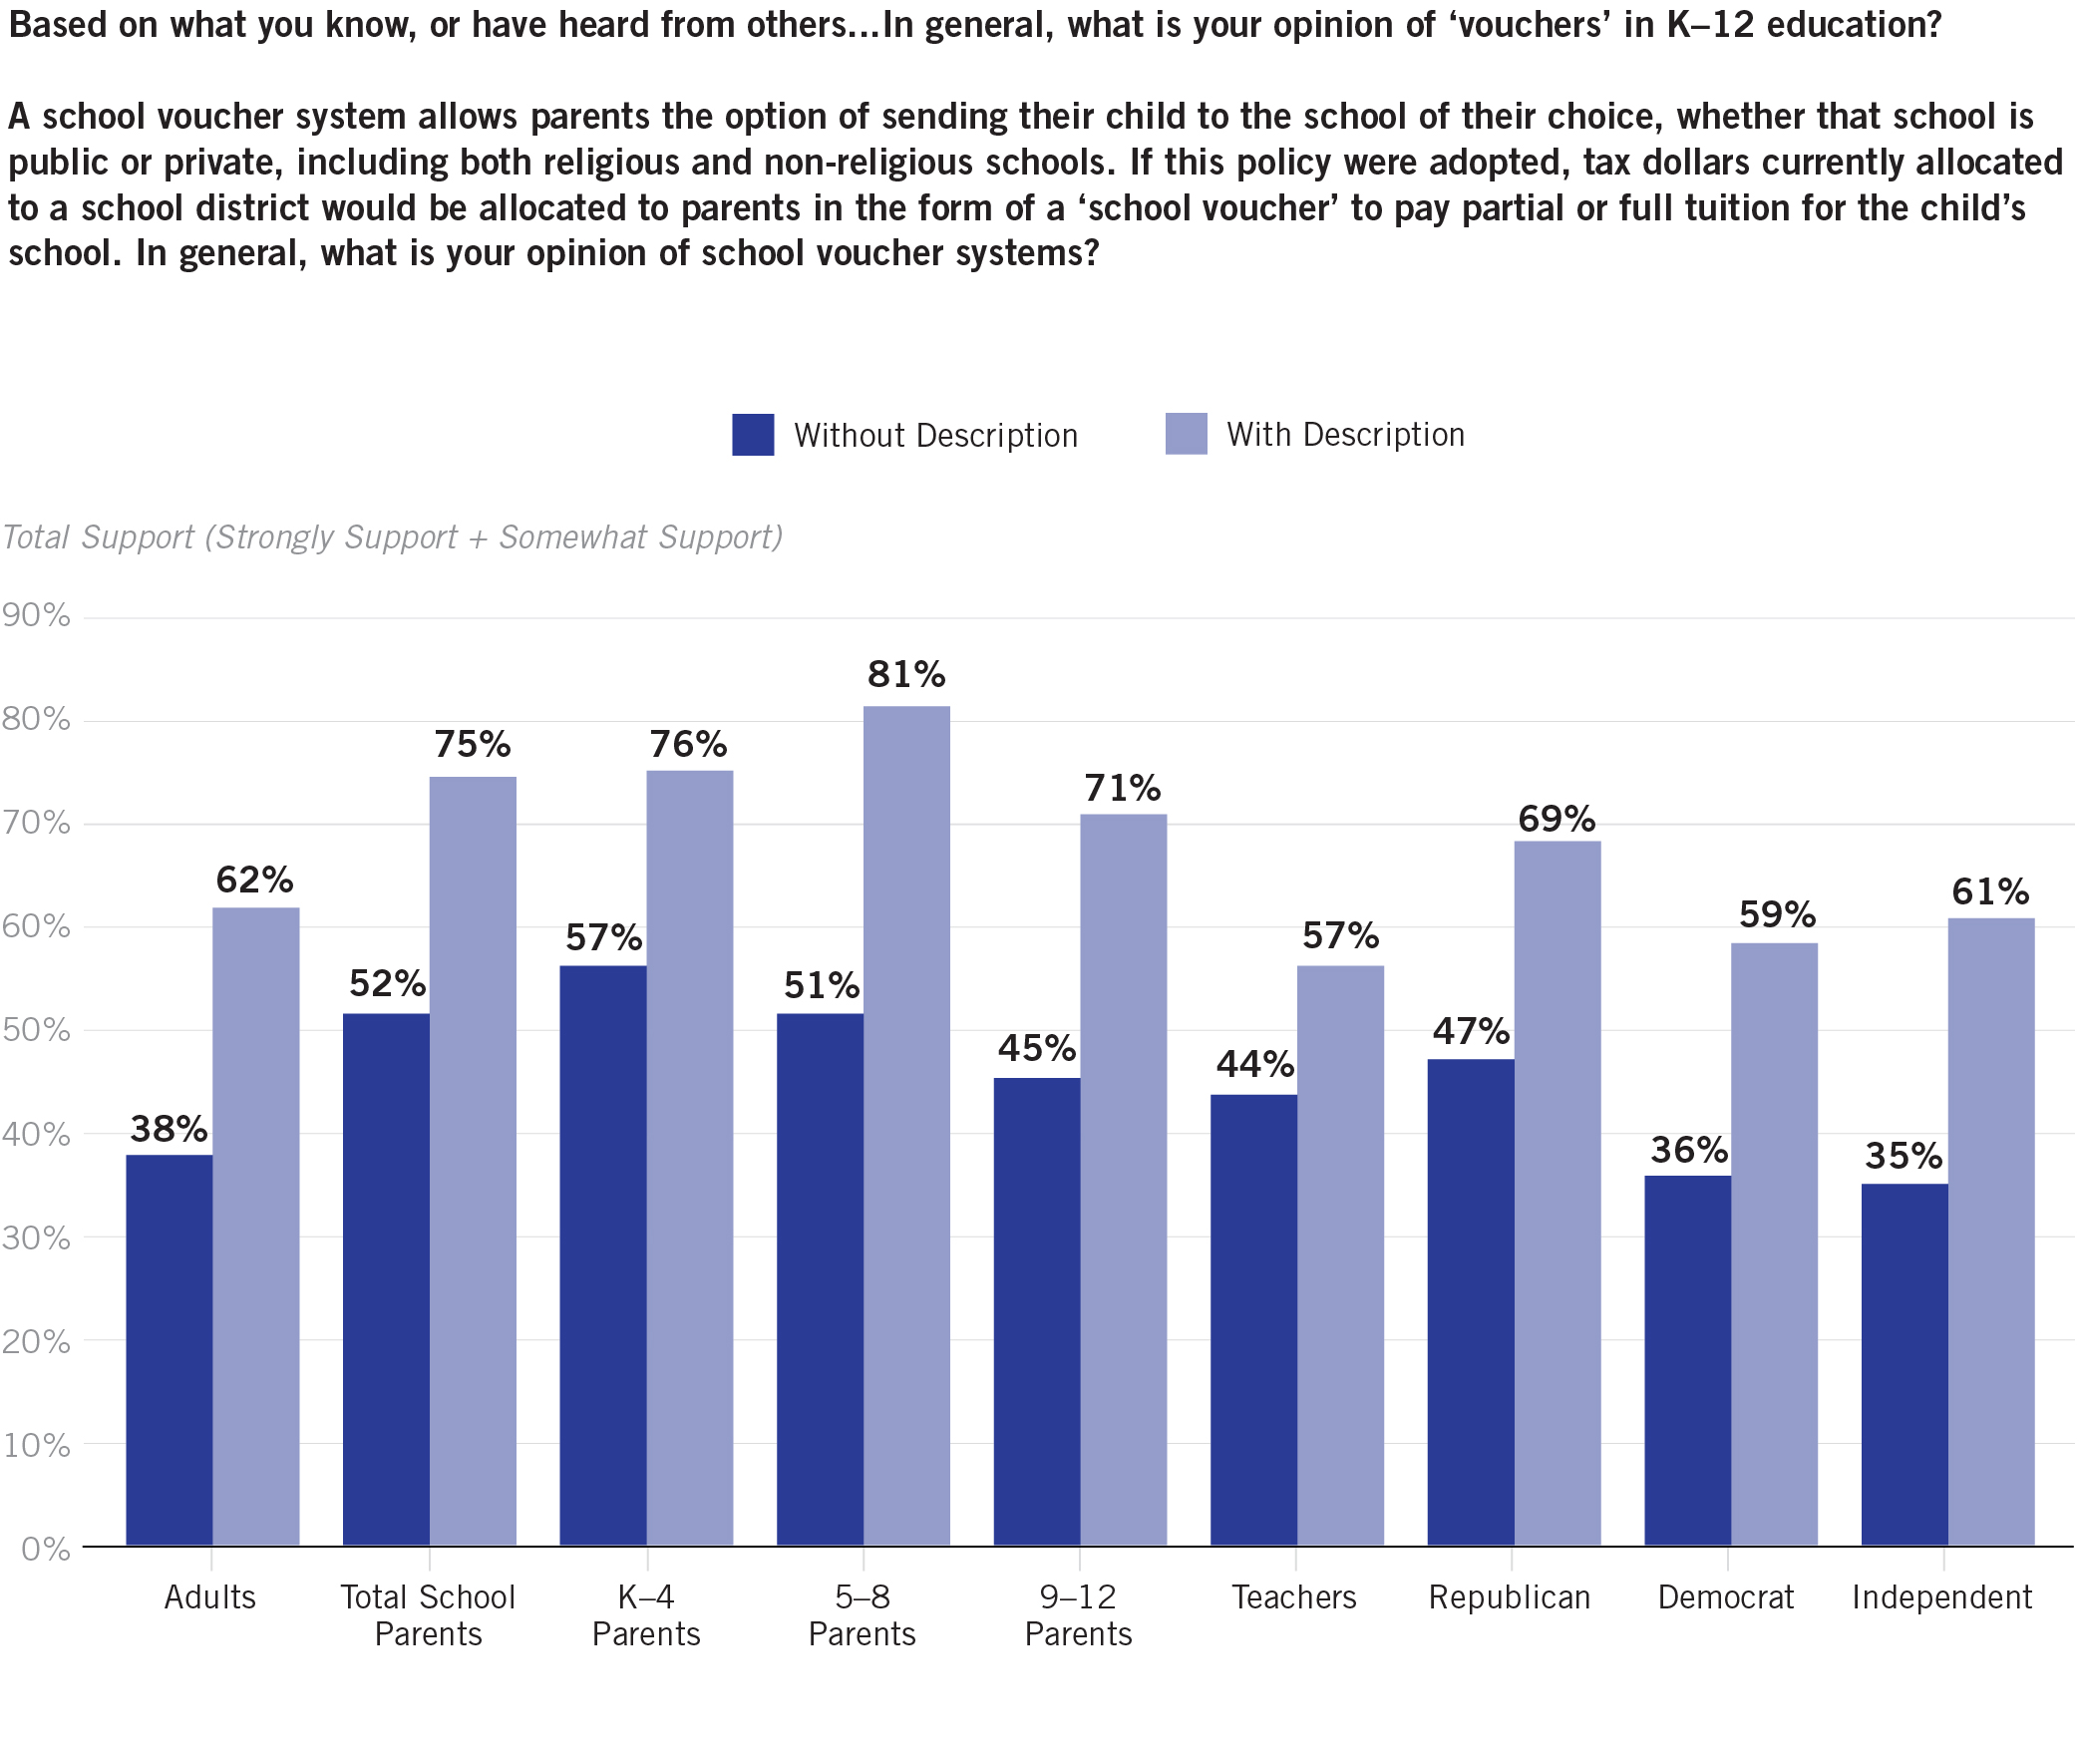
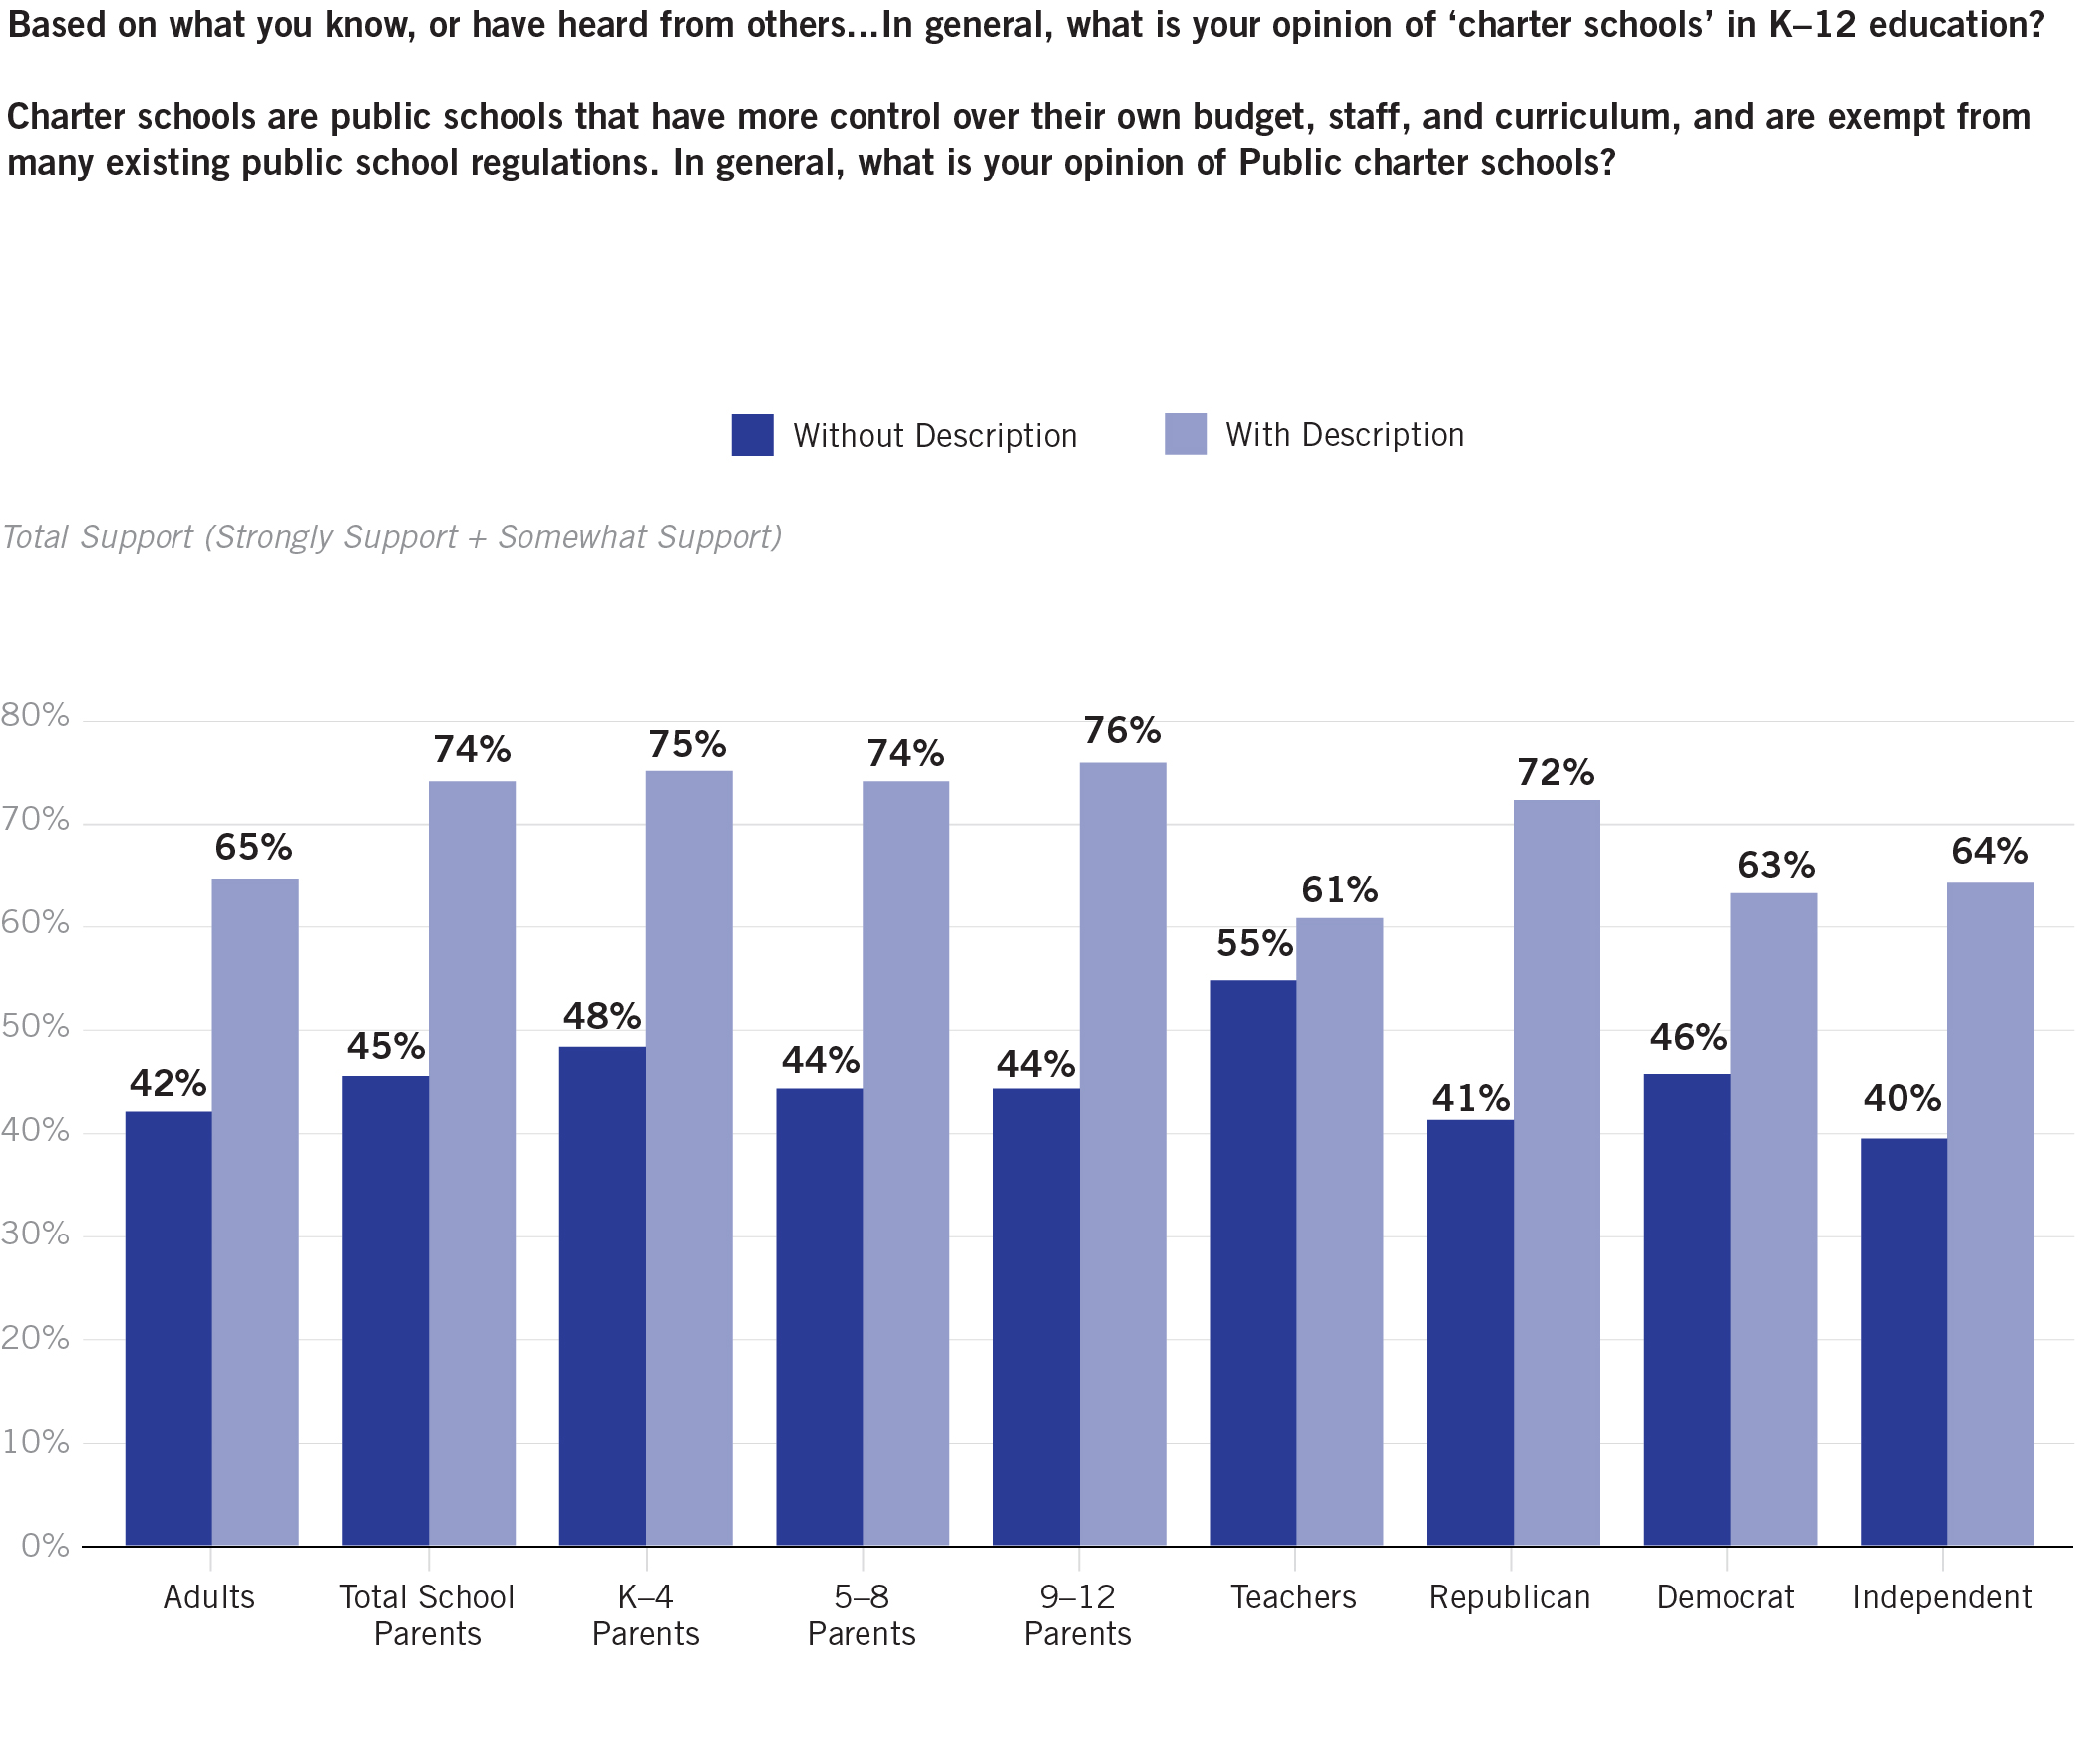
8. Public support for school choice reforms remains high and relatively unchanged since last month. Parents (especially K–4) and teachers tend to be most familiar initially with education savings accounts (ESAs), school vouchers, and charter schools. Once given descriptions of those policy types, parental support grows a lot, and teacher support goes up, as well, but less so. We see relative partisan differences when asked about charters and vouchers, but there appears to be none for ESAs.
NOTE: A lot of organizations are responding and doing great survey work in the turbulent times we are living in right now. I’ve started to catalog those polls and surveys asking COVID-19 and pandemic questions related to K–12 education. That archive page will be updated on a rolling basis roughly a few times per month or as polls get released. Please don’t hesitate to let me know if I’m missing any to date.