EdChoice Public Opinion Tracker: Top Takeaways June 2022
When you think July, you think heat. The fire from the grill, the warmth of a lit match igniting a firework, and of course, the weather. K-12 education, while hot in the minds of parents and educators for the majority of the calendar year, enjoys a respite around this time. That said, as we jump into the second half of the calendar, we inch closer and closer to hearing the back-to-school ads and a new school year starting.
What will the second half of 2022 bring? Will learning pod support continue to grow? Will education issues remain a top priority for voters? What do parents think about the level of public-school funding?
We asked these questions and many more in the June wave of our Monthly Public Opinion Tracker, a survey of a nationally representative sample of adults 18 and older (N=2,198), which was fielded June 15-21. Based on additional sampling of school parents, we gathered responses from 1,028 parents of school aged children.
This is the first polling we have fielded since the tragedy in Uvalde, Texas. We included questions about people’s opinions and observations pertaining to school safety, and we also included them in our June survey of teachers, which will release next week. I am not covering findings from those questions in this post because we have a separate post dedicated to our polling on school safety.
In the meantime, here are the key findings of the June wave of what we found:
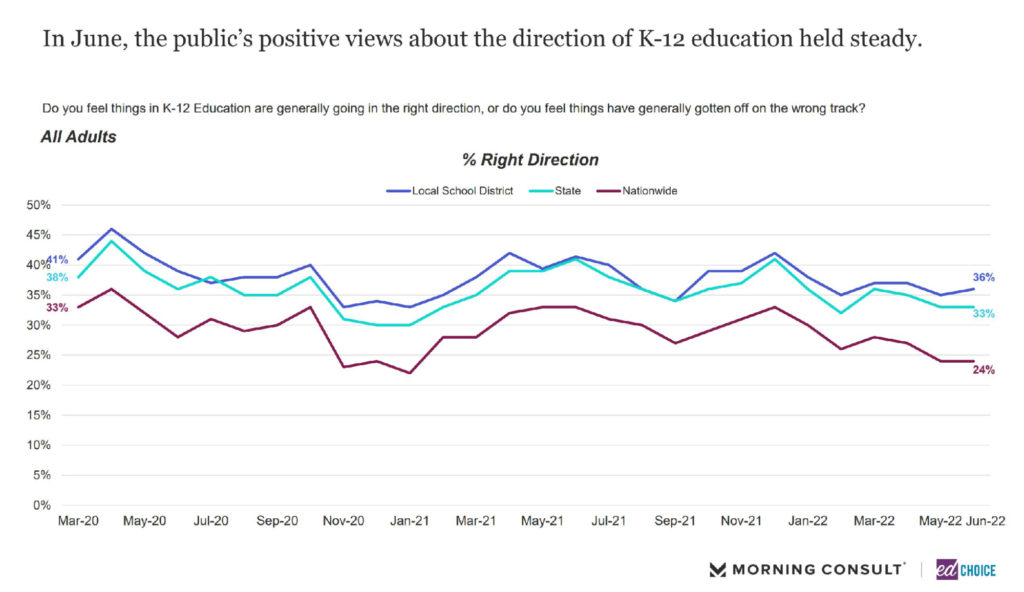
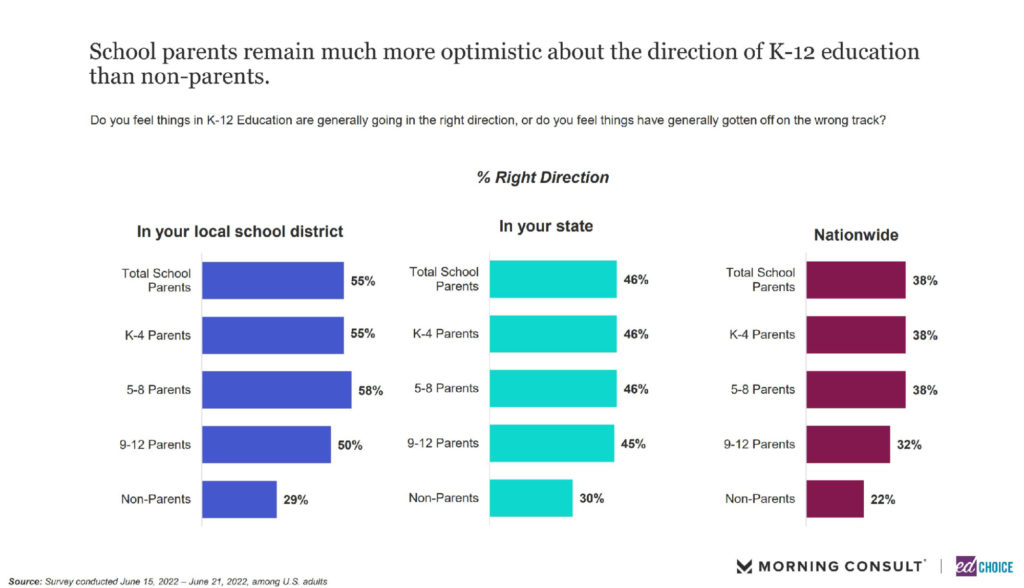
1. The majority of school parents are optimistic about the direction of K-12 education, at least at the local level. After a slight decrease in positivity in May, 55 percent of parents said that they thought their local schools were on the right track in June. When looking at K-12 education at a state and national level, school parents’ optimism held steady at 46 percent and 38 percent, respectively. Non-parents, on the other hand, are much more likely to say that K-12 education is headed in the wrong direction. Roughly two-thirds of non-parents believe K-12 education at a local and state level is headed in the wrong direction. Non-parents are even more skeptical when discussing K-12 education at a national level, with only roughly 1 in 5 non-parents expressing optimism.
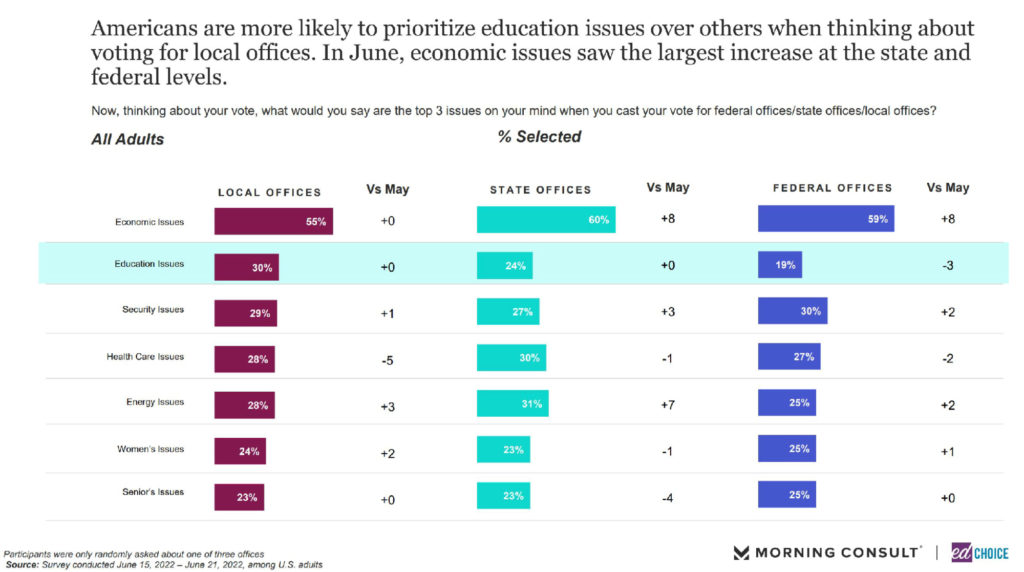
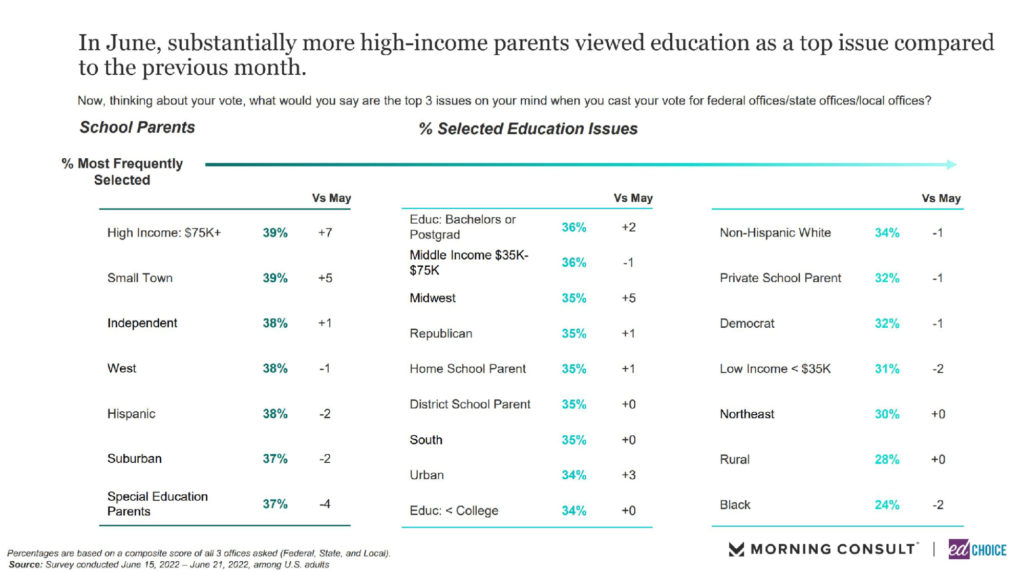
2. Education issues remain a top priority for voters in local elections. Economic issues continue to prevail as the top local priority among voters and have an even tighter grip on the top spot when discussing state and federal elections. While the number of Americans who view education as a top local or state issue held steady in June, the proportion of Americans who view education as a top federal issue slipped three points. Diving into the demographics, high income earners (with annual household incomes $75,000 and higher) and residents from small towns were the groups to prioritize education most often.
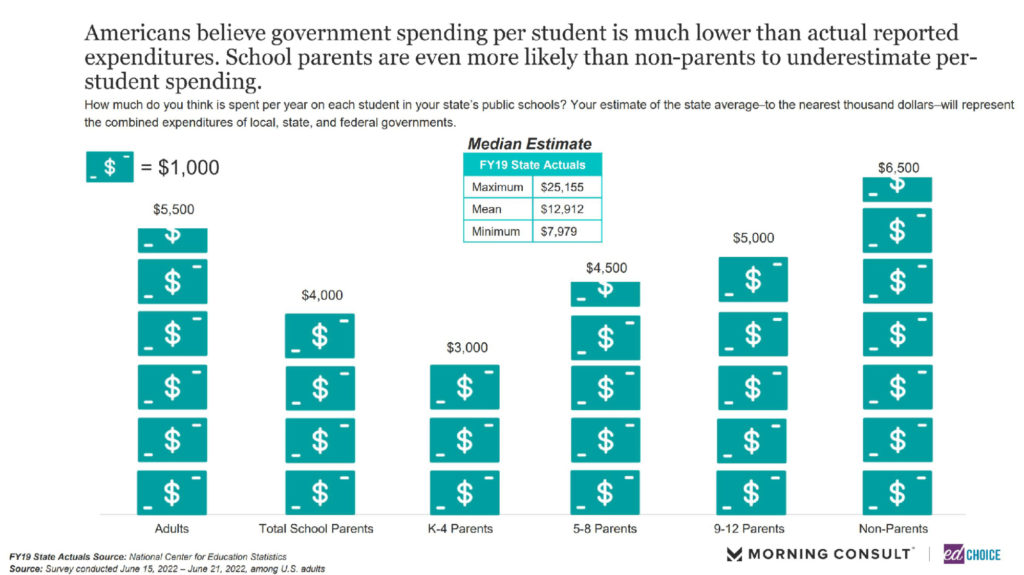
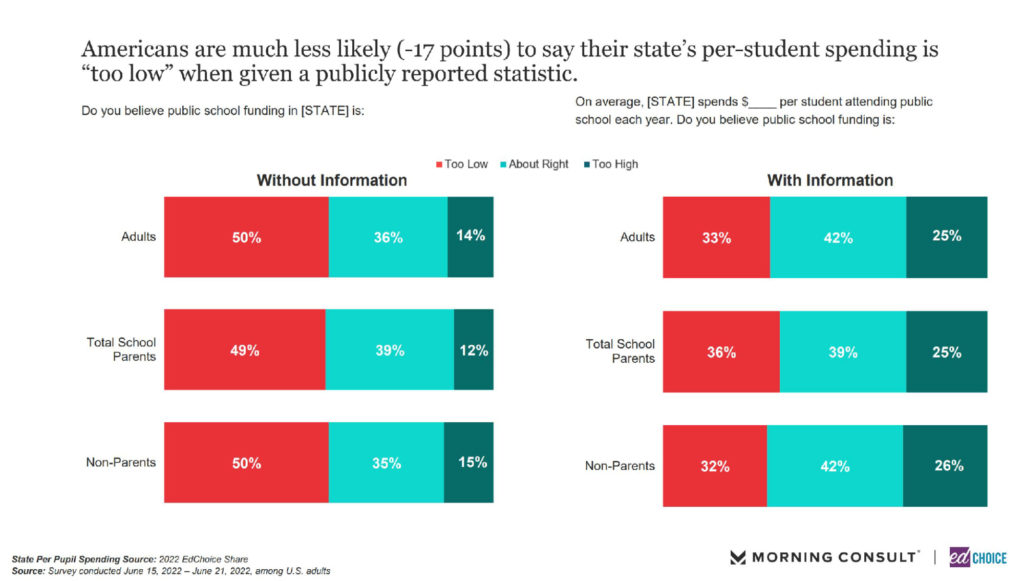
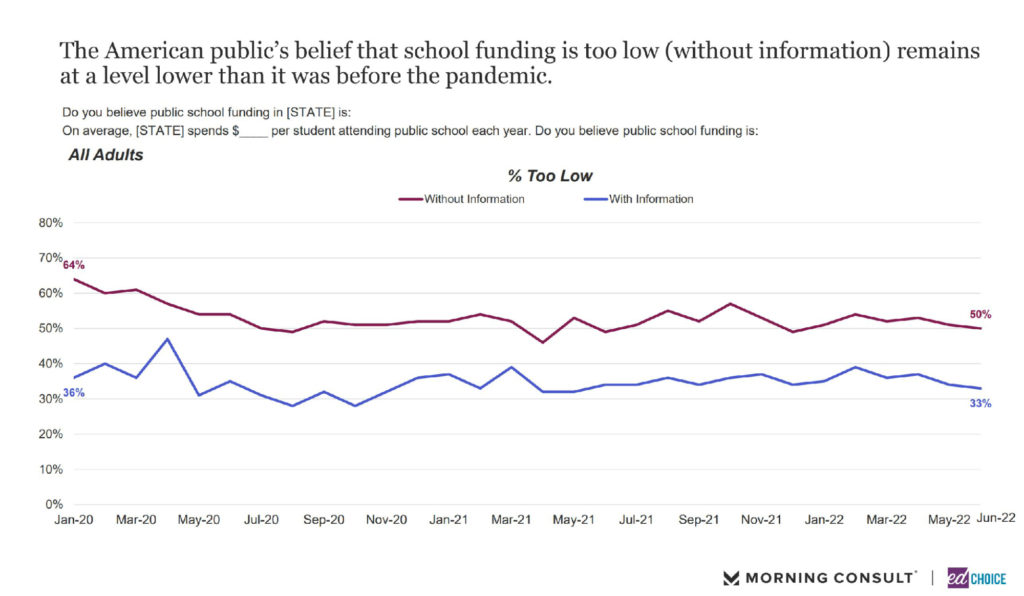
3. Americans are much less likely to say their state’s per-student spending is too low when shown how much it actually spends. Around half of parents and non-parents believe their state’s public-school funding is too low. When shown how much is actually spent, the percentage of both groups saying that their state’s public-school spending is too low drops to around 33 percent.
This could be explained by the fact that the median school parent estimates that their state spends around $4,000 per student per year. Non-parents, on the other hand, estimate that the state spends $6,500 per year on each student. Neither guess is particularly close to the actual average spending amount of nearly $13,000 per student.
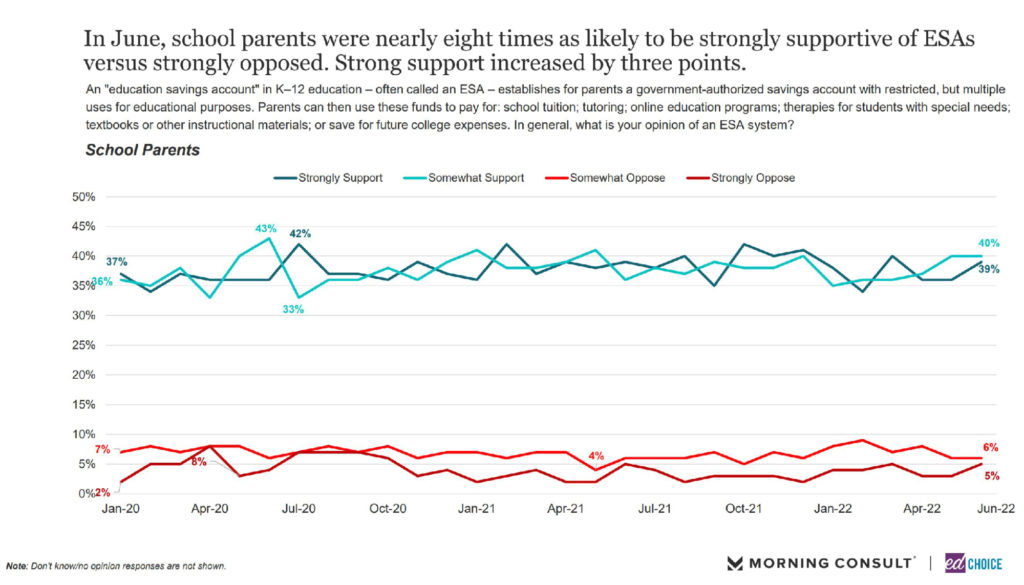
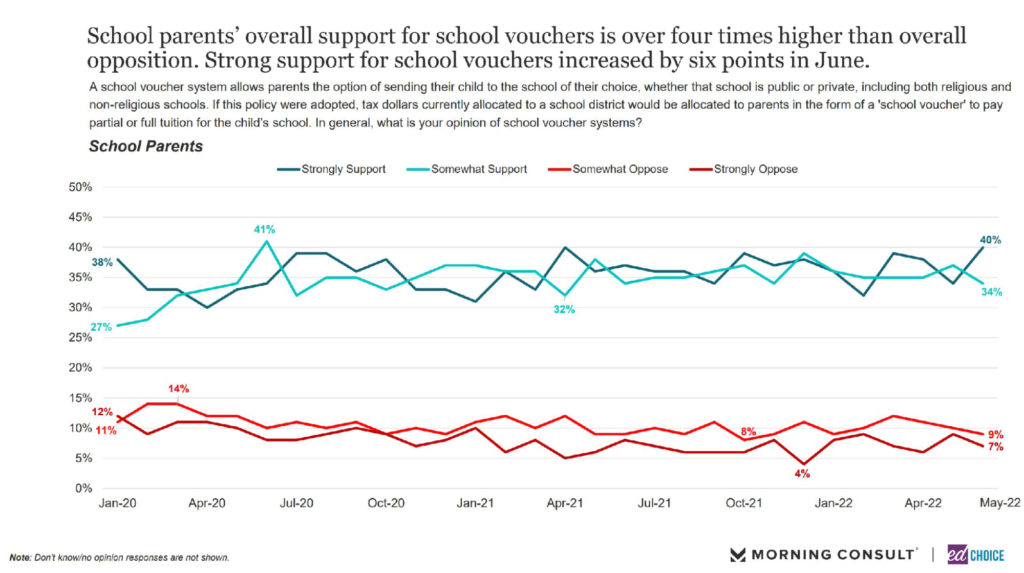
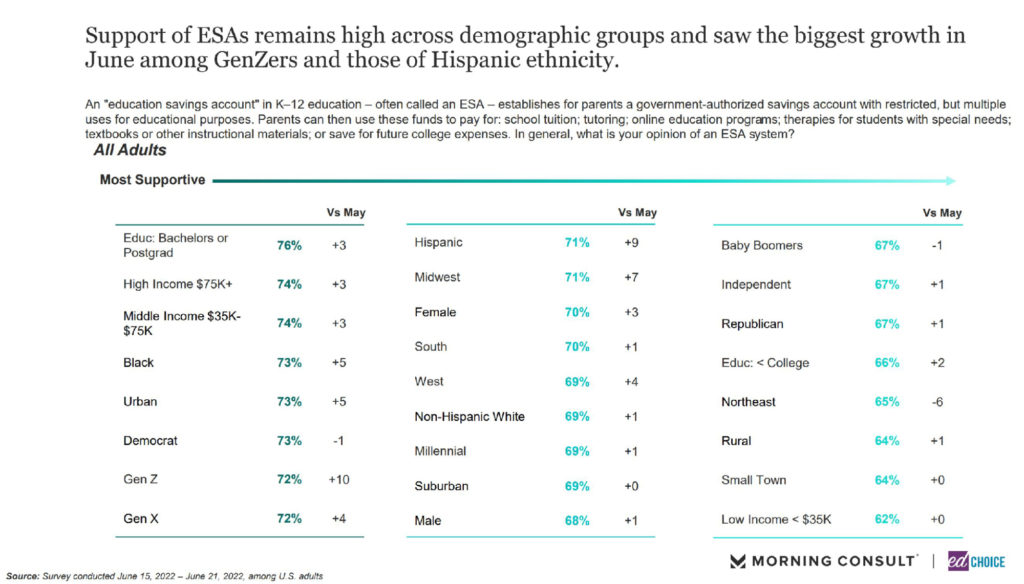
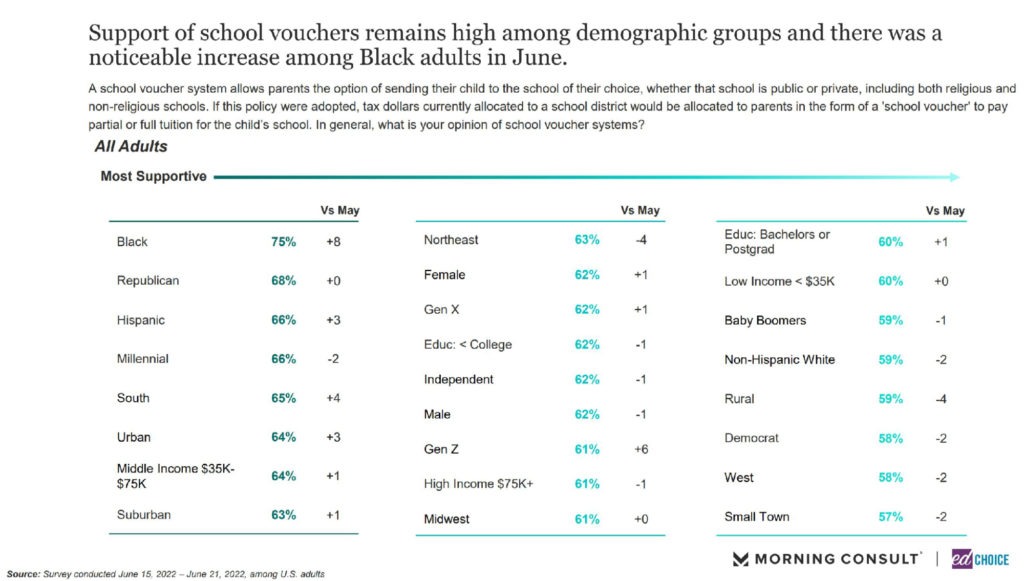
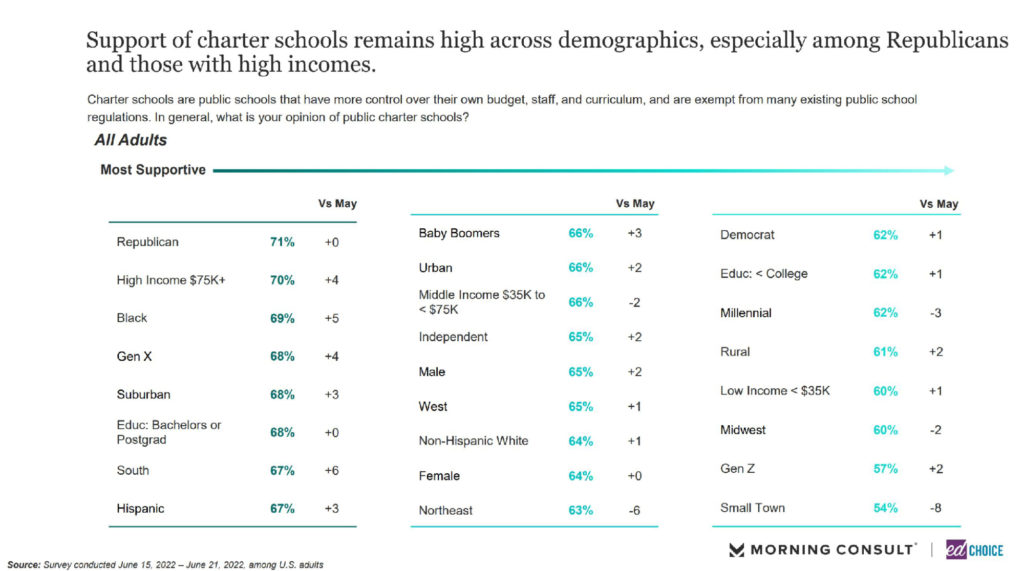
4. Strong support for school choice policies among parents increased in June. Parents’ strong support of charter schools and education savings accounts (ESAs) increased by three points in June, while strong support for vouchers jumped 6 points last month to the highest level observed in our polling. High levels of support for school choice are prevalent across all kinds of policies, as more than 3 in 4 parents are supportive of ESAs, vouchers, and charter schools. The demographic breakdown was interesting, with some groups experiencing big jumps in overall support. ESAs, for example, are supported by 72 percent of Gen Z adults and 71 percent of Hispanics, a jump of 10 and 9 points from May, respectively. Black adults lead the way in terms of support for vouchers, with 75 percent indicating they are supportive of the policy. That is an 8-point increase from May. Republicans, high income earners ($75,000+), and black adults were the most likely groups to support charter schools.
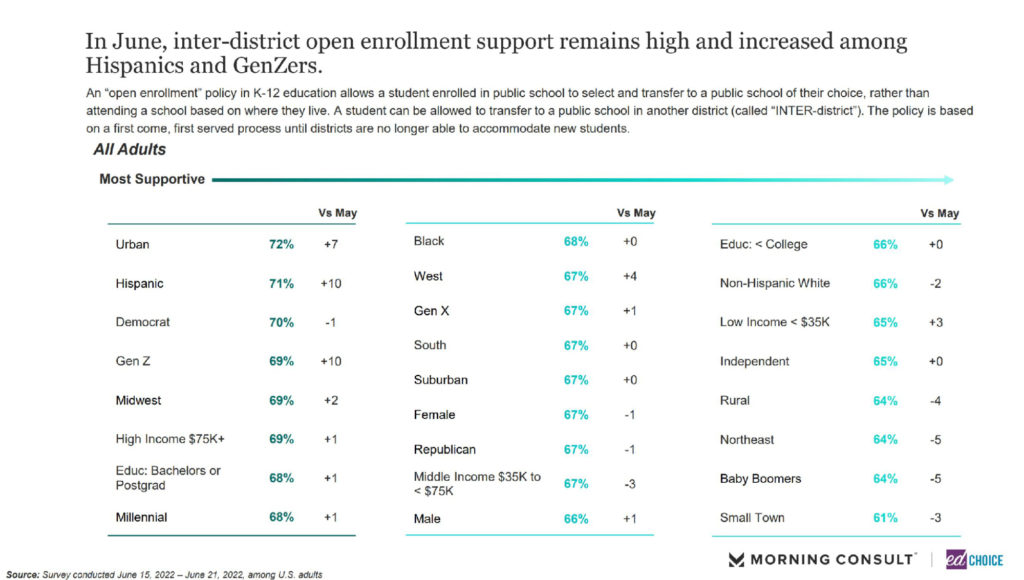
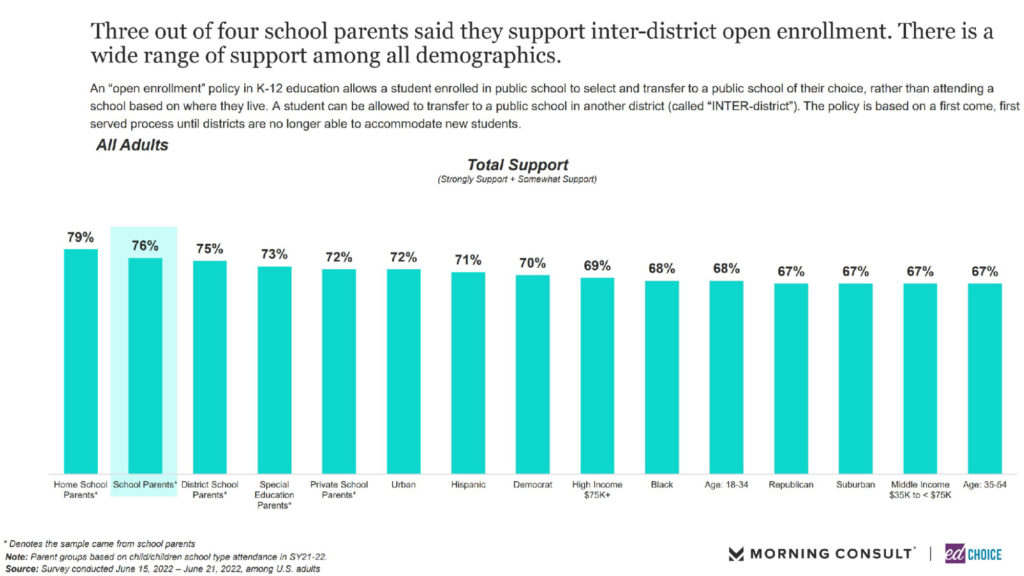
We also ask about inter-district enrollment, another school choice policy. It is quite popular with school parents, with more than 3 in 4 parents expressing support. People living in urban areas, Hispanics, and democrats are the most likely groups to support inter-district enrollment. GenZ-ers trail right behind those groups in terms of support, thanks to a 10-point increase in support from May.
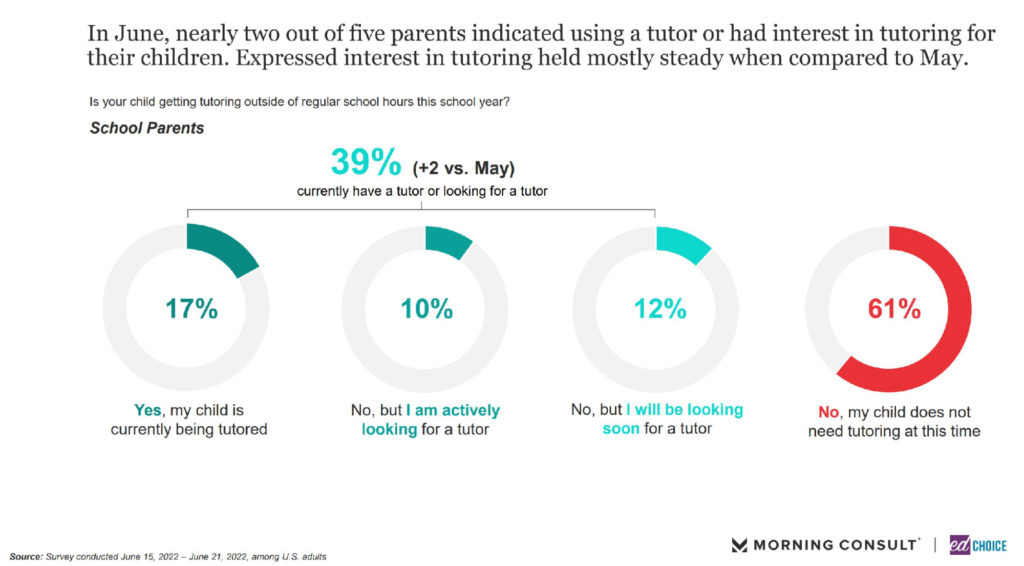
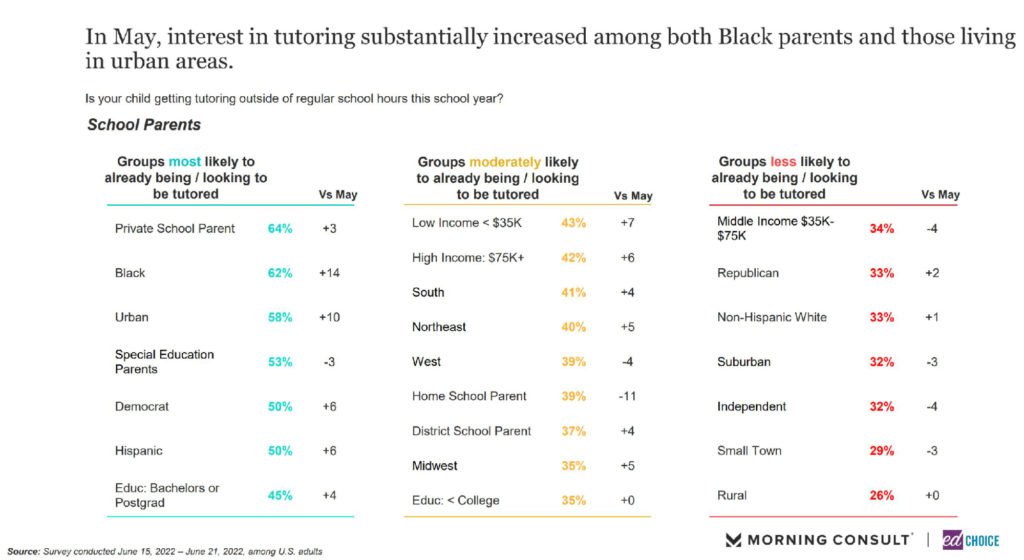
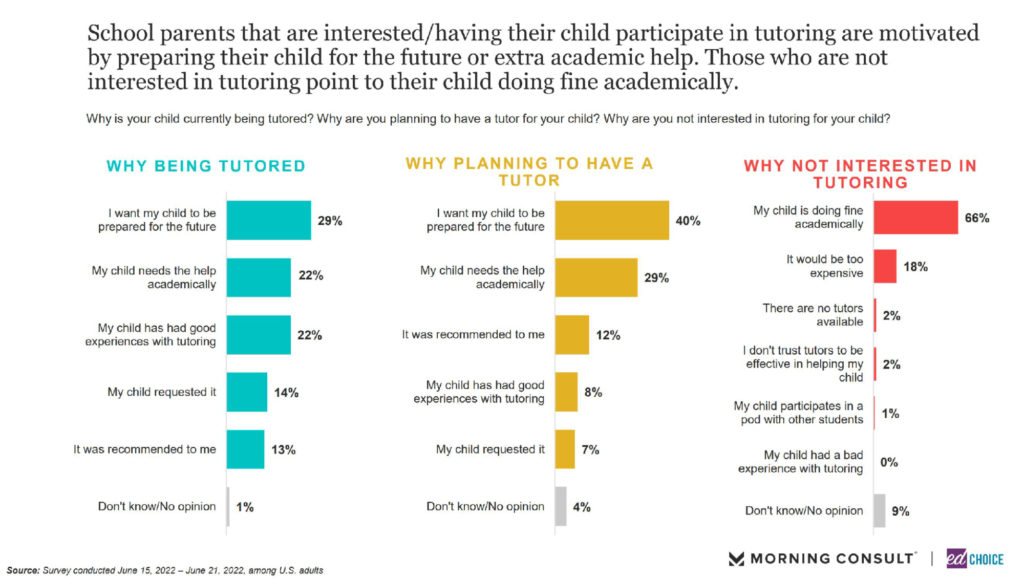
5. Tutoring usage and interest increased slightly in June. Overall interest in tutoring has mostly held steady this year, and that trend continues in June. The demographic breakdown mirrors that of learning pods. Private school parents, Black parents, and parents living in urban settings are the most likely groups to indicate usage and interest in tutoring. As for the motivations for using or seeking out a tutor, getting their child more prepared for the future and feeling their child needs help academically were the top reasons among parents.
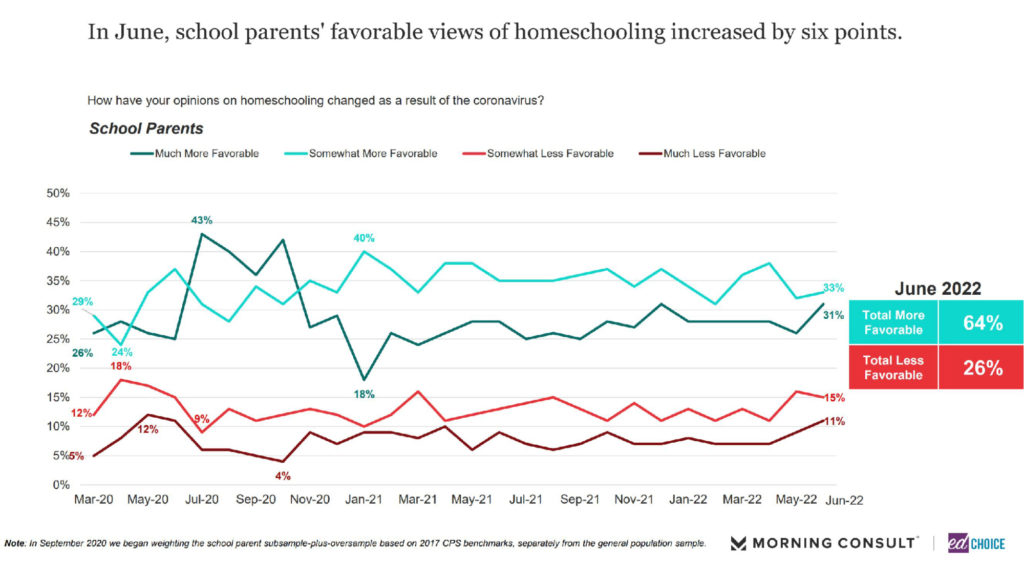
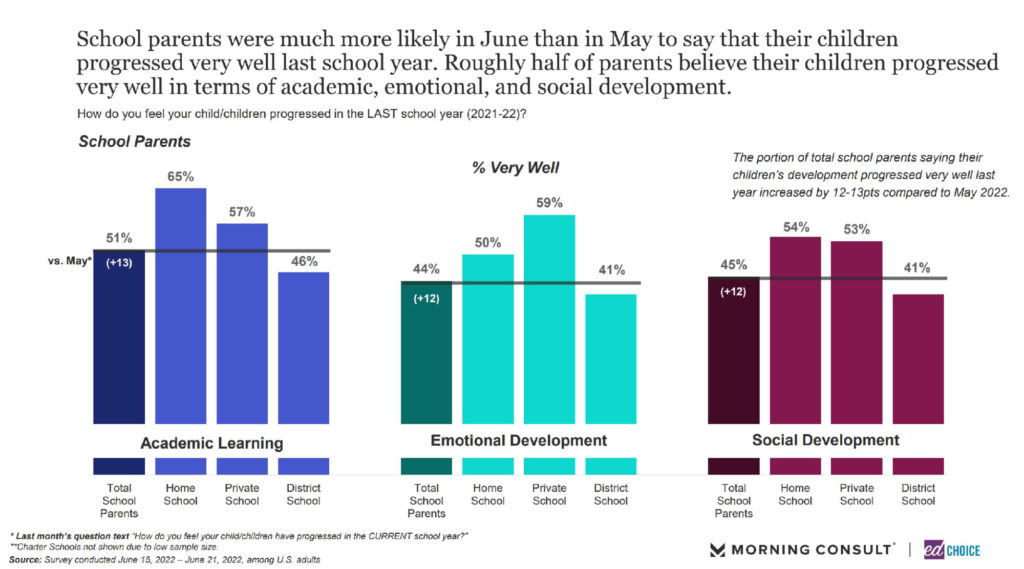
6. Homeschooling is supported by nearly two-thirds of school parents. In June, strong support for homeschooling among school parents increased 5 percentage points, reaching the highest level observed since fall of 2020. Additionally, more than half of homeschooling parents believe their child has progressed very well last school year in terms of academic learning, emotional development, and social development.
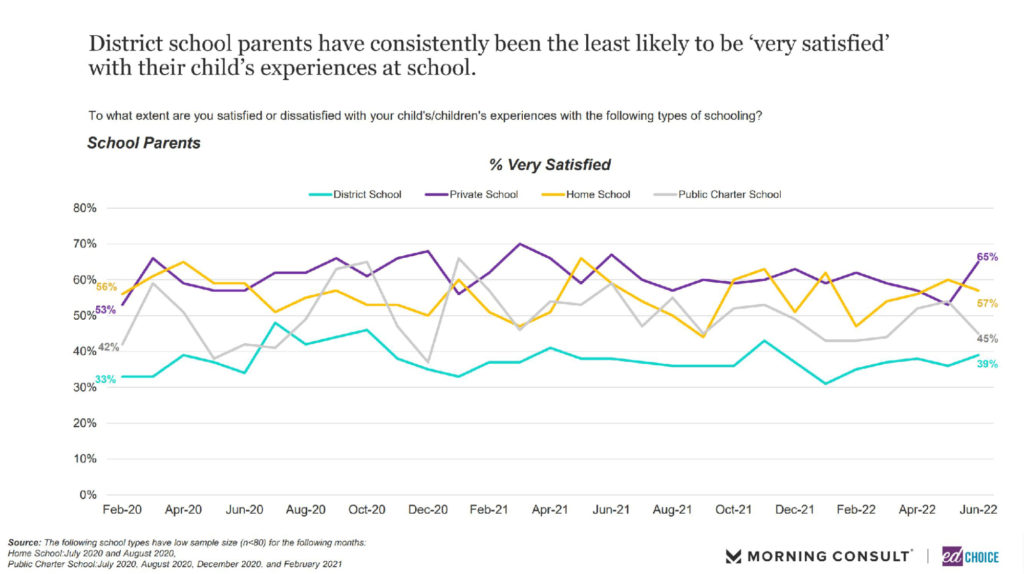
7. The majority of homeschooling parents believe their child progressed very well last school year. Private school parents join homeschooling parents as the only groups with a majority of respondents believing their child has progressed very well when it comes to academic learning, emotional development, and social development. District school parents are the least likely to believe their child has progressed well in the areas above.
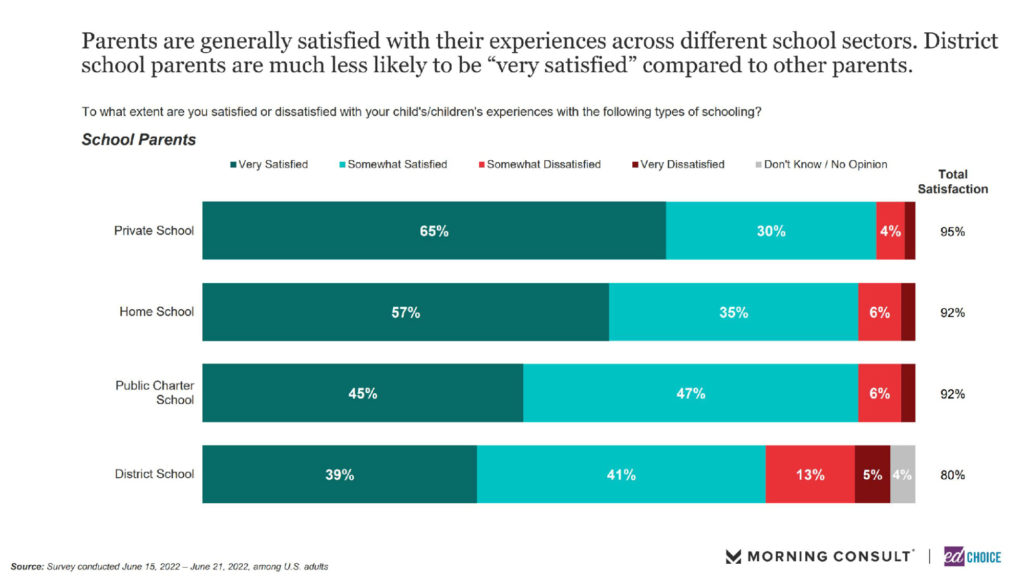
8. Parents are satisfied, regardless the type of school their child attends. Private school, homeschool, and charter school parents all report satisfaction levels of more than 90 percent, with the majority of homeschool and private school parents saying that they are very satisfied with their child’s schooling experiences. District school parents are consistently the least satisfied of the bunch, but still report 80 percent satisfaction.
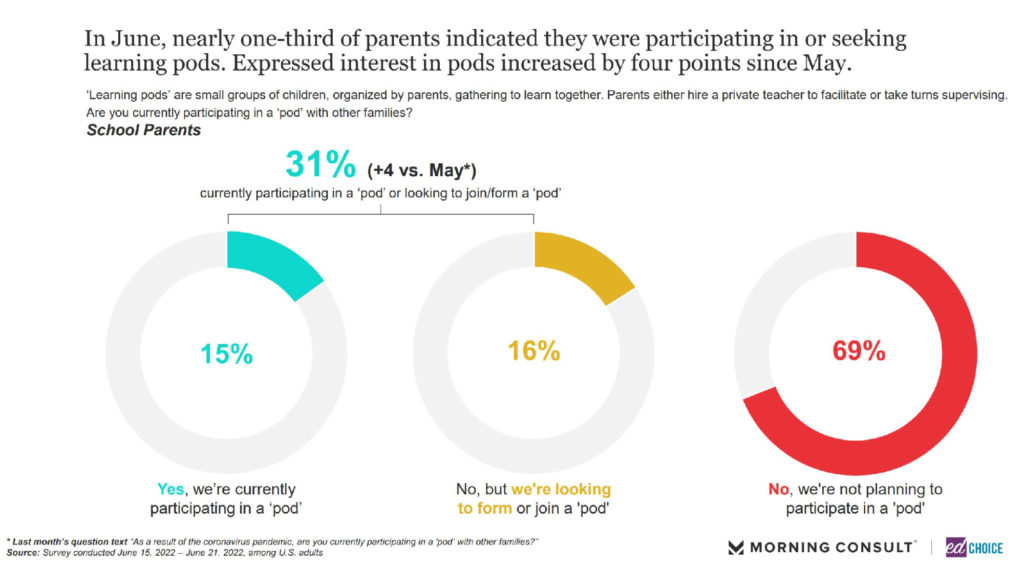
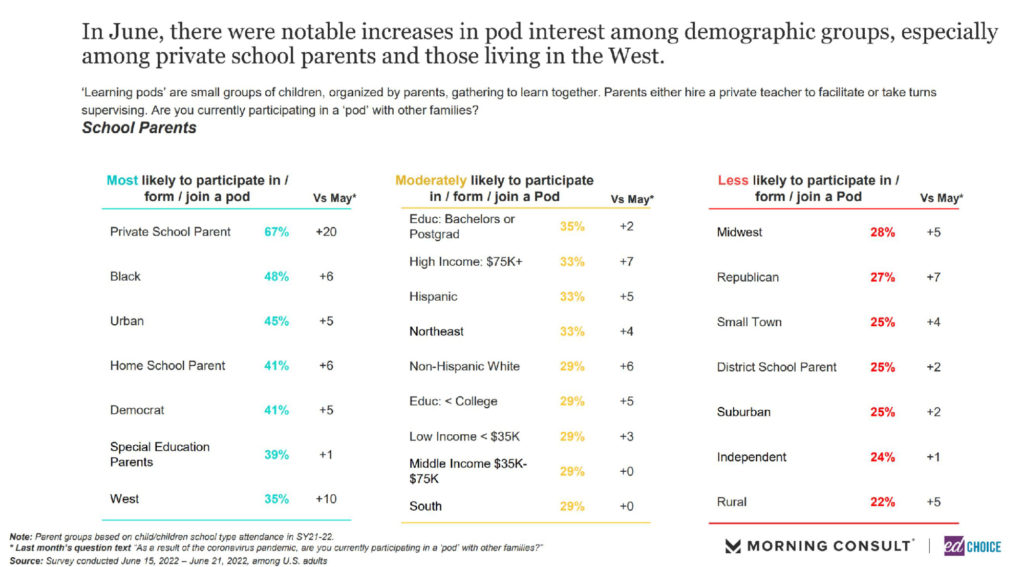
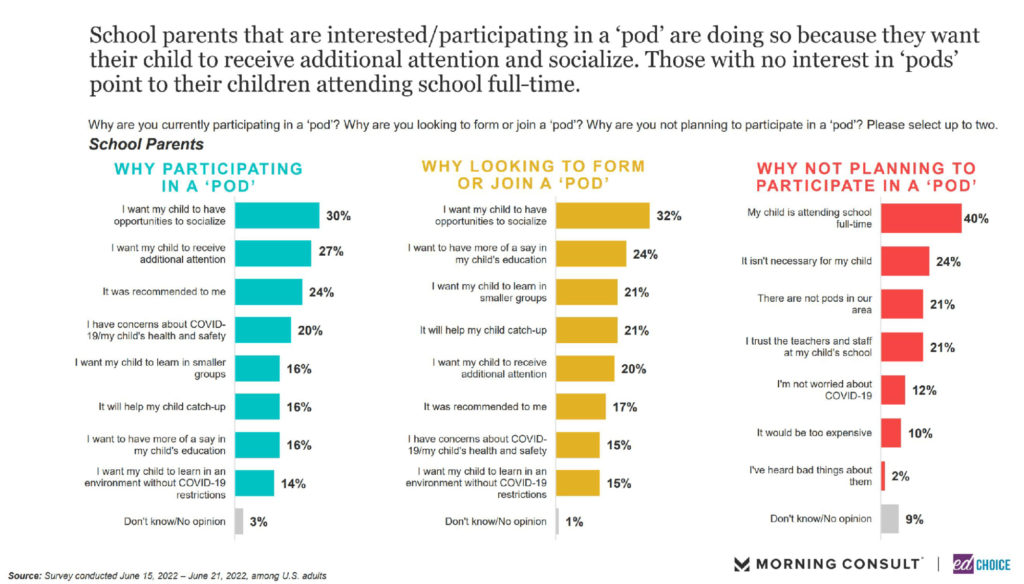
9. Learning pod interest bounced back in June. After falling to the lowest level we’ve observed since asking the question back in fall of 2020, overall interest in learning pods jumped 4 points this month. Nearly two-thirds of private school parents indicate they are likely to participate in, look for, or form a learning pod. That is a 20-point leap from May to June. Black parents and parents living in an urban setting were the next most likely groups to show interest in learning pods. When discussing reasons for joining or looking for a learning pod, increased socialization and more individual attention for their child were the most popular.
Visit the EdChoice Public Opinion Tracker site to access past questionnaires, and our national and state dashboards that are updated monthly. We also provide a more in-depth description of our research and survey methods.
Our K–12 education polls archive is updated on a rolling basis, roughly a few times each month. Please don’t hesitate to let us know if we are missing any surveys, or if there are accidental errors.