EdChoice Public Opinion Tracker: Top Takeaways March 2022
Spring break adventures are coming to an end, and students and families are turning their attention to finishing the school year strong. While the COVID-19 pandemic continues to cloud the 2021–22 school year, case counts have dropped to their lowest levels since summertime.
Our monthly EdChoice Public Opinion Tracker, powered by Morning Consult, captures parents’ and the general public’s sentiment on relevant questions in today’s educational landscape. The newest wave of the survey was in the field March 15–19. We asked a battery of questions to a nationally representative sample of 2,200 Americans adults aged 18 and over. With additional sampling, we obtained responses from a total of 1,072 parents of school-aged children.
Here are seven key findings from our March 2022 wave:
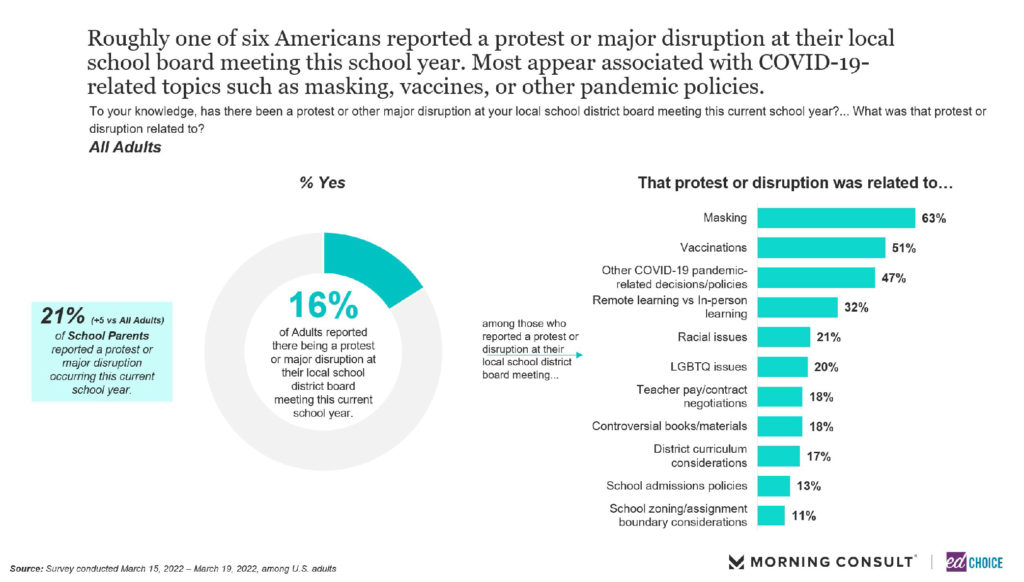
1. One-fifth of school parents reported a protest or major disruption at their local school board meeting this school year. We included a question regarding any sort of protest or major disruption to a local school board meeting for the first time in March. Sixteen percent of all adults reported a protest or major disruption at their local school board meeting, while school parents indicated these events happened at a slightly higher rate. These protests/disruptions most often stemmed from masks (63 percent), vaccinations (51 percent) or other pandemic related policies (47 percent).
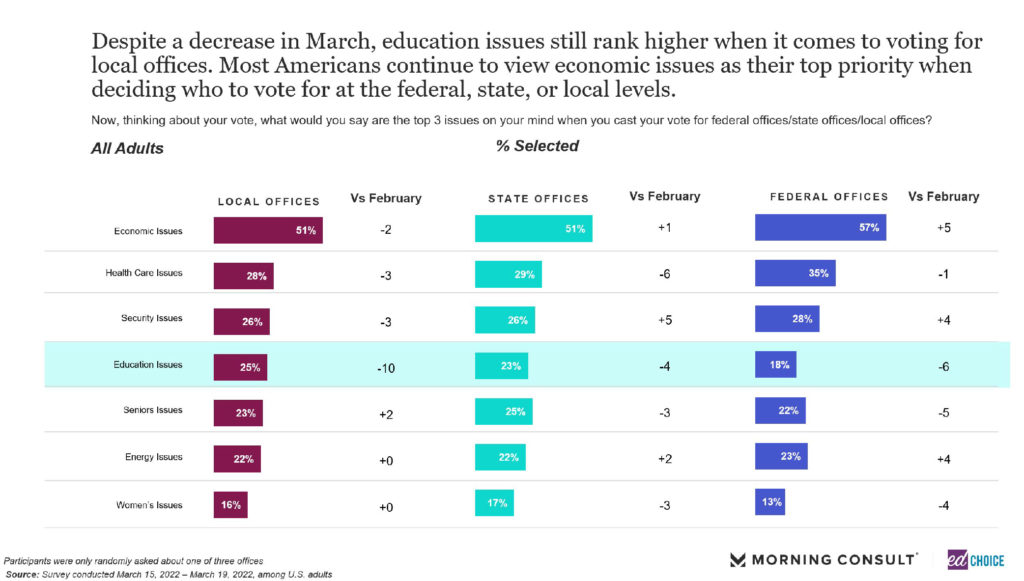
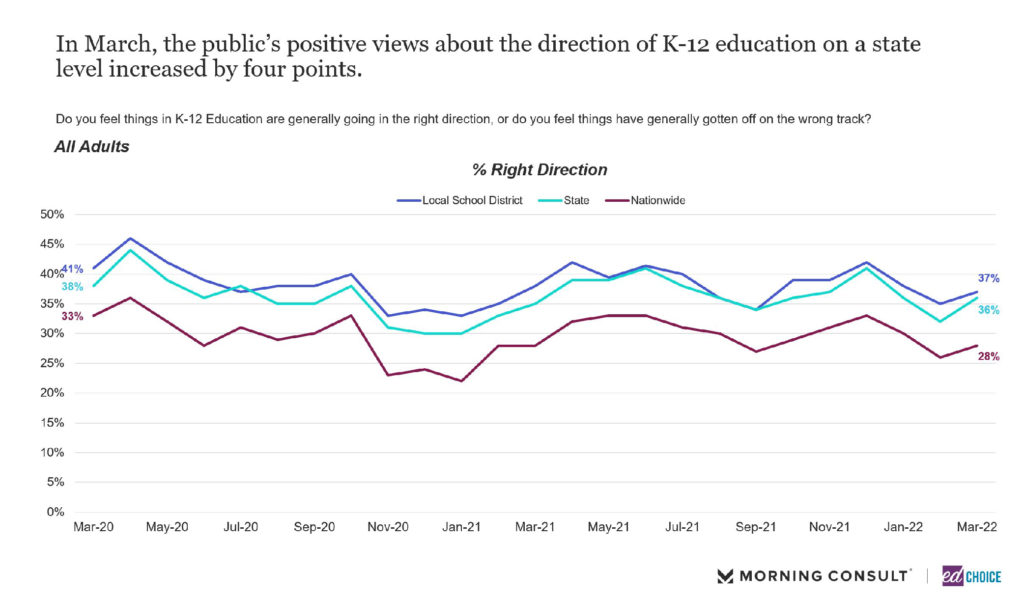
2. Education issues became less of a priority among the voting population in March. In March, economic issues remained the chief concern for people considering their electoral choices. Compared to February, respondents were less likely to rank education among their top three issues when choosing who to vote for in federal, state and local offices. Interestingly, the general public was increasingly optimistic about the general direction of K–12 education in March, as well. When education issues are higher priority for the voting population you can assume more pessimism toward K–12 education. The opposite is true as well, as we see in March, the general population’s increased optimism toward K–12 education is reinforced with education issues slipping down the list of voting priorities.
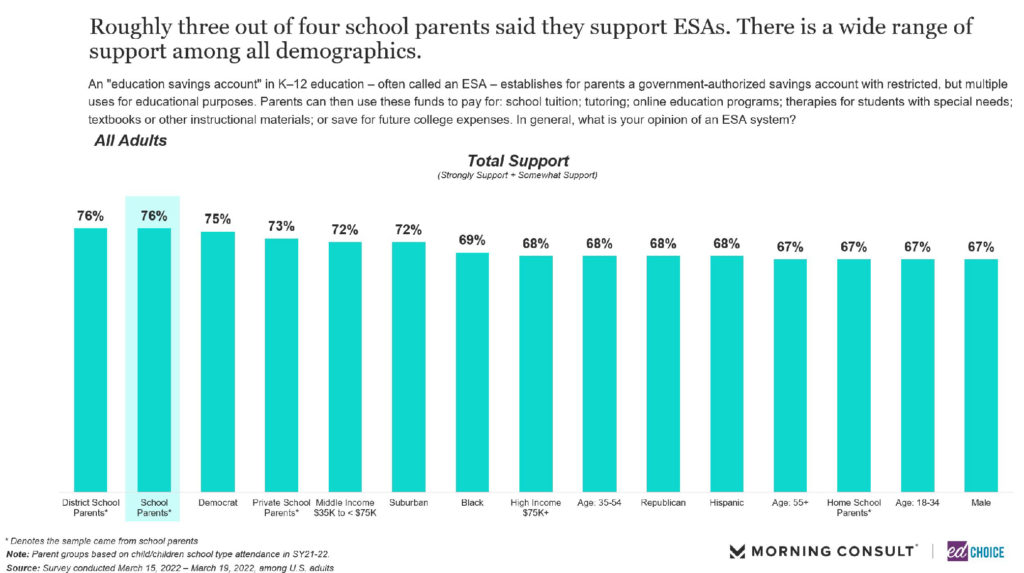
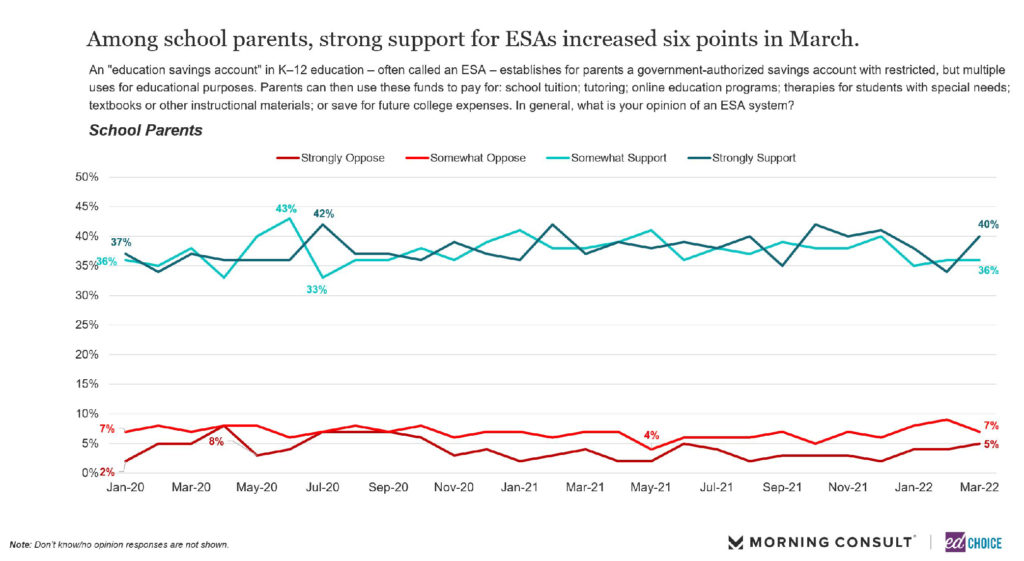
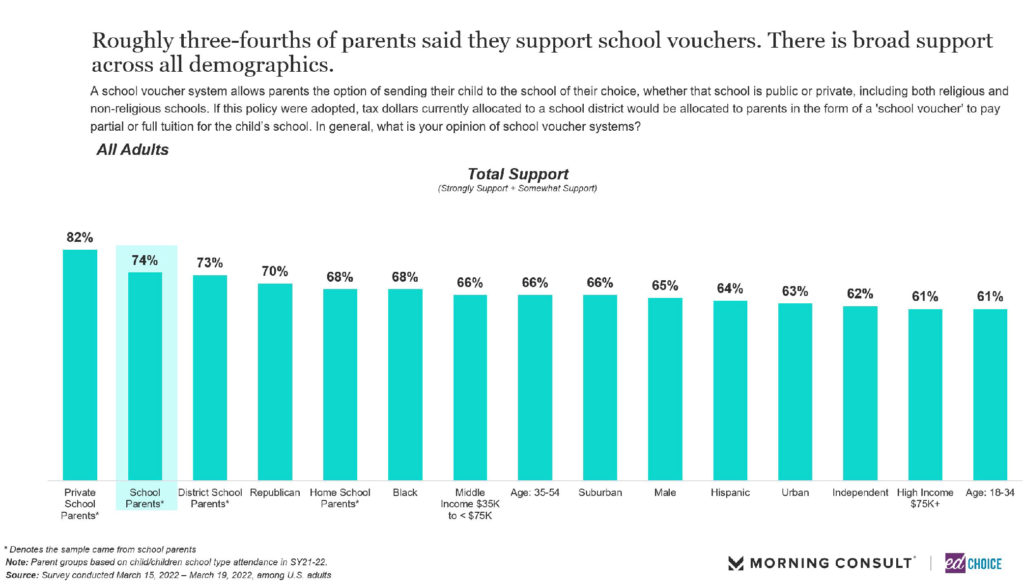
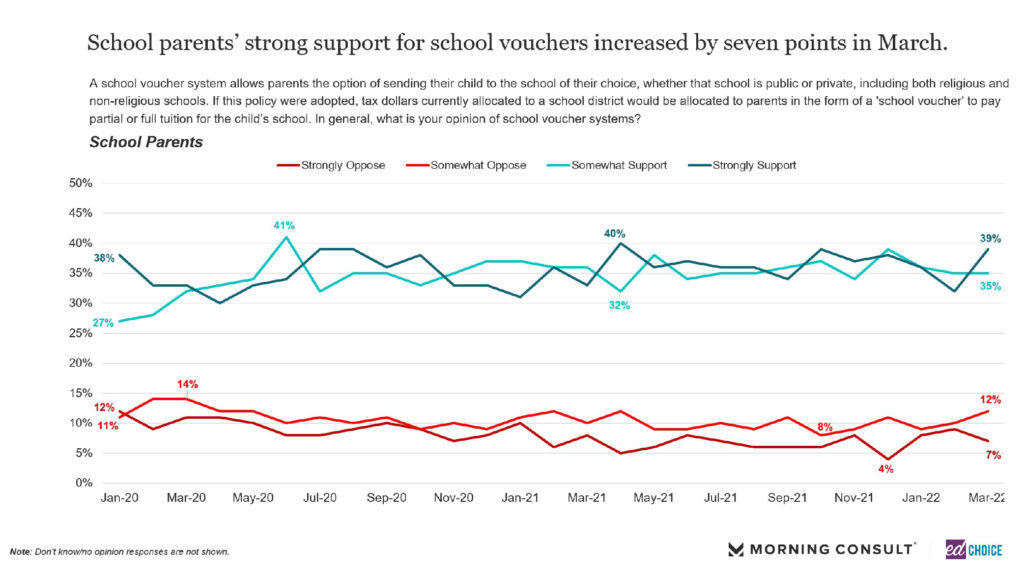
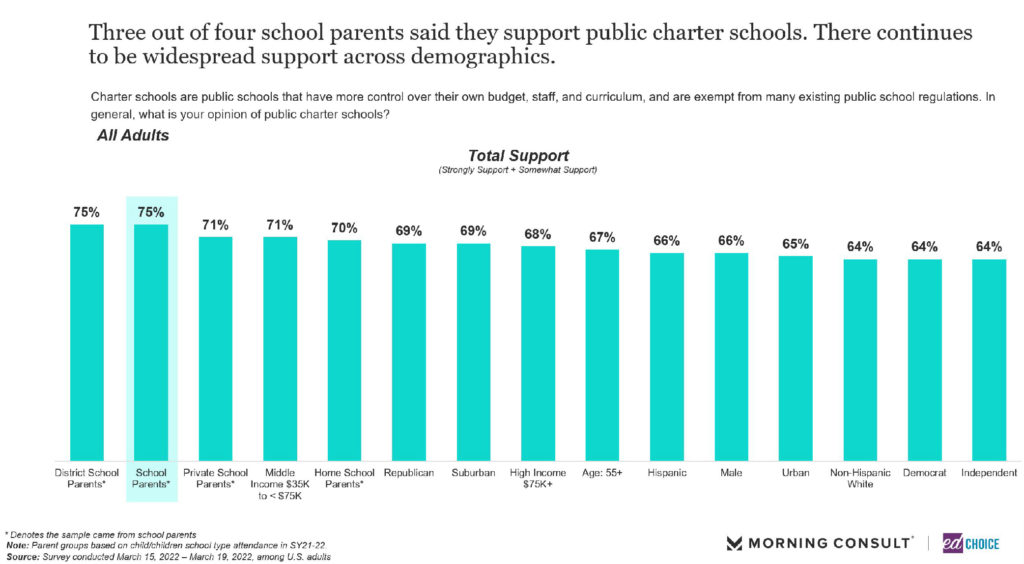
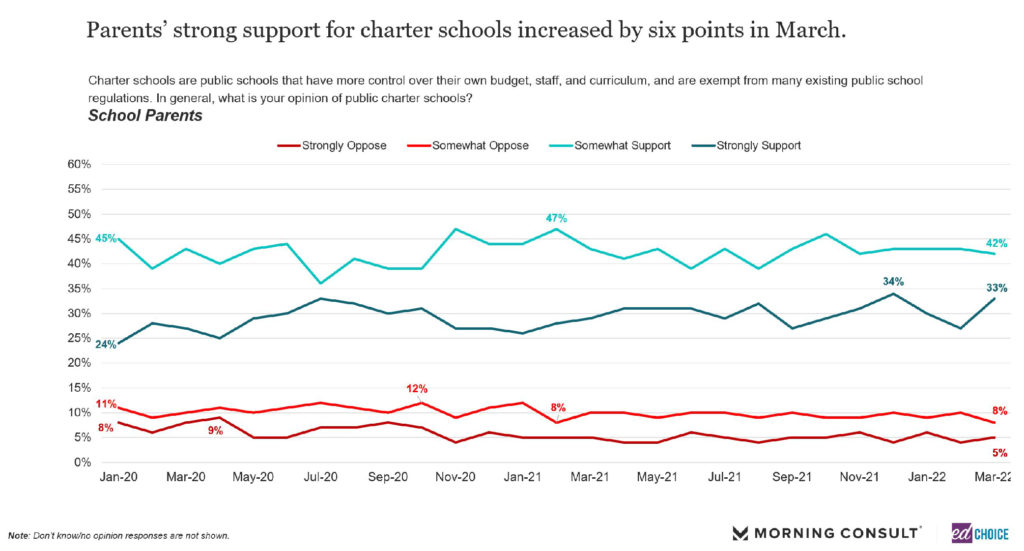
3. Strong support among parents for school choice policies increased across the board in March. After a little dip in February, strong support from parents toward education savings accounts (ESAs), school vouchers and charter schools all increased by at least 6 points. Support for ESAs, school vouchers and charter schools among the general population and parents has been a constant finding in our polling for quite some time. The overall support for these school choice policies persisted into March, with ESAs remaining the most popular of the bunch.
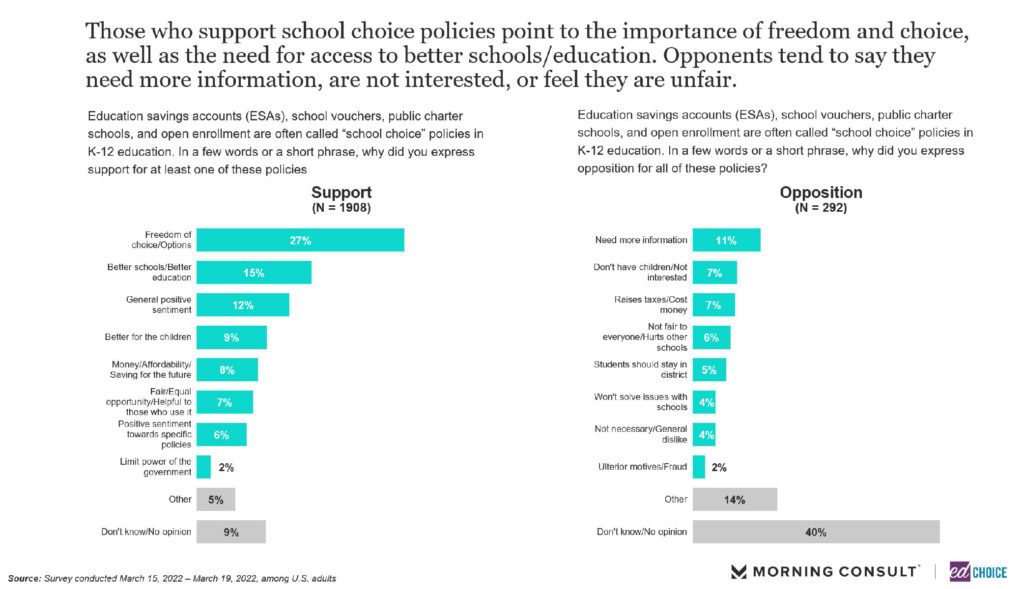
4. Opponents of school choice are consistently more vague with their reasoning than supporters. This is now the second month in a row we have asked respondents why they support or oppose school choice policies. There are two really important trends we are seeing develop. First, opponents of school choice were significantly less likely to answer the question at all. Only 60 percent of school choice opponents provided a reason for their disapproval (63 percent last month). Supporters of school choice policies, on the other hand, answered the question at a much higher rate, 91 percent (92 percent in February).
The second important aspect of this question originates from the reasons supporters and opponents provide to justify their stance. Opponents of school choice had a tough time finding justification for opposing the actual policies themselves. Instead, the most popular reason for opposing school choice policies was lacking sufficient information regarding the policies themselves (11 percent of all opponents and 18 percent of opponents who provided an answer). The second most popular justification for opposing school choice policies stemmed from not having children or not having enough interest in school choice policies as a whole (7 percent of all opponents and 11 percent of opponents who provided an answer).
Supporters of school choice provided reasoning that was much more policy specific. The most popular answer—by a wide margin—among supporters highlighted the freedom of options school choice policies deliver (27 percent of all supporters and 30 percent of supporters who provided an answer). The next most supported reason for believing in school choice was that these policies improve schools and improve education within the schools (15 percent of all supporters and 16 percent of supporters who provided an answer). Some vagueness was present when supporters were asked to explain why they support school choice policies, as well. General positive sentiment toward school choice policies ranked as the third most popular reason for supporters (12 percent of all supporters and 13 percent of supporters who provided an answer).
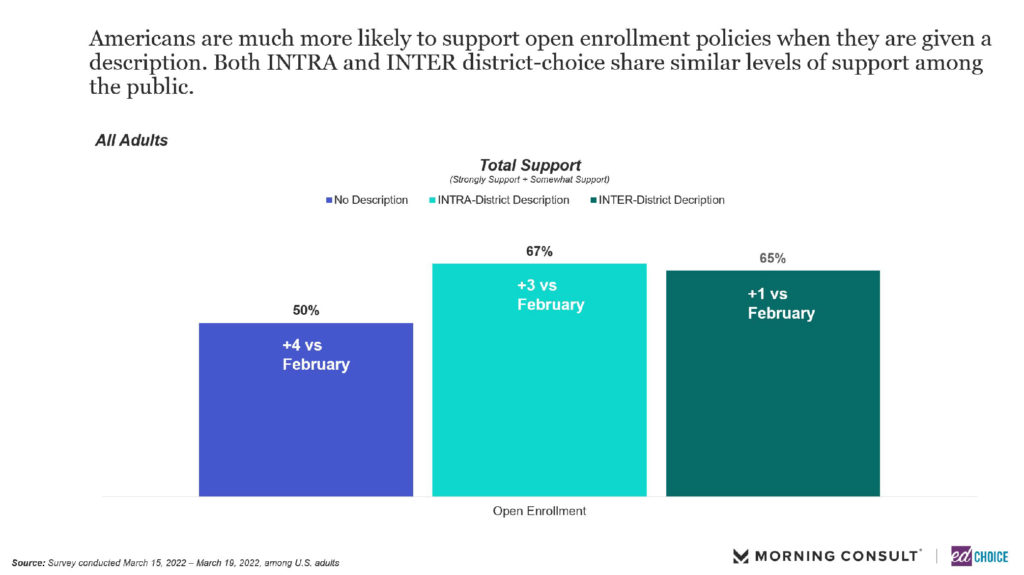
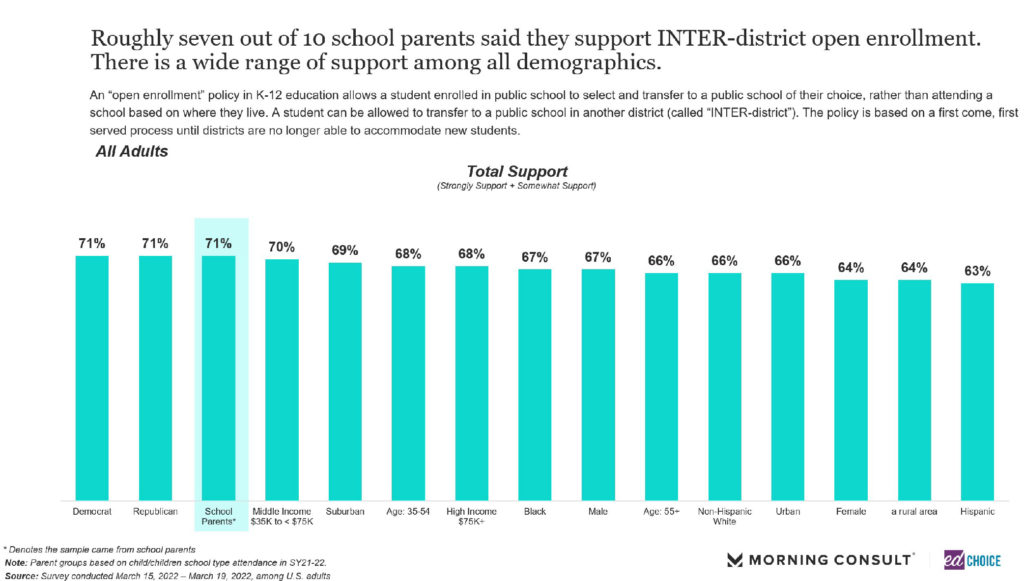
5. Open enrollment, like other school choice policies, enjoys majority support among parents and the general population. For only the second time in our polling, we asked about intra-district choice, a policy that allows students to choose between traditional public schools within the boundaries of their local school district, and inter-district choice, a policy that allows students to choose between traditional public schools outside the boundary of their local school district.
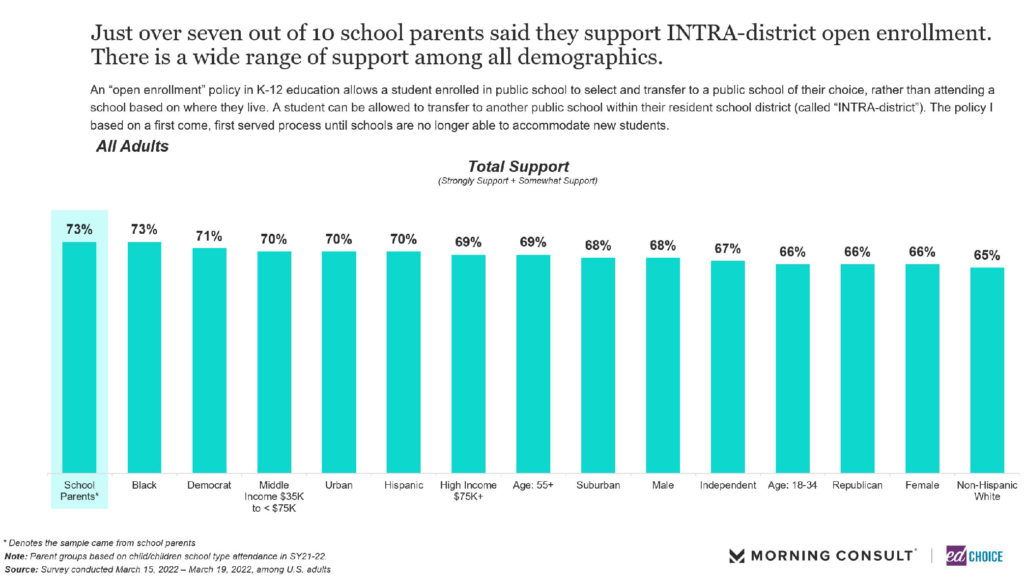
For both intra- and inter-district open enrollment, more than 70 percent of school parents supported each open enrollment policy. Inter-district open enrollment enjoys bipartisan support, with both Democrats and Republicans among the highest supporters at 71 percent. Intra-district open enrollment is slightly more popular, with support growing a touch higher from February than inter-district open enrollment support.
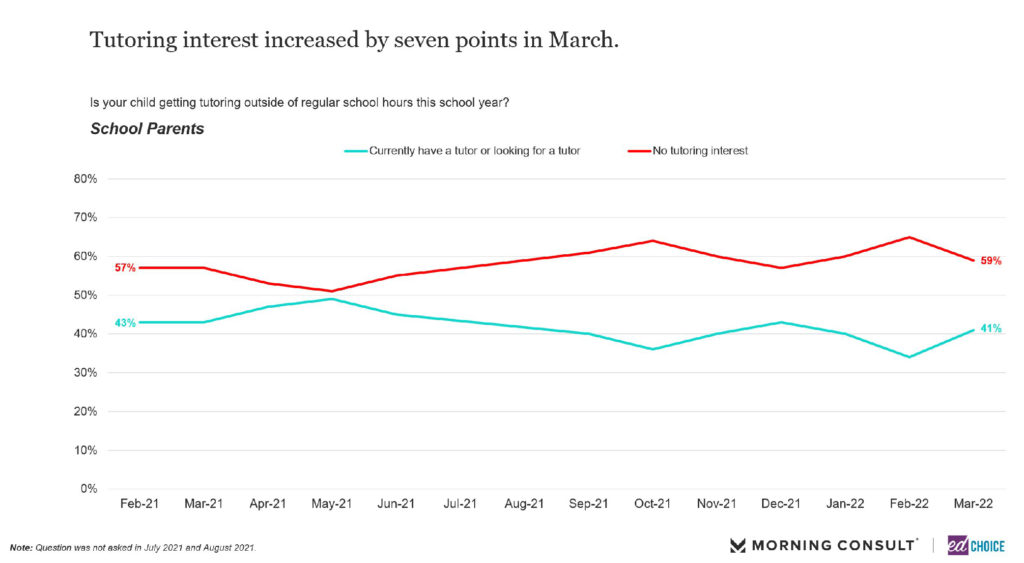
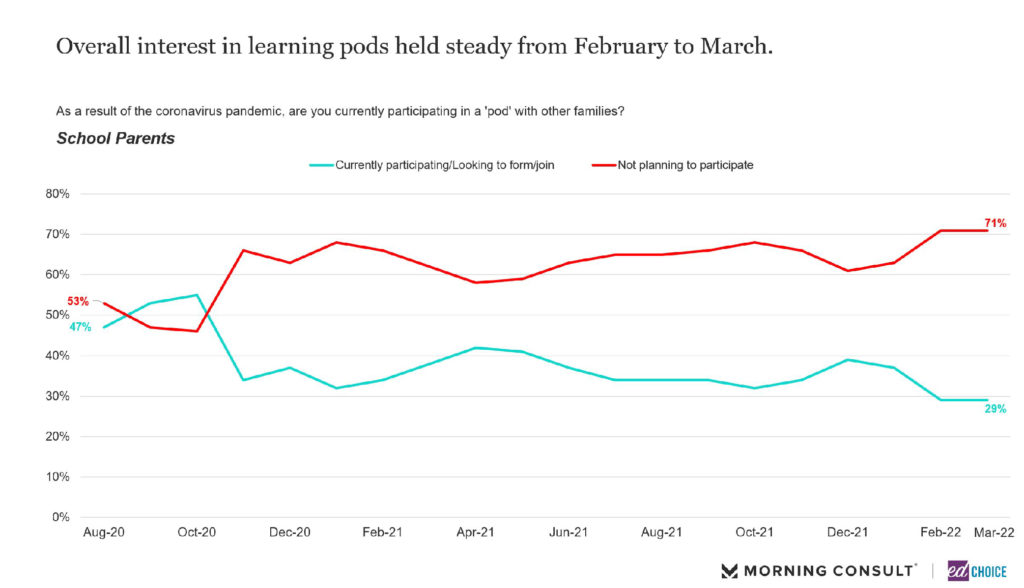
5. Interest in tutoring increased by 7 points in March, while learning pod interest held steady at its lowest level to date. While February saw the lowest proportion of parents reporting tutoring interest to date, tutoring interest increased significantly in March to more than 40 percent of parents. Hispanics, Democrats and Southerners were the groups who reported the biggest jumps in tutoring interest. The same growth cannot be touted for another form of alternate learning, learning pods. Leaning pod interest remained at its lowest level since the question was first asked in August 2020. Since December of 2021, learning pod interest has dropped more than 10 percentage points.
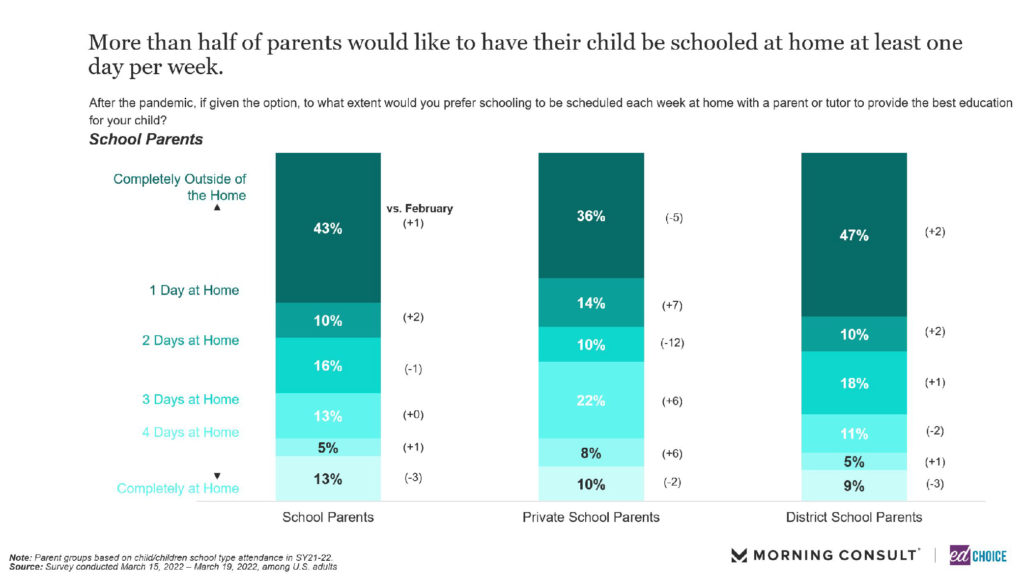
The ideal schooling location of parents provides additional interesting data. Private school parents have consistently preferred to have their child schooled at home at least one day per week compared to other groups of parents. In February, however, the ratio of private school parents who preferred to have their child’s schooling occur at home at least once per week fell 13 points to nearly the same level as district school parents at that time. In March, this ratio returned to the trends we observed previously, as more than 60 percent of private school parents preferred to have their child schooling occur at home at least one day each week.
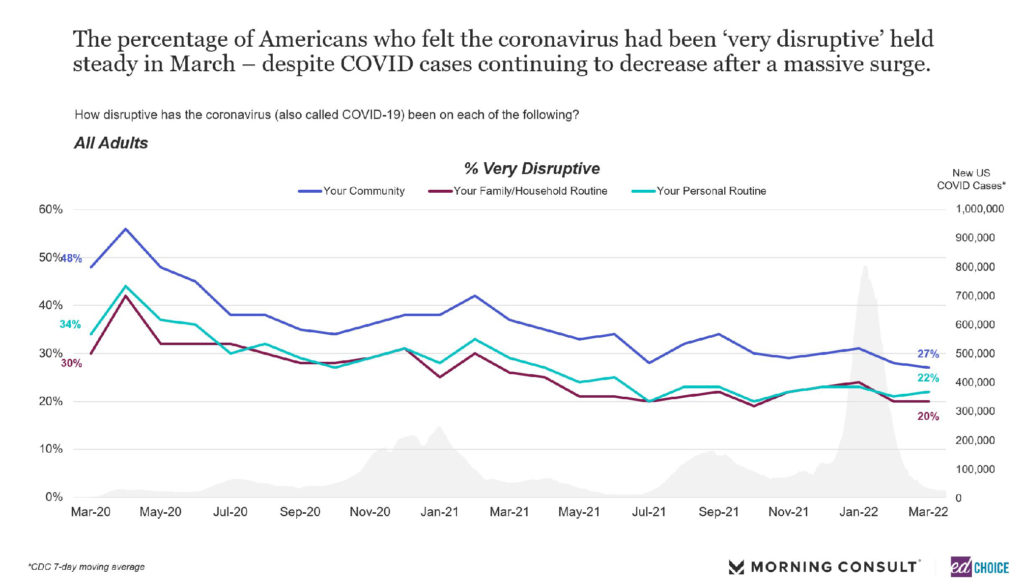
7. COVID-19 concerns continue to drop in March. When our nation’s COVID-19 cases experience a decrease, so does pessimism toward the pandemic from parents and the general public. When it comes to the pandemic’s interaction with daily life, the percentage of adults who view COVID-19 as “very disruptive” has fallen to some of the lowest levels since the question was first asked in March of 2020. Adults who feel the pandemic has been “very disruptive” on their community has reached its lowest level since March 2020, 27 percent.
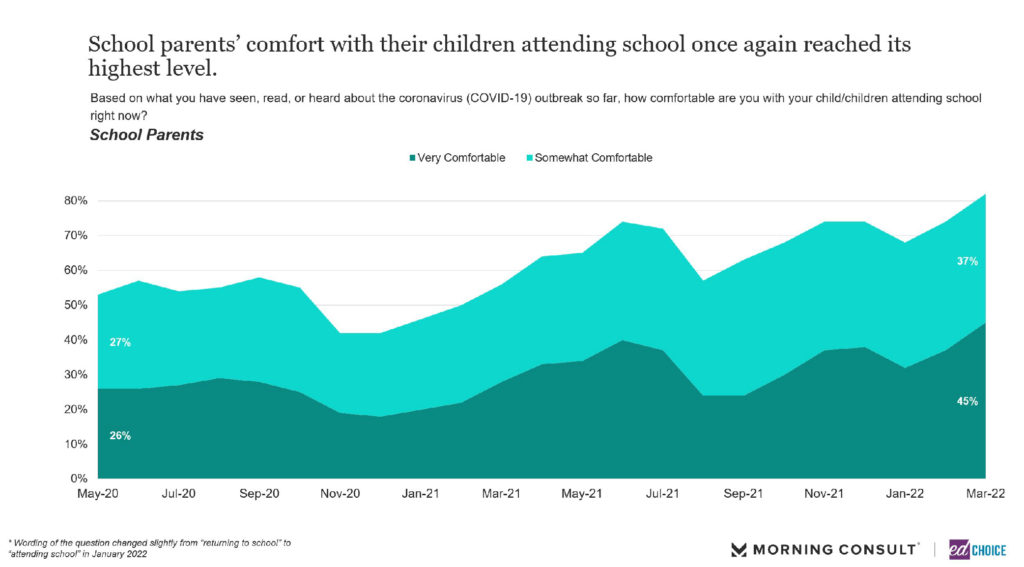
Echoing these sentiments, more than 8 out of 10 parents report being comfortable with their children attending school. Not only is that an 8-point increase since February, but the percentage of parents comfortable with their children attending school is at its highest level since we began tracking the ratio.
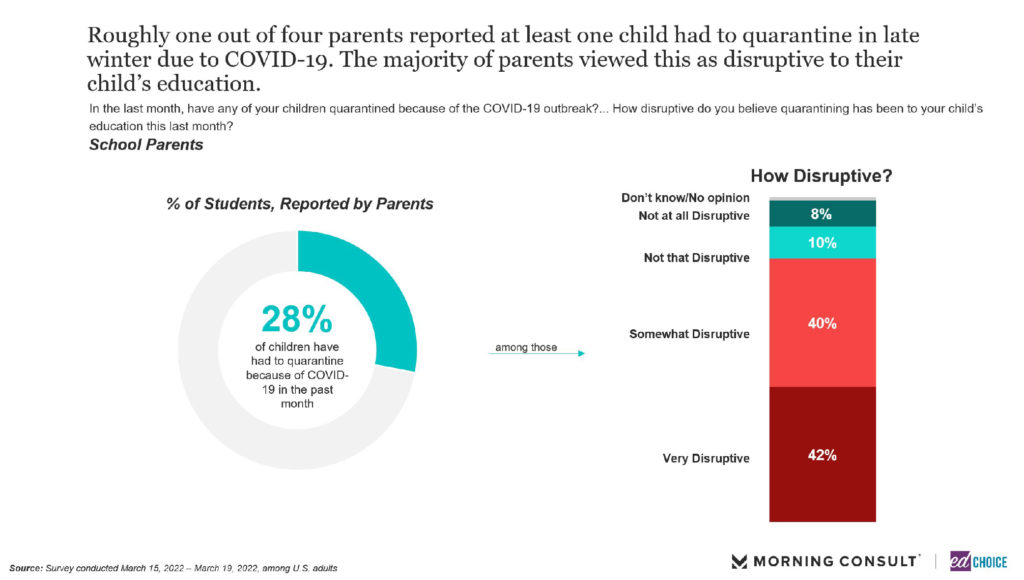
Additionally, we see a decrease in the number of parents who reported their child having to quarantine over the last month due to COVID-19. One-fourth of parents reported their child having to quarantine in the last month, a 10-point decrease from February.
Visit the EdChoice Public Opinion Tracker site to access past reports, crosstabs, questionnaires, and our national and state dashboards. All are updated monthly. We also provide a more in-depth description of our research and survey methods.
Our K–12 education polls archive is updated on a rolling basis, roughly a few times each month. Please don’t hesitate to let us know if we are missing any surveys, or if there are accidental errors.