EdChoice Public Opinion Tracker: Top Takeaways November 2022
November is a singular month for America’s classrooms. In even-numbered years like this one, the last gasps of election season consume the first week (or two). November also sees the beginning of holiday season busyness, and while often joyous, it can sometimes translate to a little added stress in the classroom. As we approach the midway point in the 2022–23 academic year, this is as good a time as any to take a pulse of Americans’—and especially parents’—perspectives on K–12 education.
In partnership with Morning Consult, we surveyed a nationally representative sample of American adults 18 and older (N = 2,201) from November 10-14, 2022. With additional sampling, we obtained responses from 1,098 parents of children currently in K–12 education. We asked a variety of questions about K–12 education, parents’ experiences of their children’s education, their perception of school choice issues and plenty other education topics. We also introduced several new questions this month, particularly about perceptions of academic performance, that offer new insights into how Americans are experiencing K–12 education right now.
The full report is here, but to pique your interest, here are eight major takeaways from the November 2022 edition of our public opinion tracker:
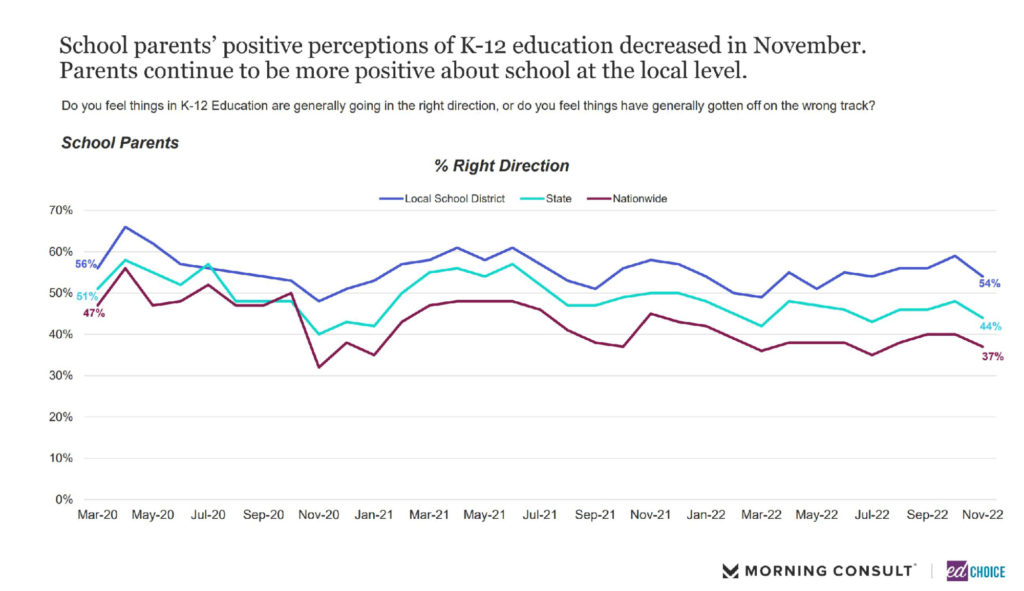
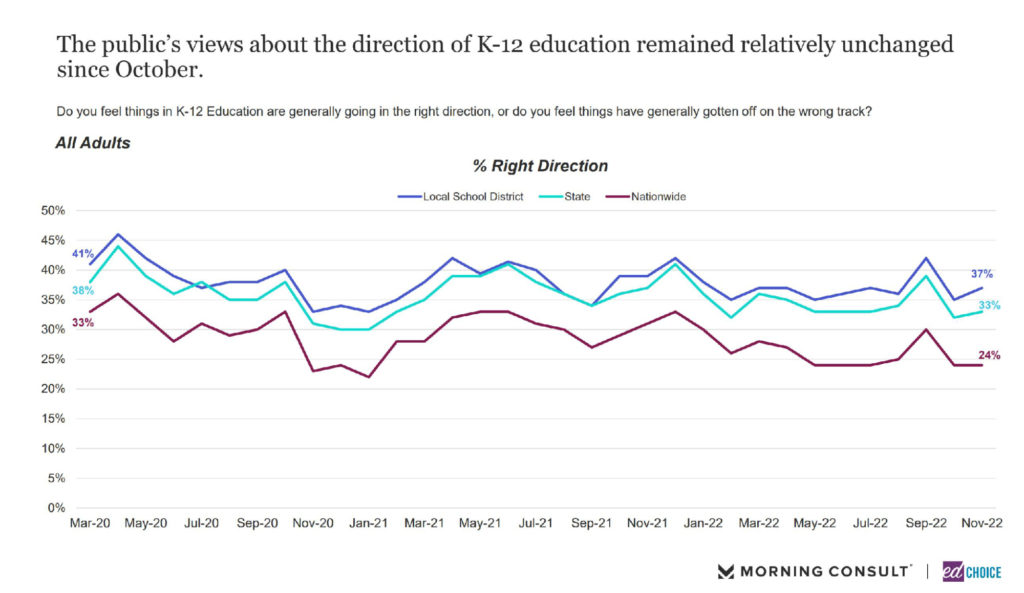
1. Parents’ optimism about the general direction of K–12 education has tapered somewhat. Since March, parents have been steadily more likely to say that K–12 education in their local school district is heading in the right direction rather than the wrong track. November saw the first declines in optimism about education locally, statewide and nationally since July. While the general population consistently is less positive about K–12 education than school parents, they did grow slightly more optimistic about education locally and statewide.
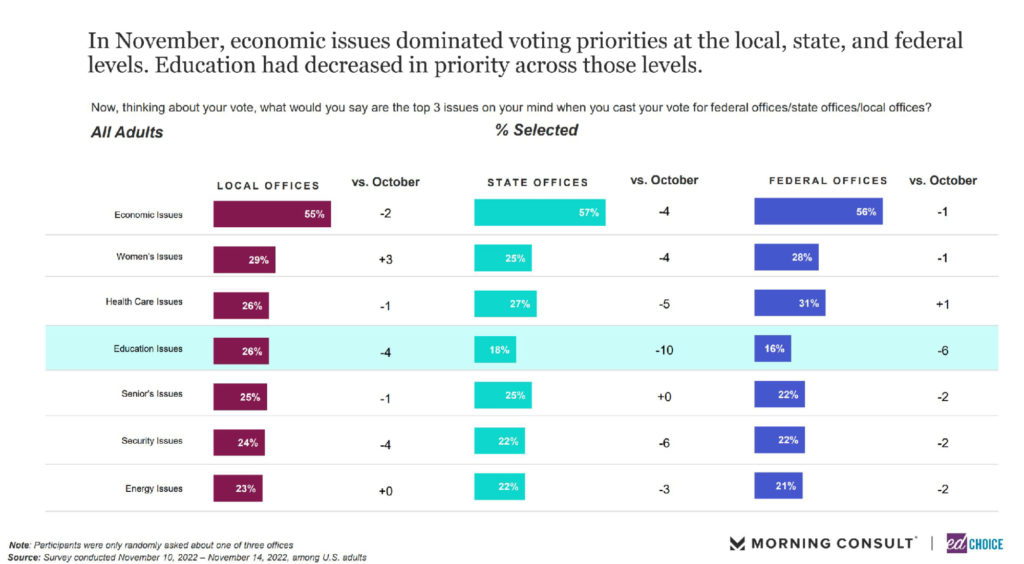
2. Education became a less meaningful issue to voters. When considering who they would vote for in local, state, and federal elections, fewer people considered education one of the three most relevant issues to consider in November compared to October. Consistent with previous waves, respondents were most likely to consider education a top three issue for local elections. While education issues were comparable to other topics regarding state elections, the share of people who said education was a top-three issue declined ten percentage points from October to November, dropping from 28 percent to 18 percent. This total means education was the least-selected issue for state elections in November. The same held true for federal elections, though that also was the case in October. Economic and healthcare issues were the two most-considered topics for federal and state elections, while economic and women’s issues topped the chart for local elections.
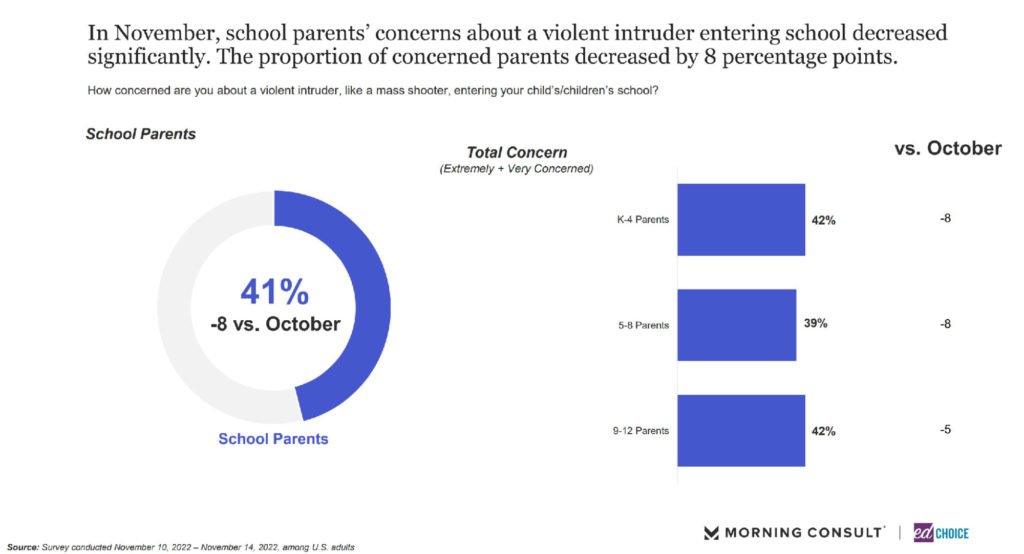
3. Parents are somewhat less concerned about violent intruders at their school than they have been in recent months. After the tragedy in Uvalde this past May, we began asking parents how concerned they were about a violent intruder, namely like a mass shooter, entering their children’s schools. About half of parents have expressed they were “extremely” or “very” concerned since June. In November, 41 percent of parents expressed this level of concern, 8 percentage points lower compared to October. While this is a notable drop given recent trends, it may be notable that two out of five parents remained highly worried about their children’s safety in this area.
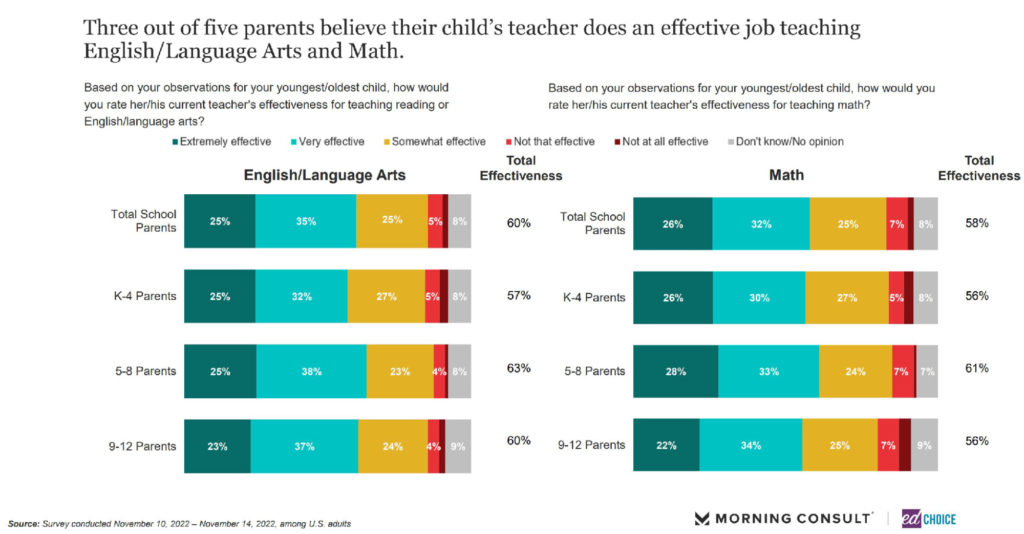
4. Parents are generally as confident about their children’s teachers’ capacity to teach math as they are for language arts. In a new pair of questions we asked in November, we asked parents how they would rate their child’s teacher’s effectiveness at teaching English language arts (ELA) and math. In both cases, and across children’s grades, a majority of parents thought the teachers were “extremely” or “very” effective. While confidence was slightly lower for math than ELA, the difference was within the margin of error and negligible. Fewer than one out of ten parents think their teachers’ children are “not that effective” or “not at all effective.”
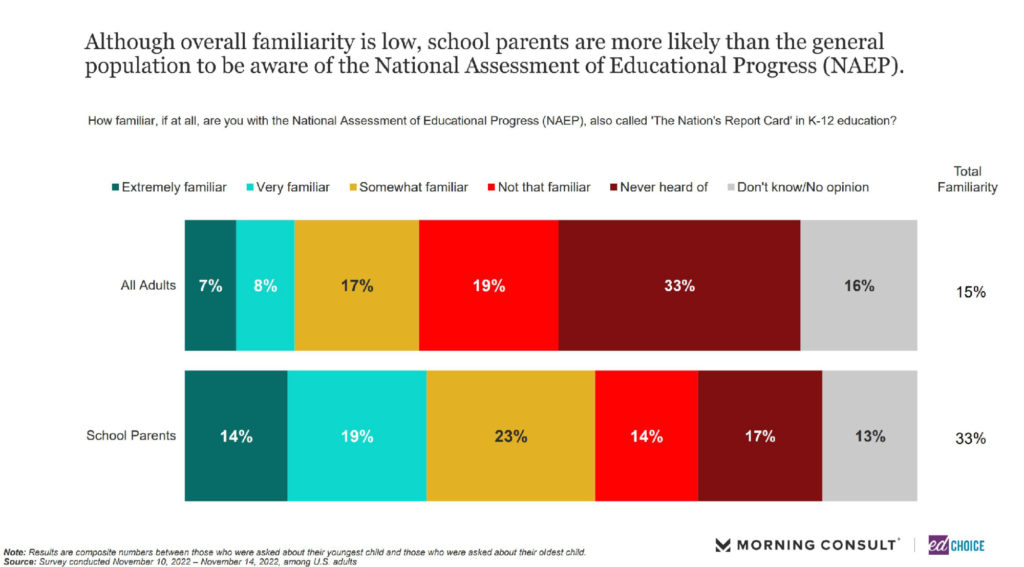
5. The public doesn’t know about NAEP. The National Assessment of Educational Progress, or NAEP, is a Congressionally-mandated standardized test administered by the National Center for Education Statistics (NCES) at the U.S. Department of Education. This fall, NCES reported dramatic declines in math and ELA scores.
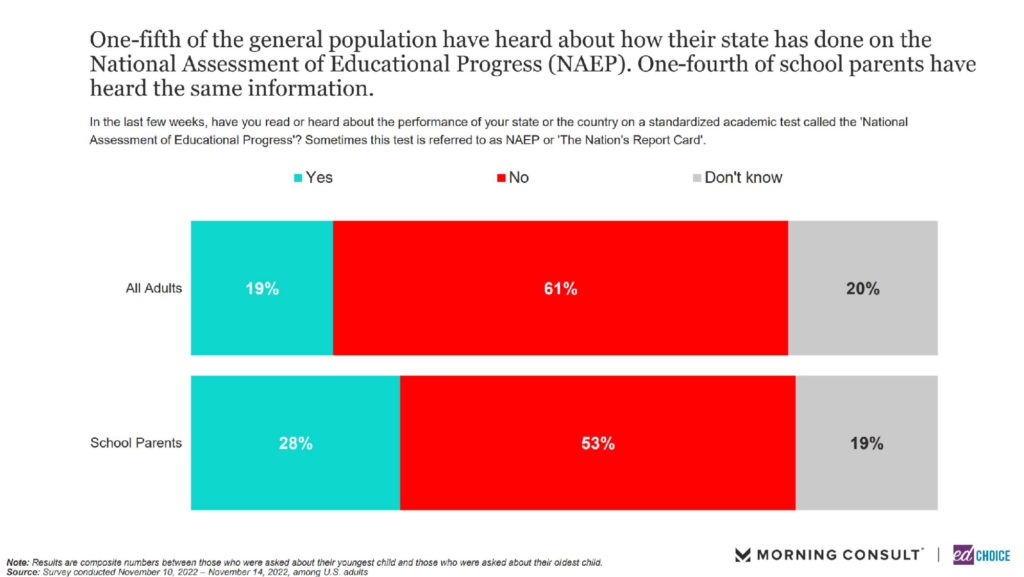
We asked parents and the general population how familiar they were with NAEP. Less than a third (32%) of all respondents were at least “somewhat” familiar with NAEP, while more than half (56%) of parents said the same. Taking away “somewhat familiar” responses, parents (33%) are more than twice as likely than the general population (15%) to be at least “very” familiar with NAEP. Similarly, parents (28%) were more likely than the general public (19%) to have read or heard about the poor NAEP scores this year, though both groups were much more likely to have not heard of the declines.
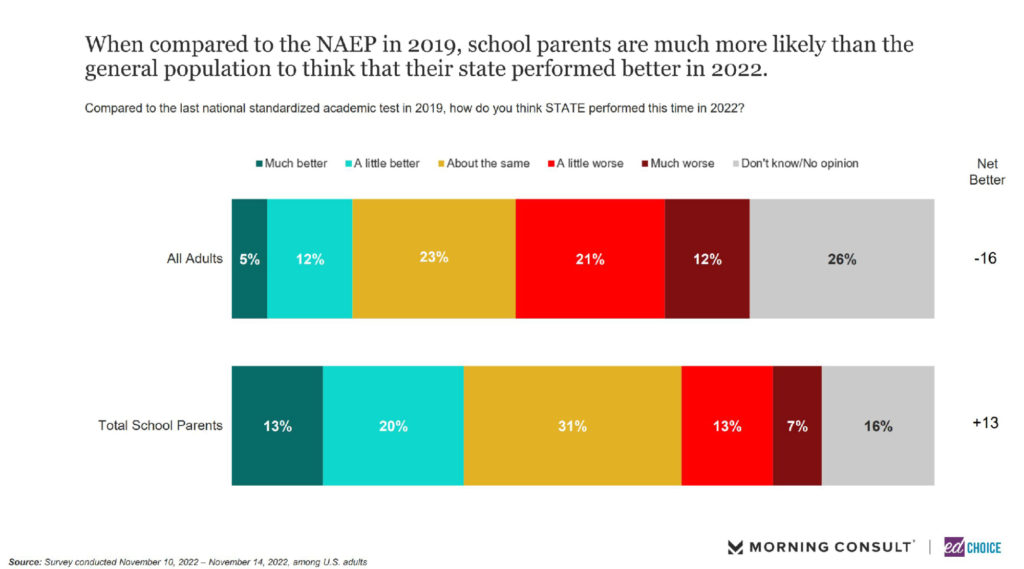
6. Parents are more likely than not to think their state performed better academically in 2022 compared to 2019. Most states have seen declines in fourth- and eighth-grade reading since 2019, according to NCES. Almost all states that did not decline saw no changes in average scores . Parents are more optimistic about their state’s academic performance than the numbers bear out. One out of three parents (33%) thought their state performed better on the national standardized academic test (meaning NAEP) in 2022 than 2019, and 20 percent thought it did worse. The general public’s estimations are a bit closer to reality. A third (33%) thought their state performed worse in 2022 than it did in 2019, while 17 percent thought their state improved.
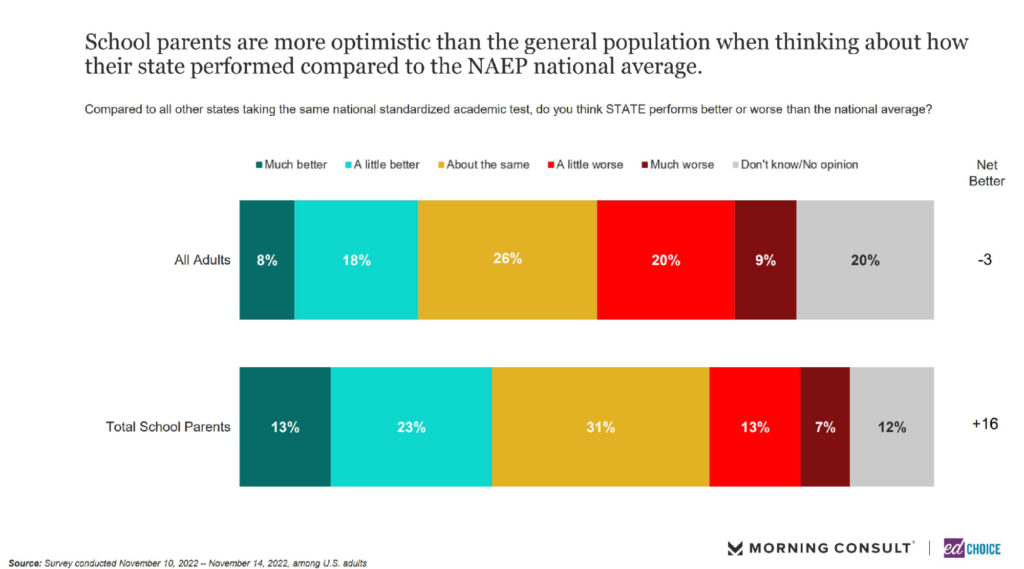
In addition to being more optimistic than the general public about their state’s academic performance relative to previous years, parents also are more likely to think their state performs better than the national average. Parents were 16 percentage points more likely to think their state performed better on the NAEP test than the national average, while the pool of all respondents were more likely than not to think their state was worse than average.
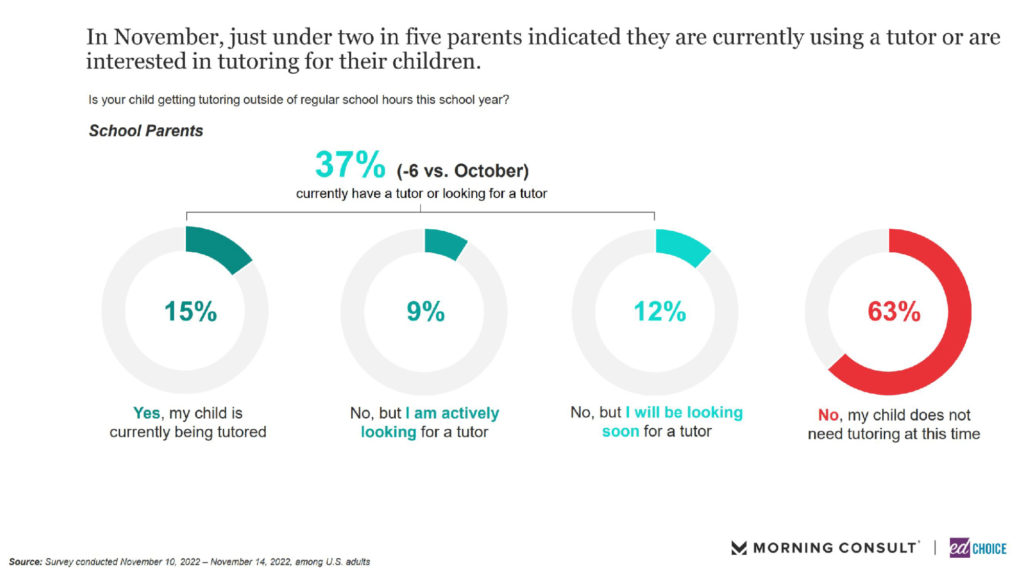
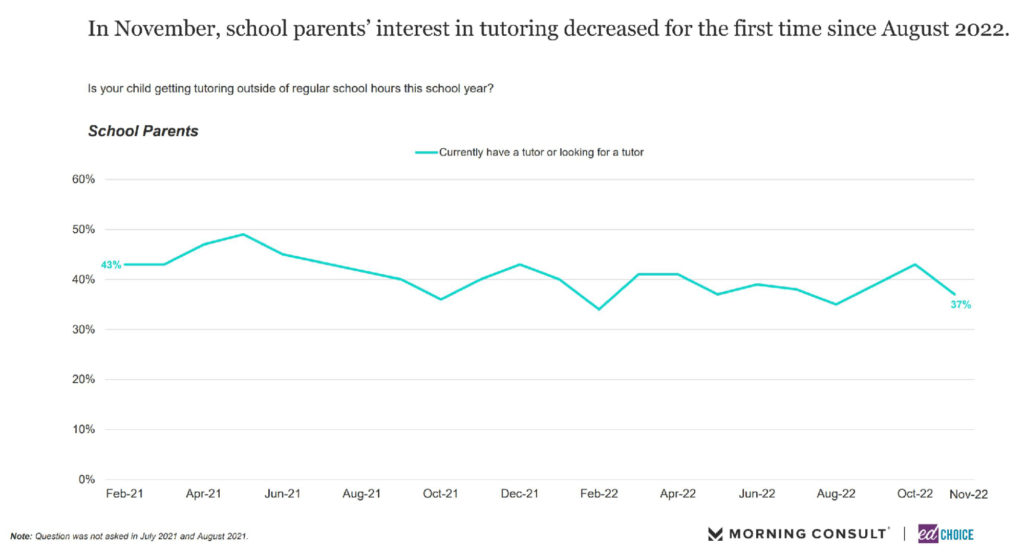
7. Tutoring interest has not changed much over the last year. Since Fall 2021, the share of parents indicating their children are receiving tutoring or that they are interested in getting tutoring for their children has hovered around 40 percent. While there have been some notable month-to-month changes, there has not been a traceable structural shift in tutoring interest in some time. Recently, tutoring interest rose consecutive months from August to October and declined six percentage points from October to November.
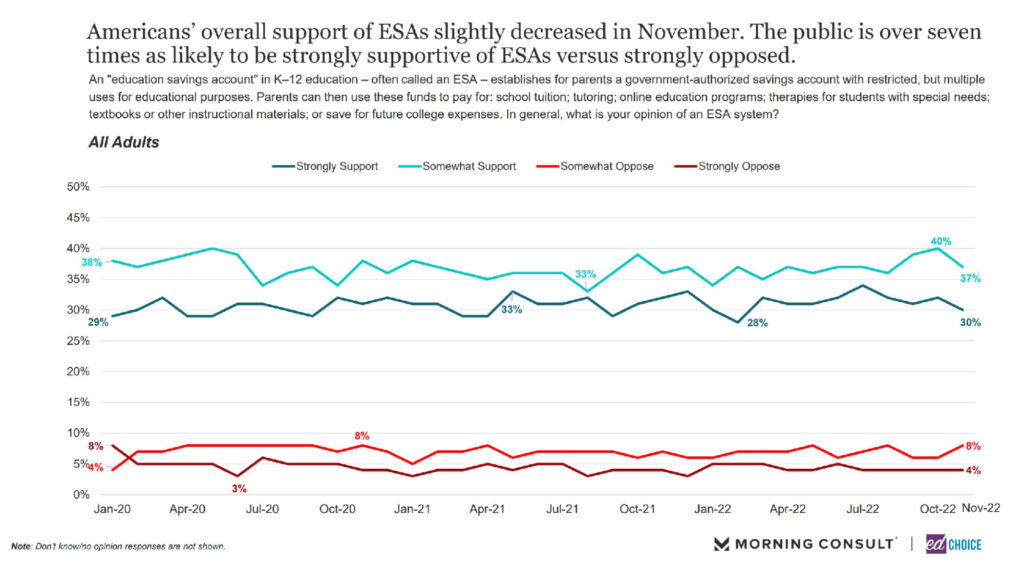
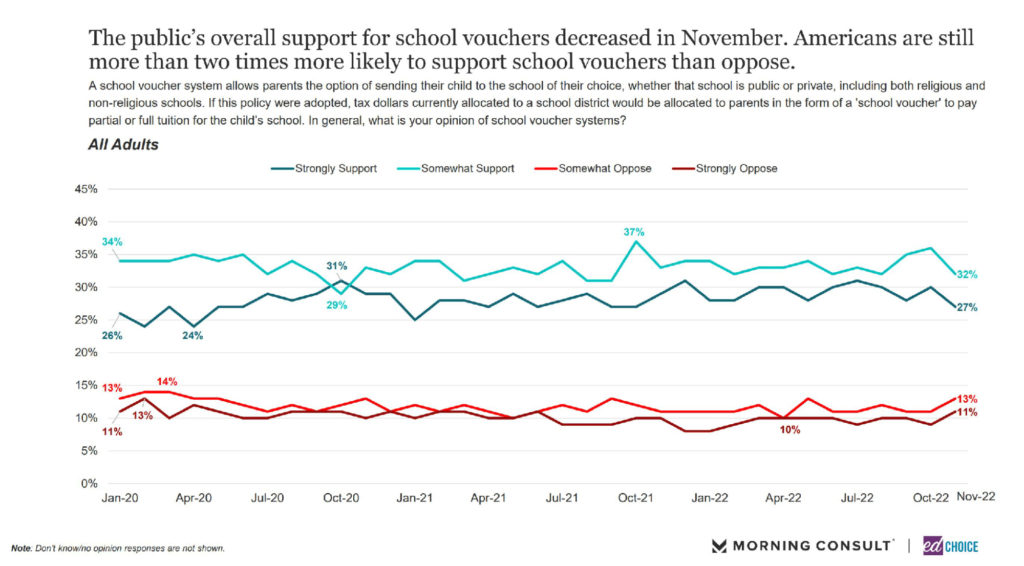
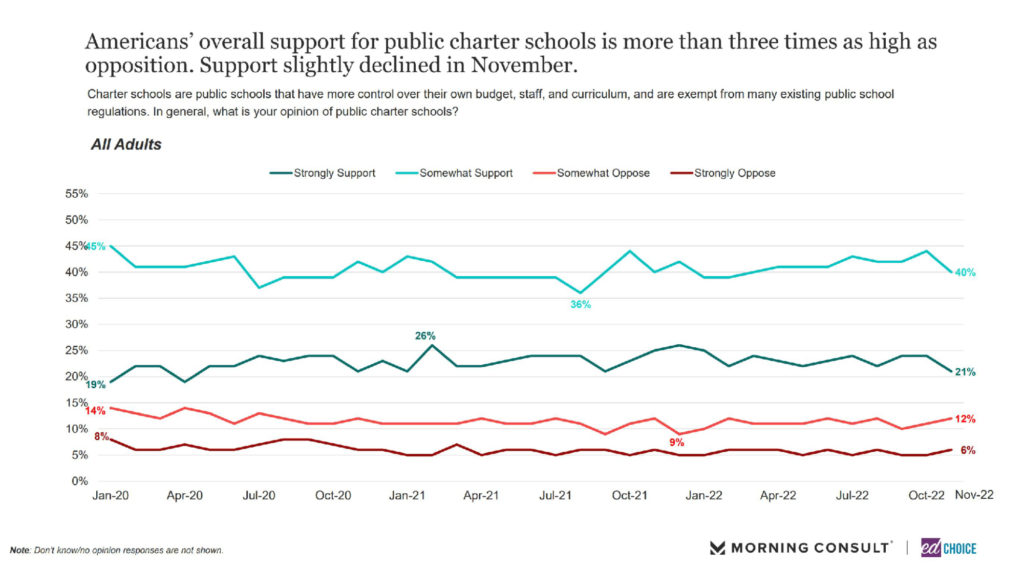
8. Majority support among the general public for three major school choice policies weakened slightly in November. Support for education savings accounts (ESAs) among the general public has consistently hovered just above two-thirds since we began our public opinion tracker, give or take a few points. After rising a few percentage points in the early fall months, support for ESAs dropped five percentage points in November to 67 percent. Support for school vouchers has had slightly more variability over time, but public support has generally hovered around 60 percent. After October saw the highest level of public favor toward school vouchers, total support dropped seven percentage points in November, to 59 percent. Charter schools tend to hover around 65 percent support but have seen spikes and dips over our monthly polling history. November saw the lowest general public support for charter schools in 2022, with favor reaching 61 percent. With opposition to ESAs consistently below 15 percent, opposition to charter schools consistently below 20 percent, and opposition to vouchers consistently below 25 percent, the appeal of these major school choice policies is by no means in jeopardy.
Visit the EdChoice Public Opinion Tracker site to access past reports, crosstabs, and questionnaires. We update our national and state dashboards every month. We also provide a more in-depth description of our research and survey methods.
Our K–12 education polls archive is updated on a rolling basis, roughly a few times each month. Please don’t hesitate to let us know if we are missing any surveys, or if there are accidental errors.