EdChoice Public Opinion Tracker: Top Takeaways October 2022
With election season upon us, it is as important as ever to get a pulse of public sentiment around K–12 education. The EdChoice Public Opinion Tracker has been offering that every month since Jan. 2020, and a new wave just published on our tracker website.
In partnership with Morning Consult, we surveyed a nationally representative sample of American adults 18 and older (N = 2,200) from October 7–9, 2022. With additional sampling, we obtained responses from 1,127 parents of children currently in K–12 education. We asked a variety of questions about K–12 education as a whole, parents’ experiences of their children’s education, their perception of school choice issues and plenty other education topics. October saw a number of new questions introduced that offer new insights into how Americans are experiencing K–12 education right now.
Here are seven major takeaways from the October 2022 edition of our public opinion tracker:
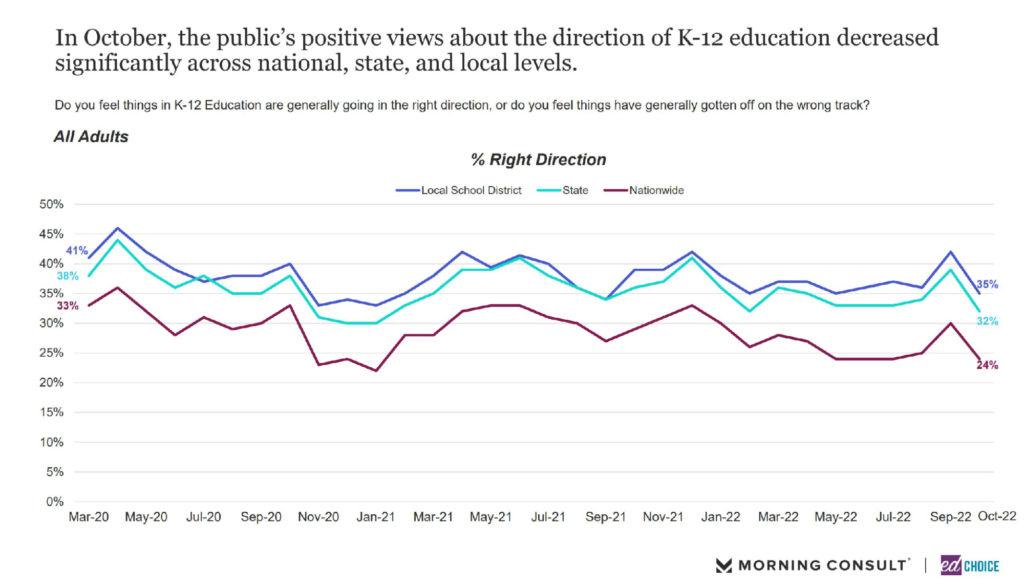
1. Parents are again growing more optimistic about the direction of K–12 education. Without exception, parents have been more optimistic about how K–12 education is going on local, state and national levels than non-parents. Since March, the share of parents optimistic about education in their local school district has grown from about 50 percent to about 60 percent. Optimism about state and national education has also grown during this period, though to a lesser magnitude. Looking at the general population, which includes non-parents, the share of people who feel education is heading in the right direction has remained at roughly the same levels since summer began, and somewhat lower than they were in March.
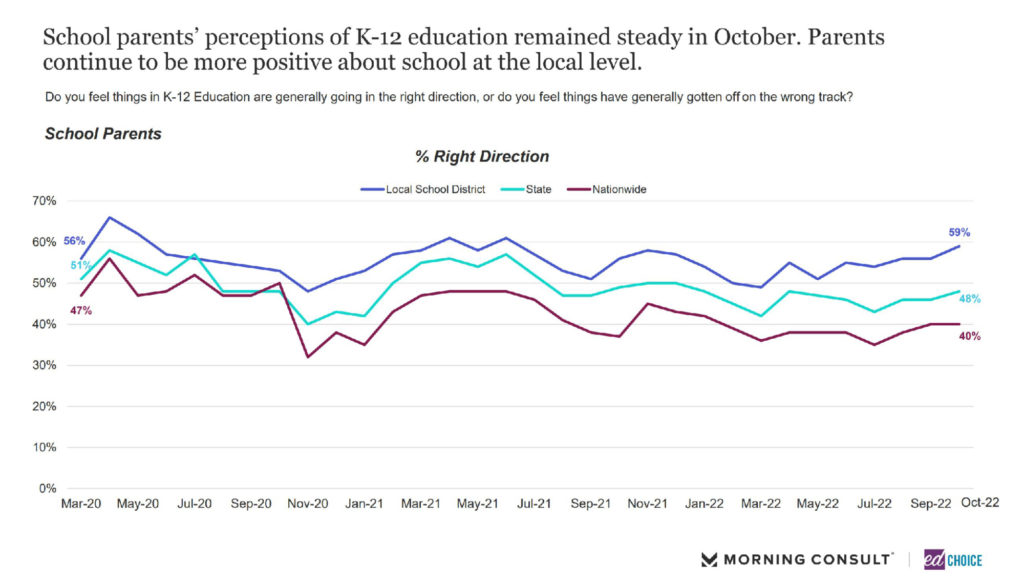
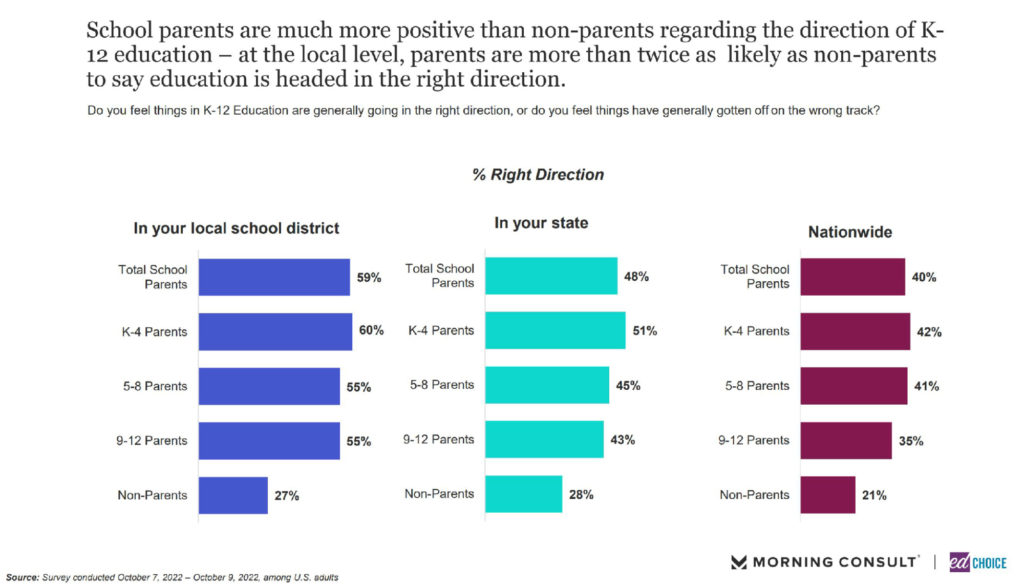
The perceptions of parents and non-parents have deviated so substantially over the last seven months or so that parents are now roughly twice as likely as non-parents to say K–12 education is heading in the right direction locally and nationally.
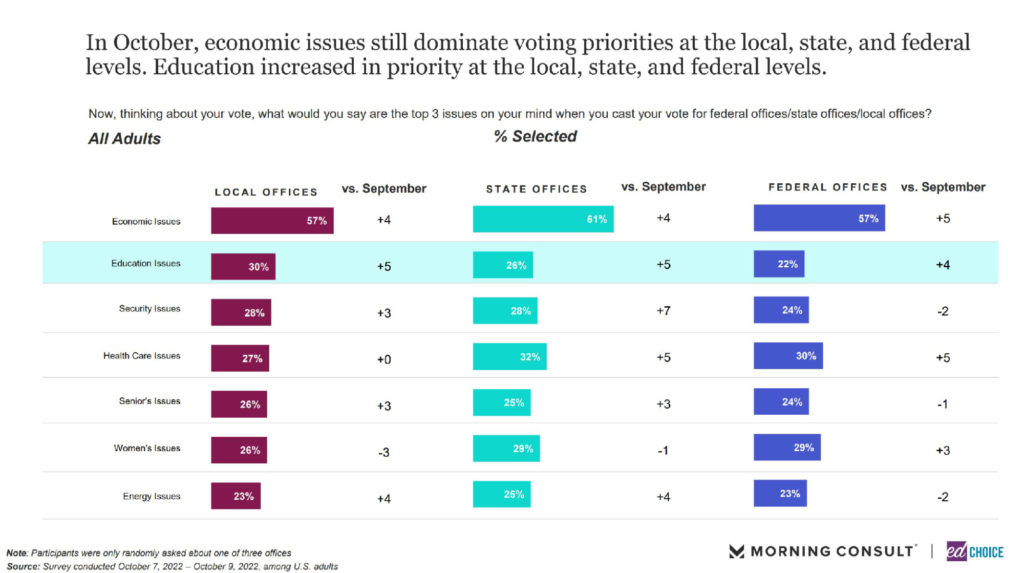
2. Education is the second-most important issue for Americans ahead of local elections. We asked respondents what three political issues were most important to them regarding voting this election season. We randomized whether respondents were asked about local, state, or federal elections. As usual, economic issues easily were the most commonly cited issue Americans considered for elections at all levels. For local elections, education issues were the second-most cited issue, with 30 percent of respondents indicating it was a top issue affecting their vote. For federal elections, however, education issues ranked last out of the seven issues we presented, with 22 percent of people ranking it in their top three.
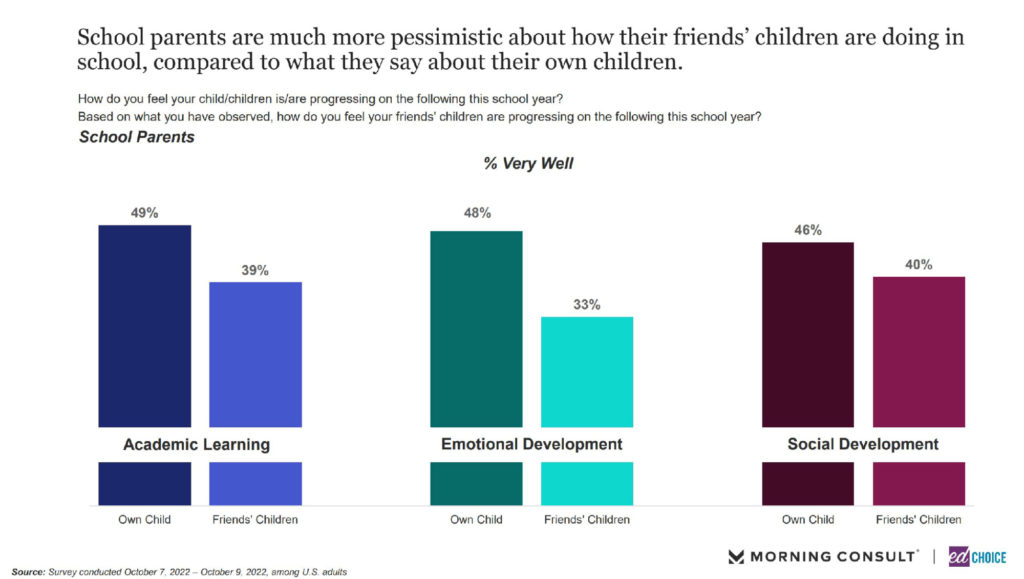
3. Parents are more optimistic about their children’s educational development than they are for their friends’ children. Since early summer, a little less than half of parents have felt that their children are progressing “very well” academically, emotionally and socially, a much higher share than we had seen in years prior. Last month, we learned that informing random respondents about the learning loss captured by the most recent National Assessment of Educational Progress (NAEP) scores had a negligible effect on parents’ perceptions of their children’s development. In October, in addition to asking parents about their children’s development, we asked parents how they felt their friends’ children are doing. Parents are 10 percentage points less likely to think their friends’ children are developing very well academically, and they are 15 points less likely to think their friends’ children are developing well emotionally. Parents also are six points less likely to think children of their friends are developing well socially.
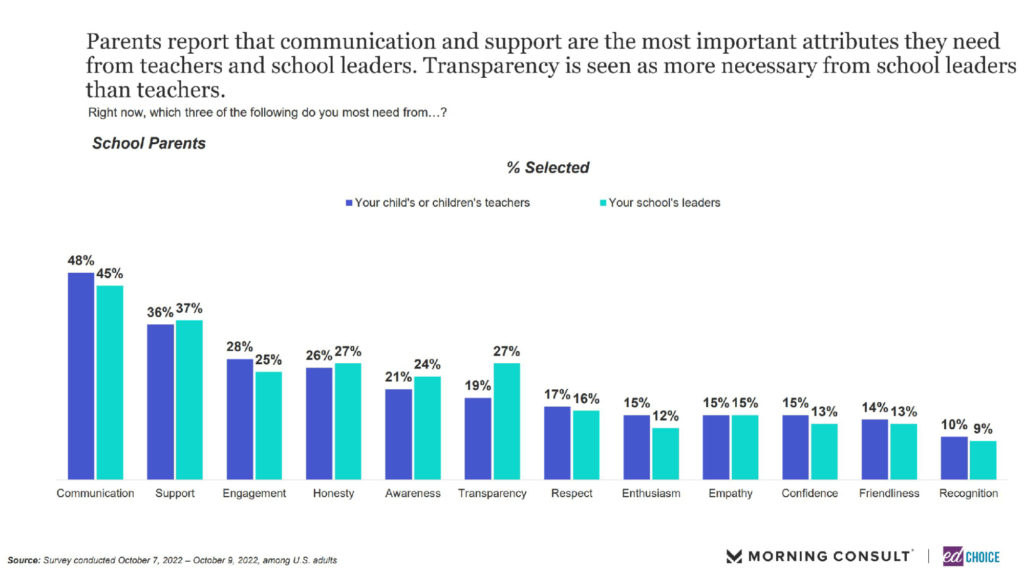
4. Parents most value communication and support from school staff and faculty. We presented parents with 12 possible traits of their children’s teachers and school leadership, and we asked them to identify the three traits that were most important to them at the time. For both teachers and school leadership, communication (48% and 45%, respectively) and support (36% and 37%, respectively) were clear first and second vote-getters. Engagement was the third most-important trait for teachers at 28 percent, while honesty and transparency were tied for the third-most desired trait for school leadership with 27 percent.
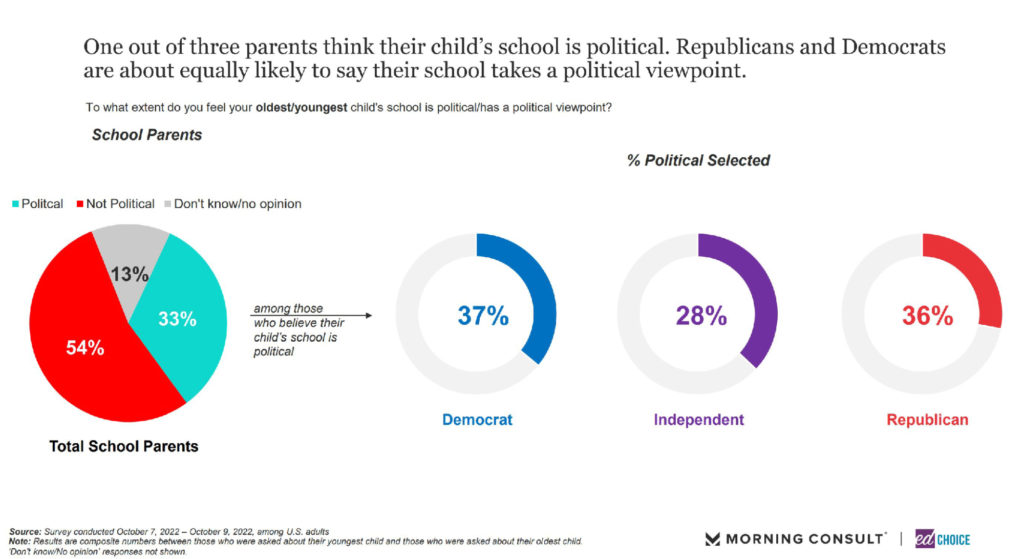
5. A third of parents feel their children’s schools are political. We asked parents if they felt their child’s school is political or has a political viewpoint. Most parents (54%) said no, they did not think the school was political. Another 13 percent of parents said they didn’t know or had no opinion. The remaining third (33%) of parents said the school was political. Parents who believed their child’s school was political essentially were no more or less likely to identify as a Democrat (37%) or Republican (36%).
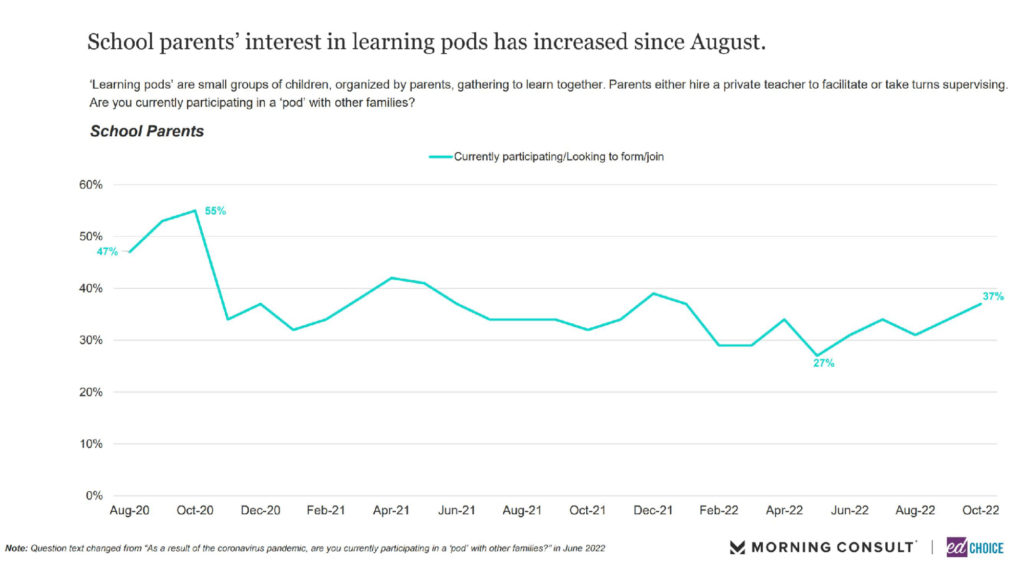
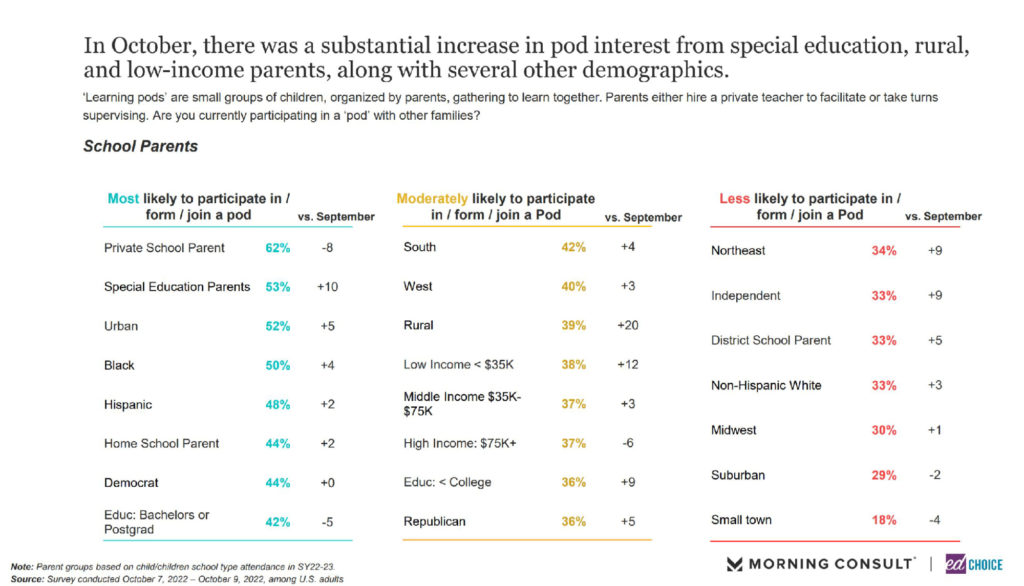
6. Learning pod interest is on the rise again. Since May, the share of parents who said they are participating in or interested in joining or forming a learning pod grew 10 percentage points. At 37 percent, interest in learning pods has reached a level last seen in winter. As is frequently the case, special education parents, parents in urban areas, and Black and Hispanic parents were among the groups most likely to indicate interest in pods.
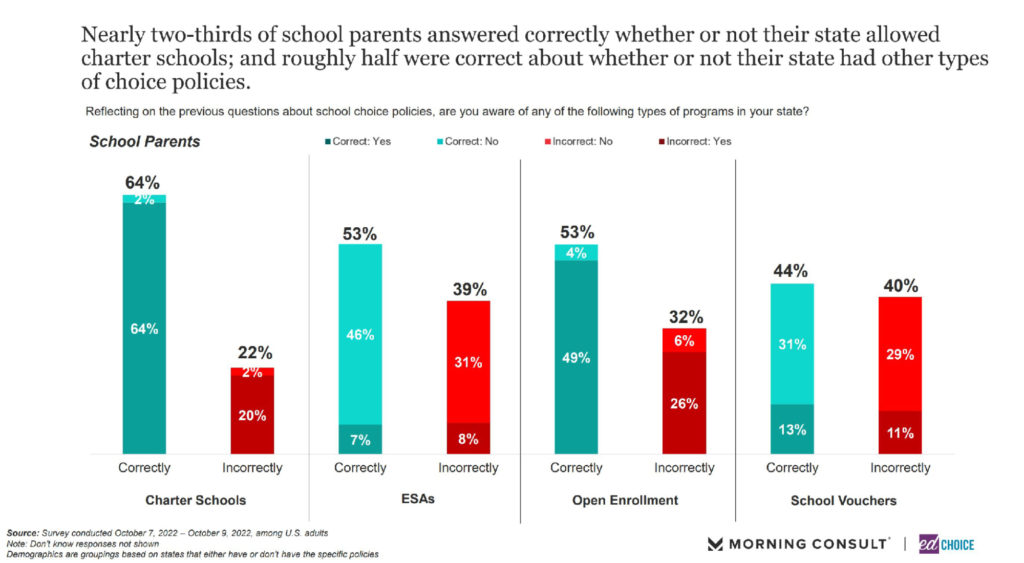
7. There is some confusion about what school choice policies are available in respondents’ states. Every month, we ask a series of questions about opinions on major school choice policies, define those policies, and then asking about opinions on those policies again. In October, we asked respondents whether they knew of such a policy existing in their state. About a quarter (27%) of respondents from states with education savings account (ESA) policies were able to identify that they lived in a state with an ESA program. However, 27 percent of people from states without ESAs also believed their state had such a policy. A similar story is seen for school vouchers. Just over a third (36%) of respondents from states with school vouchers indicated that their state had a voucher program, but only a slightly smaller share of respondents from states without a school voucher program (31%) thought their state had school vouchers. Open enrollment was recognized by only two out of five (39%) respondents who lived in states with open enrollment policies. Charter schools clearly easily were the most-known school choice option presented, as it is the only of the four policies to be recognized by more than half of respondents who live in states with charter school laws (60%). Still, 30 percent of respondents in the handful of states without charter school laws thought their states had charter schools.
Visit the EdChoice Public Opinion Tracker site to access past reports, crosstabs, and questionnaires. We update our national and state dashboards every month. We also provide a more in-depth description of our research and survey methods.
Our K–12 education polls archive is updated on a rolling basis, roughly a few times each month. Please don’t hesitate to let us know if we are missing any surveys, or if there are accidental errors.