Public Opinion Tracker: Teacher Survey Top Takeaways – June 2022
The average public school classroom has 21 students. The average state’s public schools spend about $12,500 per student each year. The average public school classroom, then, has about $262,500 tied to it.
You don’t have to talk to teachers long to know where the money is not going. For instance, even a brief scan of teacher-focused social media content can reveal how quickly needed classroom resources can outpace and outprice any budget a teacher might receive from their school. In fact, 87 percent of school districts have at least one teacher registered on DonorsChoose, a crowdfunding site, not to mention the countless teachers registered on GoFundMe or Adopt a Classroom.
In this latest wave surveying teachers (in the field June 15-25, N = 1,000), we at EdChoice dove into some of these classroom spending issues. We also asked questions about school choice policies, values about education, pay, and more. This post dives into some key findings from that survey.
Of note: This is the first survey of teachers we have fielded since the tragedy in Uvalde, Texas, and it entered the field about three weeks after the event. We included several questions about teachers’ perceptions and opinions about school safety. However, this post will not discuss those findings, as we have another post dedicated to the topic. Please see that article if you are interested in the opinions of teachers, parents, and the general public about school safety.
Here are eight key findings from our June 2022 survey of teachers:
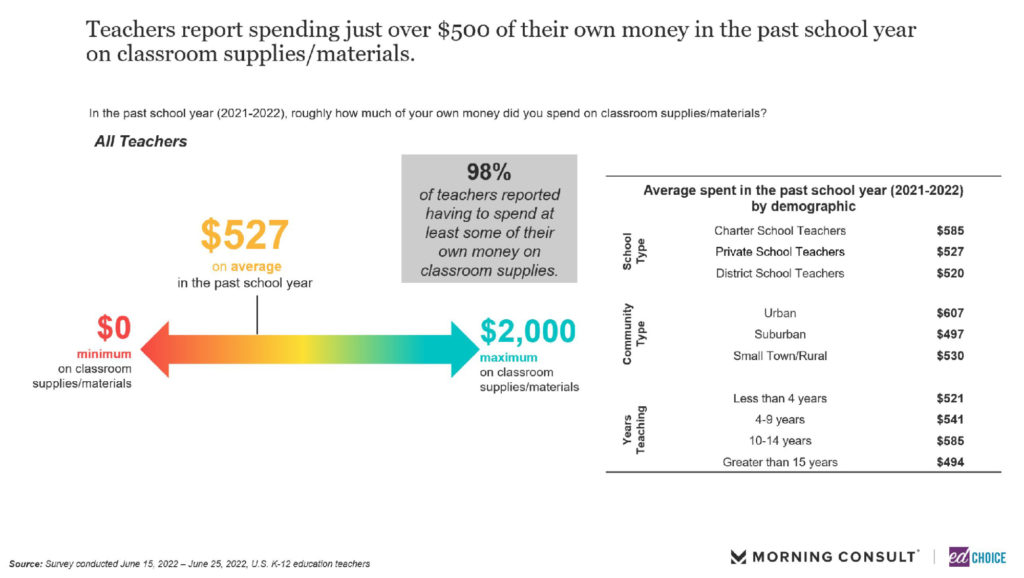
1. Almost all teachers spent their own money on classroom expenses this past year. We asked teachers to identify how much of their own money they spent on classroom expenses in the last year. This total would not include any grants or spending allowances offered by their schools. Among all the teachers in our survey, the average spending amount reported $527 dollars. Just two percent of teachers reported not spending any of their own money during the 2021-22 school year.
Teachers most commonly spent their money on various education supplies, with more than 70% purchasing student supplies, materials for organizing and decorating classrooms, and teaching supplies. More than half (57%) of teachers paid for instructional materials, while just under half (48%) bought books for their classroom. Relatively fewer teachers purchased lesson plans (36%) or technology (24%).
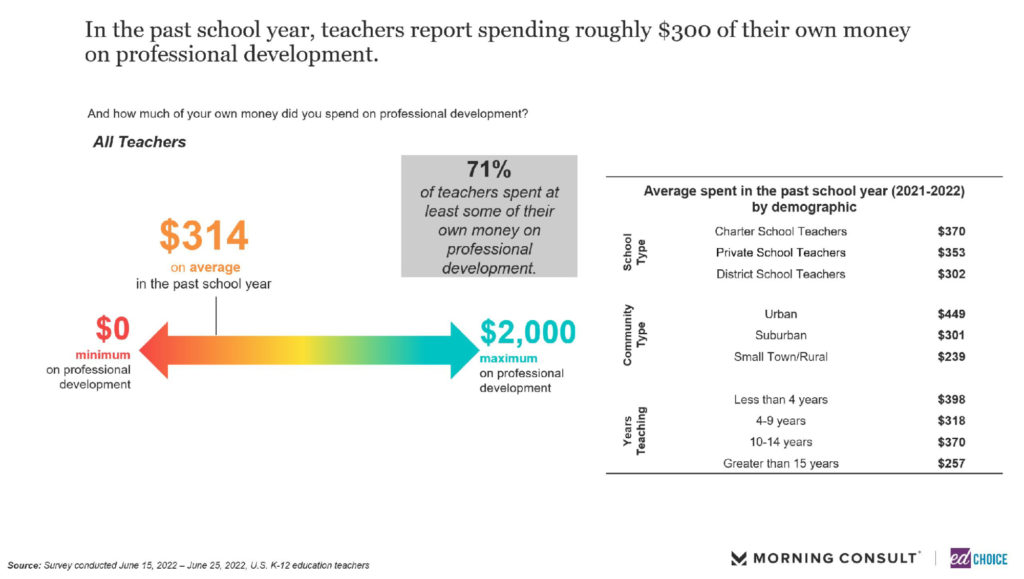
Teachers paid for more than just classroom expenses out of pocket—a strong majority of them also paid for professional development. Seventy-one percent of teachers indicated they spent their own money on professional development opportunities in the last year, with an average amount coming to $314. Most (61%) spent money on books or other reading materials. Just under half (44%) paid for courses. Others bought technology (31%), paid their way to conferences (28%), or purchased access to one-time webinars (26%).
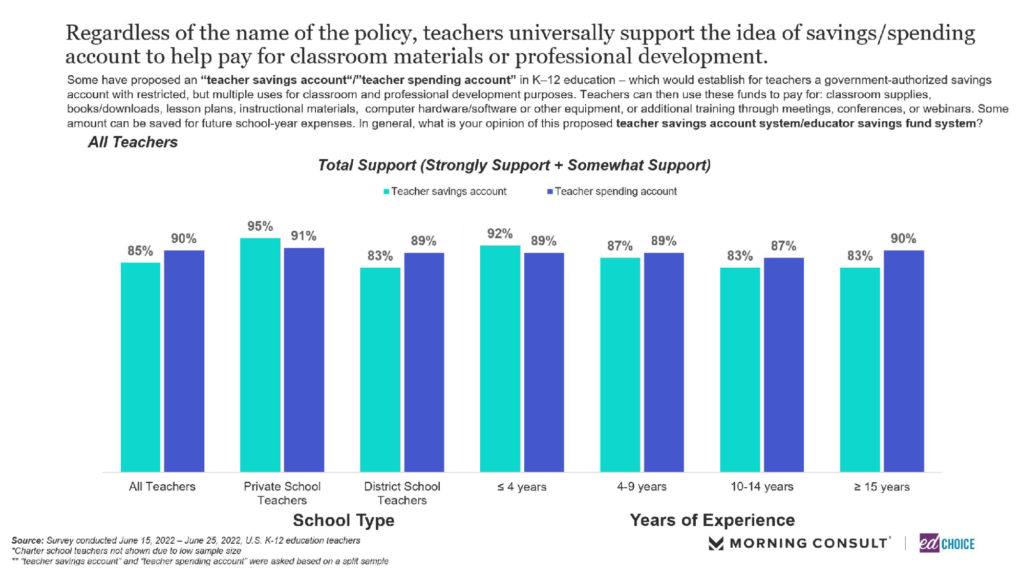
2. Educators overwhelmingly support publicly-funded teacher savings/spending accounts. We put forth an idea to teachers: they could receive a government-authorized savings account with restricted, but multiple uses for classroom and professional development purposes. Teachers could then use these funds to pay for classroom supplies, books or downloads, lesson plans, instructional materials, computer hardware or software, other equipment, or additional training through meetings, conferences, or webinars. Some amount could be saved for future school-year expenses.
We called such a policy proposal “teacher savings accounts” or “teacher spending accounts” (TSAs) and randomized which name respondents saw just in case either term – “savings” or “spending” – affected how teachers perceived the idea.
TSAs were incredibly popular among teachers, regardless of school type and regardless of the name of the idea. Ninety percent of teachers who were asked about “teacher spending accounts” favored the idea, while 85 percent of those who saw “teacher savings accounts” approved of the concept. Private school teachers were slightly more approving of the idea than public school teachers. Years of teaching experience had little bearing on favor toward TSAs.
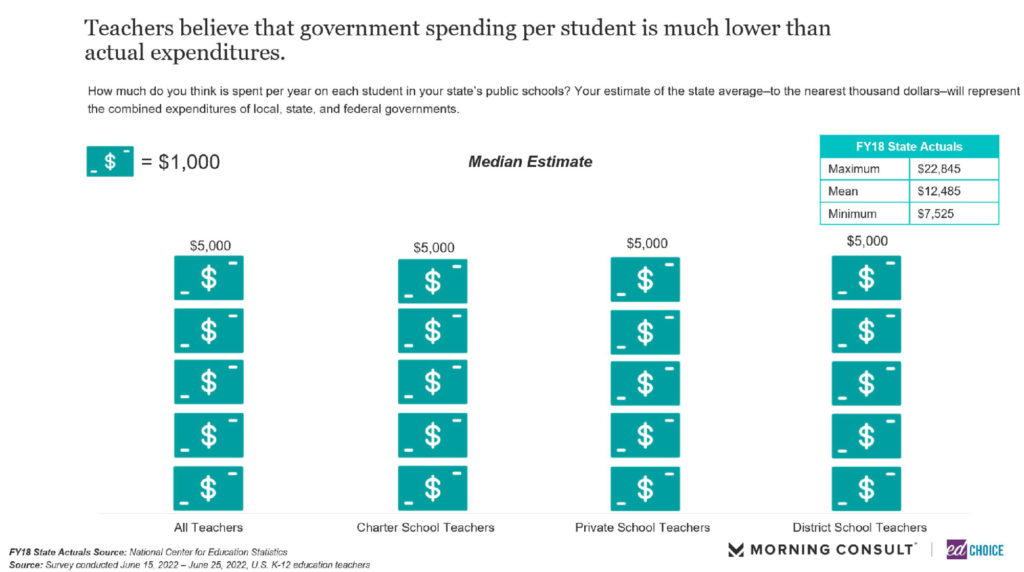
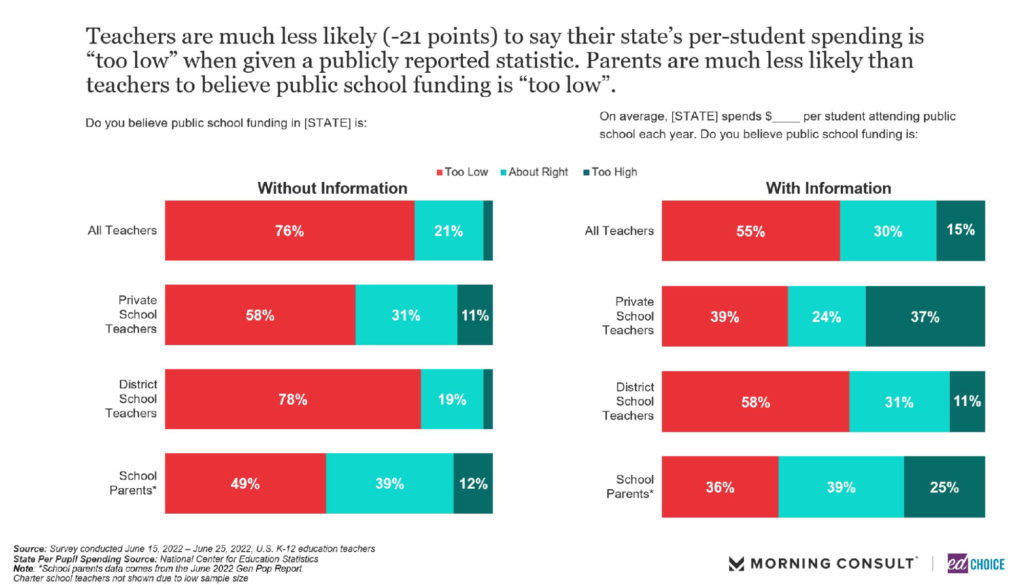
3. Teachers severely underestimate how much money is spent on public schools. The median teacher estimates their state spends $5,000 per pupil each year on public schooling. The average state actually spends two and a half times that amount, about $12,500 in 2018. We ask teachers whether they think public school spending is too low, too high, or about right, and we randomize whether they see how much money is actually spent in their state. The teachers who saw the real number were substantially less likely to say public school spending was too low, and the share that said spending was too high tripled that of the group who did not learn actual spending totals.
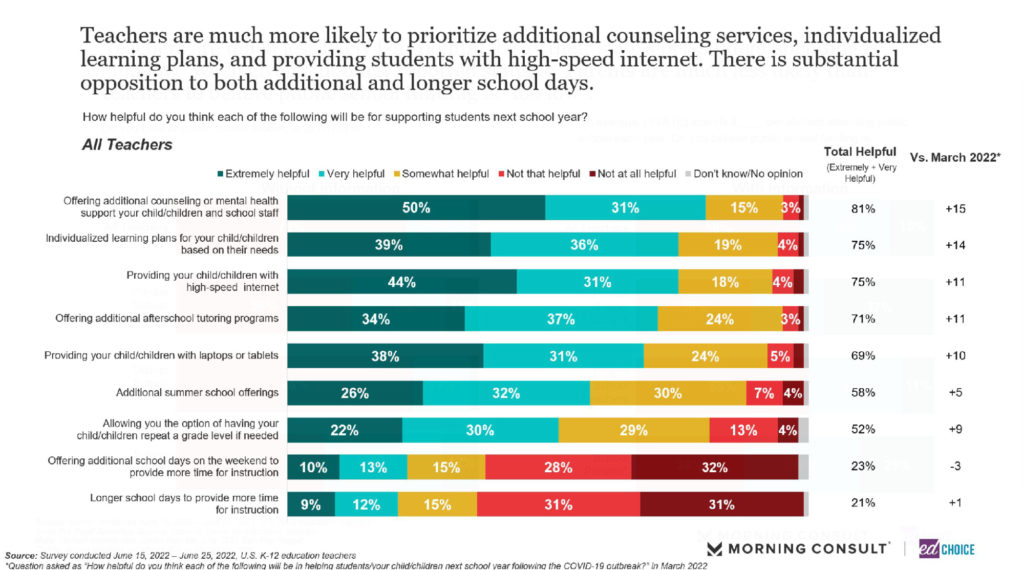
4. Teachers grew even more optimistic about various resources’ abilities to aid students. We presented the teachers with nine things schools could provide to help students succeed in school. Improving mental health and counseling services was the most popular idea, with 81 percent of teachers saying such resources would be “very” or “extremely” helpful to students next year. Three-quarters of teachers felt the same about individualized learning plans and access to high-speed internet. Most teachers also were very approving of tutoring services (71%), providing laptops or tablets (69%), offering additional summer school services (58%), and having children repeat their grades if needed (52%).
These totals are substantially higher than we saw in the March wave. Support for counseling and mental health services jumped 15 percentage points, individualized learning plans increased 14 points, providing internet and tutoring each rose 11 points, laptops climbed 10 points, grade repetition lifted 9 points, and summer school rose 5 points.
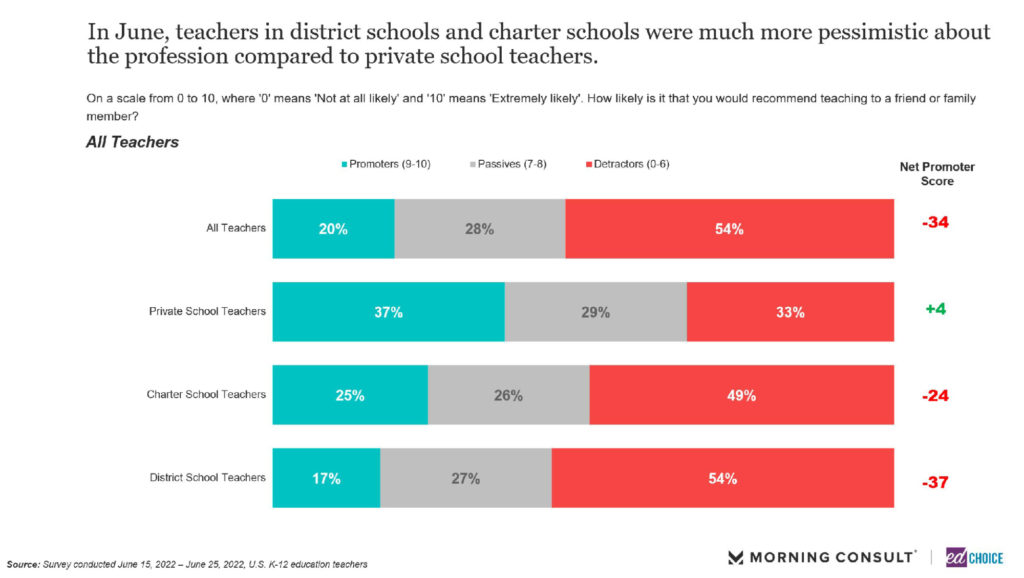
5. Teachers grew more pessimistic about their profession over the past few months. We asked teachers how likely they would be to recommend the teaching profession to friends or family on a scale of one to ten. One out of five teachers (20%) gave a nine or ten, while more than half (54%) gave a rating zero through six. We can use these numbers to calculate what marketers call the “net promotor score” by subtracting the number of respondents who gave a zero to six rating from those that gave a nine or a ten. For June, the teaching profession would have a net promotor score of -34. This is down 13 percentage points from the last time we asked the question, in March. Though it should be noted that if we break down teachers’ responses by school type, we see private school teachers countered this trend and actually had a positive net promotor score this month, improving six percentage points from March.
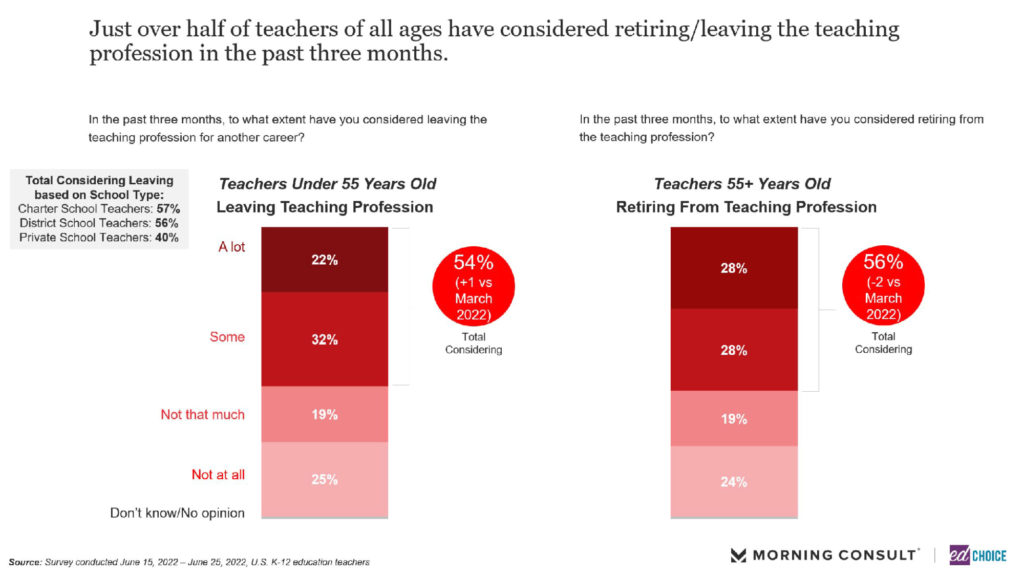
6. Younger teachers are almost as likely to consider leaving the profession as older teachers closer to retirement age. More than half of teachers say they have given at least some consideration to leaving the teaching field in the past three months. Among teachers under 55 years of age, 54 percent have at least “somewhat” considered exiting the profession in the last three months, with 22 percent giving that decision “a lot” of thought. A similar share of teachers 55 years and older have given some thought to leaving the teaching profession (56%), but 28 percent of them have given it “a lot” of consideration. Private school teachers were noticeably less likely to say they were considering leaving the teaching profession than their district and charter school counterparts.
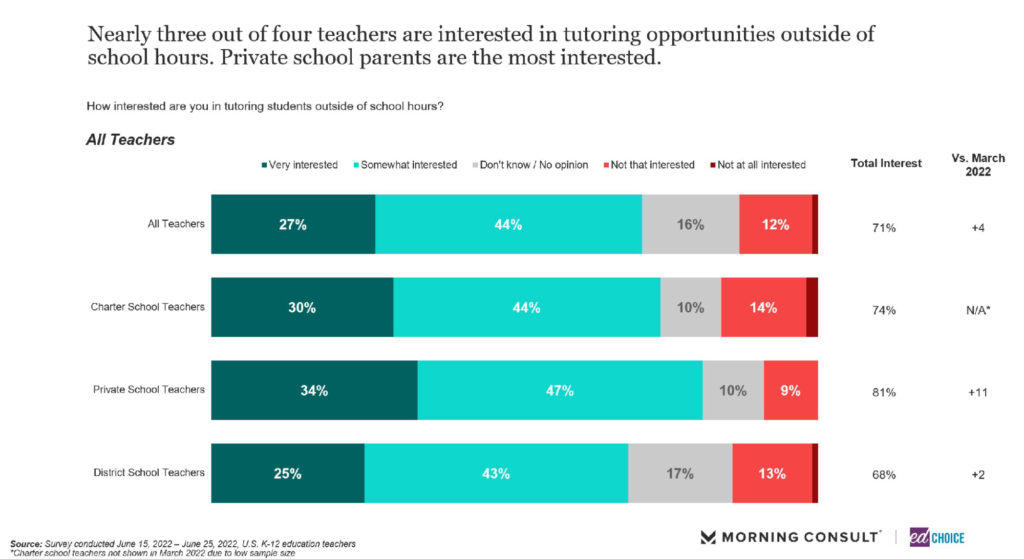
7. Most teachers are interested in offering tutoring outside of school hours. Seventy-one percent of teachers said they are at least “somewhat” interested in providing tutoring services to students outside of regular school hours, with more than a quarter (27%) indicating strong interest. Teachers at charter schools (74%) and private schools (81%) were noticeably more likely to be interested in tutoring services than their district school counterparts (68%).
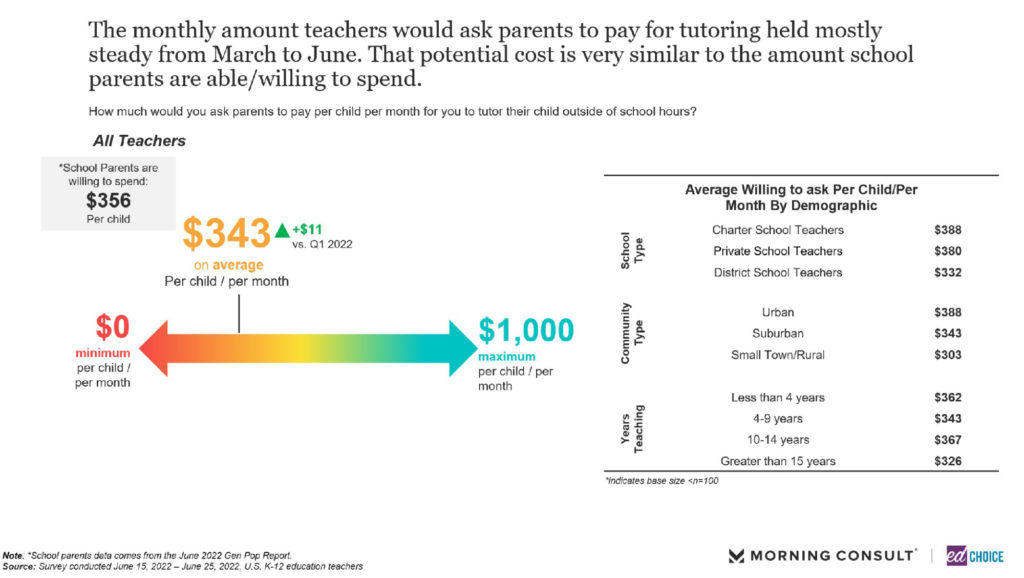
We also asked teachers how much money they would need to earn to make tutoring worthwhile. On average, teachers named $343 per child per month. Notably, in our parents and general population survey for the same month, the average willingness to pay among parents interested in tutoring was $356 per child per month. On average, then, parents are willing to pay teachers enough for tutoring services.
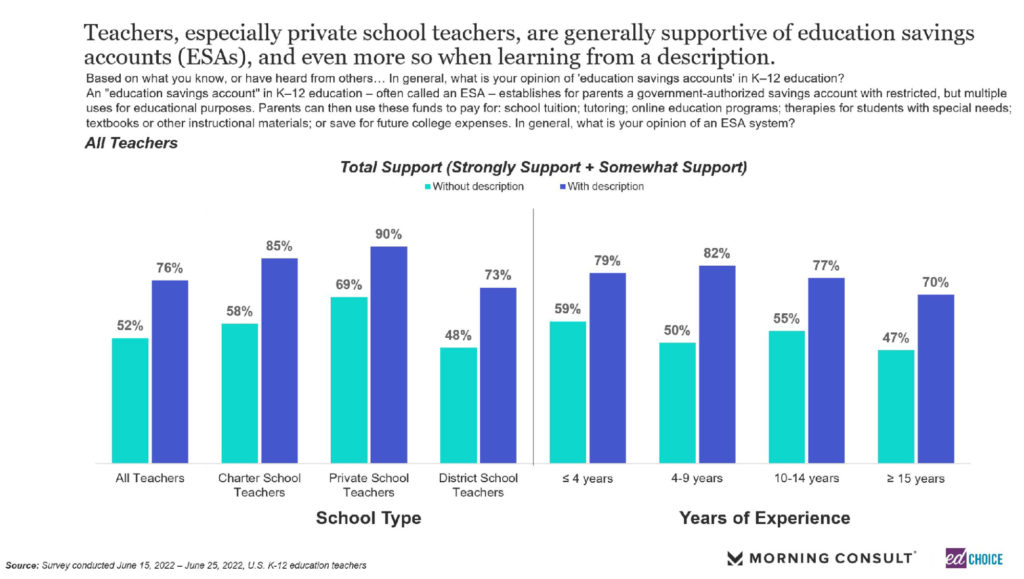
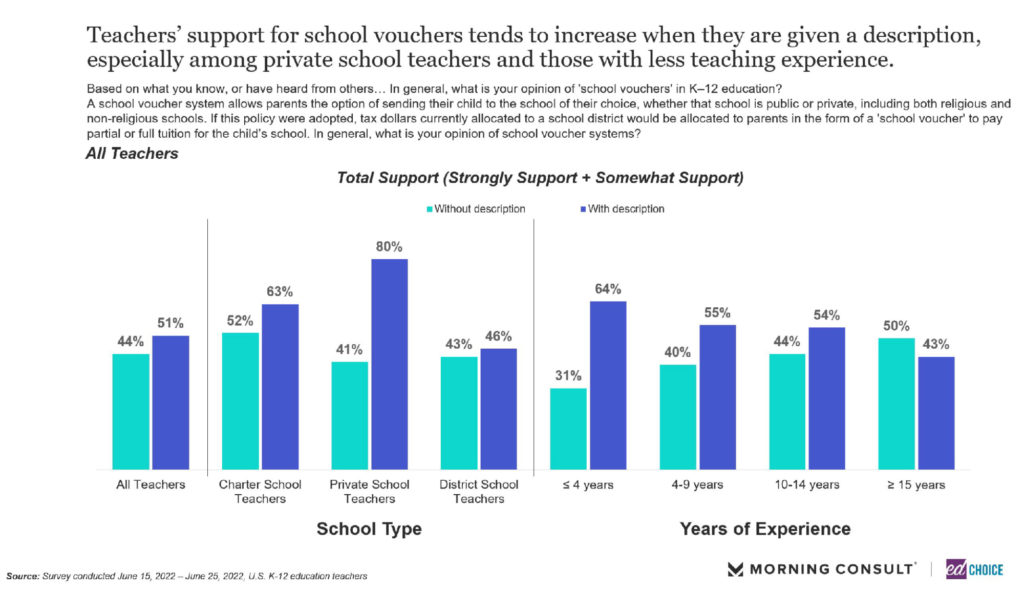
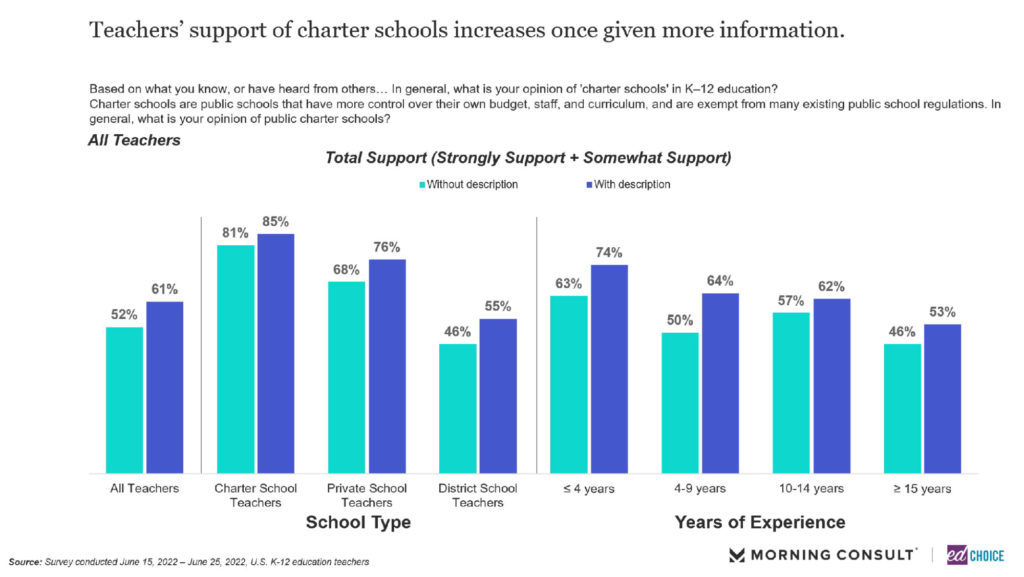
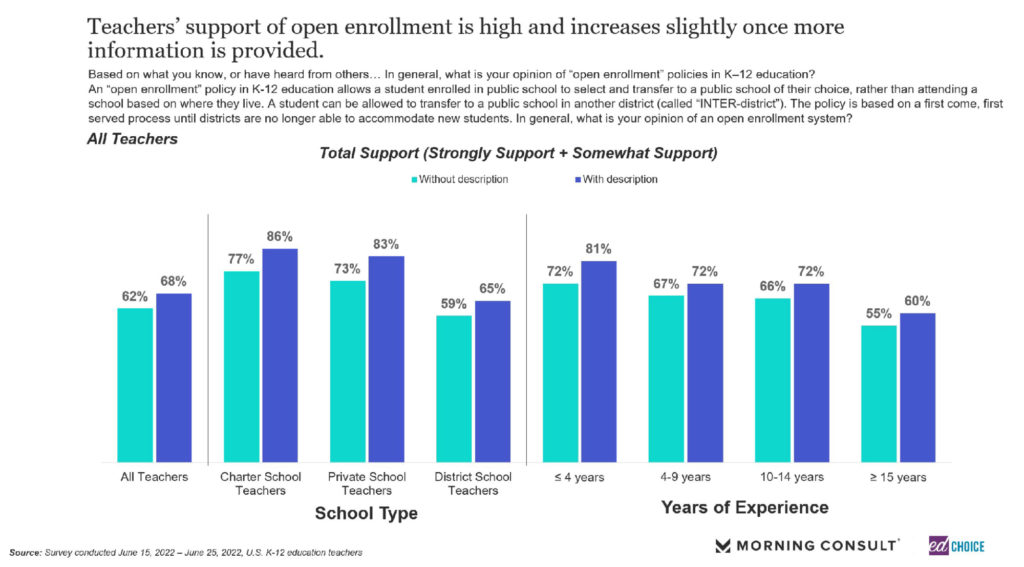
8. Teachers are supportive of ESAs, regardless of information provided. A majority of teachers (52%) indicated support for education savings accounts (ESAs) when provided no information about the topic, and more than three out of four teachers (76%) favored ESAs when shown a basic policy description. This 24-point jump was easily the largest among school choice policies we presented to teachers. Support for school vouchers, charter schools, and open enrollment increased seven points, nine points, and six points, respectively, among teachers when given further information. One interpretation of these numbers is that teachers are already fairly familiar with most school choice policies, with ESAs being the exception. This interpretation also implies that there is room to grow support for ESAs among teachers, who are supportive of the idea once aware of it.
Visit the EdChoice Public Opinion Tracker site to access past reports, crosstabs, and questionnaires. We update our national and state dashboards every month. We also provide a more in-depth description of our research and survey methods.
Our K–12 education polls archive is updated on a rolling basis, roughly a few times each month. Please don’t hesitate to let us know if we are missing any surveys, or if there are accidental errors.