Public Opinion Tracker: Teacher Survey Top Takeaways – October 2022
“We have a lot of work to do” is a common attitude amongst those working in education today. Results from the National Assessment for Educational Progress (NAEP) revealed massive learning loss sustained by many students during the COVID-19 pandemic. While almost everyone agrees students have a lot of ground to make up, how to proceed is a lot less straightforward. No matter how we move forward, one thing is for certain, it will be teachers who will be on the front line.
To better understand teachers’ experiences and opinions we turn our attention to our newest survey of public and private school teachers. From October 13-21, our partner Morning Consult surveyed 1,000 K-12 Teachers about educational choice policies, school safety, morale and much more.
Here are the key findings from our latest survey:
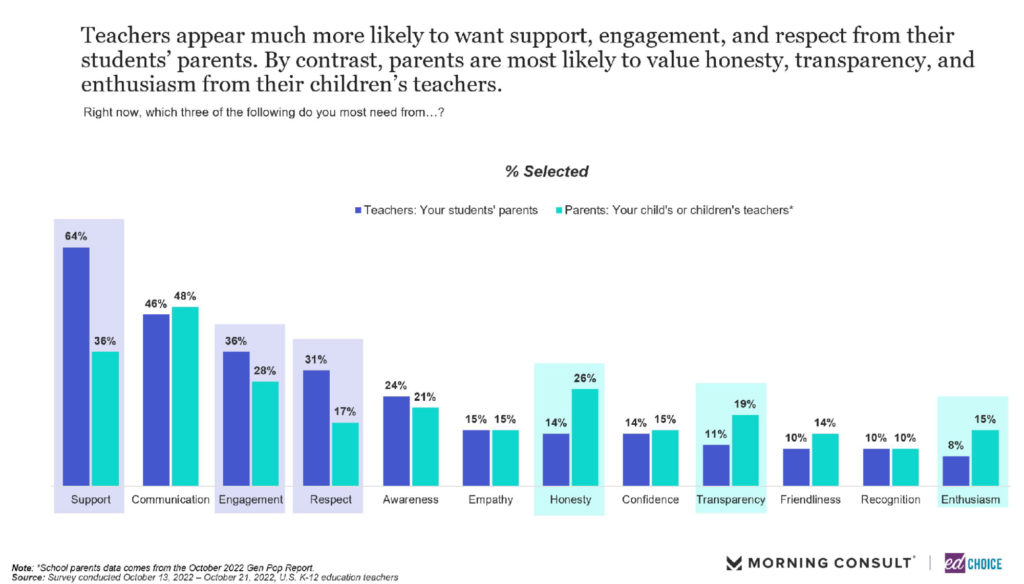
1. Teachers are most looking for support, communication, and engagement out of their students’ parents. Additionally, nearly one-third of teachers desire respect from their students’ parents. For comparison, we asked parents what they need from their child’s teachers. Parents’ priorities aligned similarly with teachers. Parents’ top desired attributes of their child’s teachers were also communication, support, and engagement. That said, there was a big gap in the desire of support. Nearly two-thirds of teachers want support from their students’ parents while only 36 percent of parents want support from their child’s teachers.
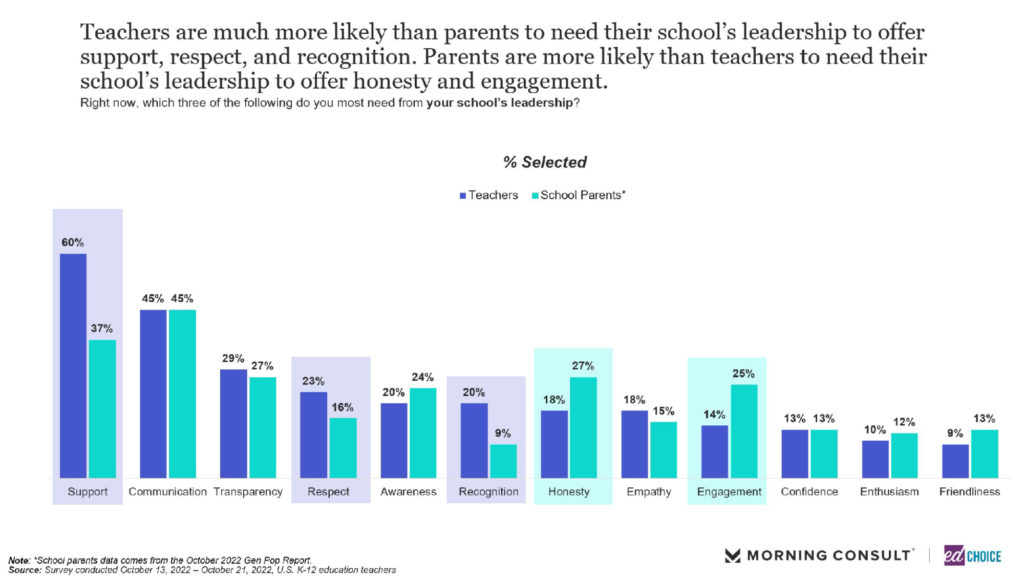
We also asked teachers and parents what they desire of their school’s leadership. Both groups were also aligned on this question. The three most desired attributes of school leadership were communication, support, and transparency.
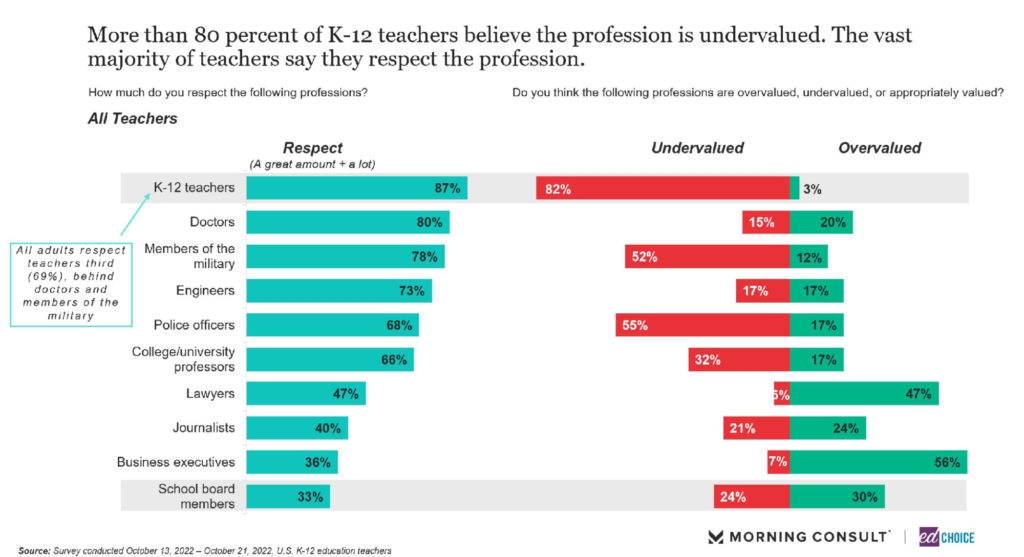
2. Only one-third of teachers respect school board members. Furthermore, teachers are more likely to believe that school board members are overvalued. When asked about the teaching profession, more than 80 percent of teachers respect their own profession, and feel they are undervalued. The majority of Americans respect teachers as well, albeit at a lesser rate (69%).
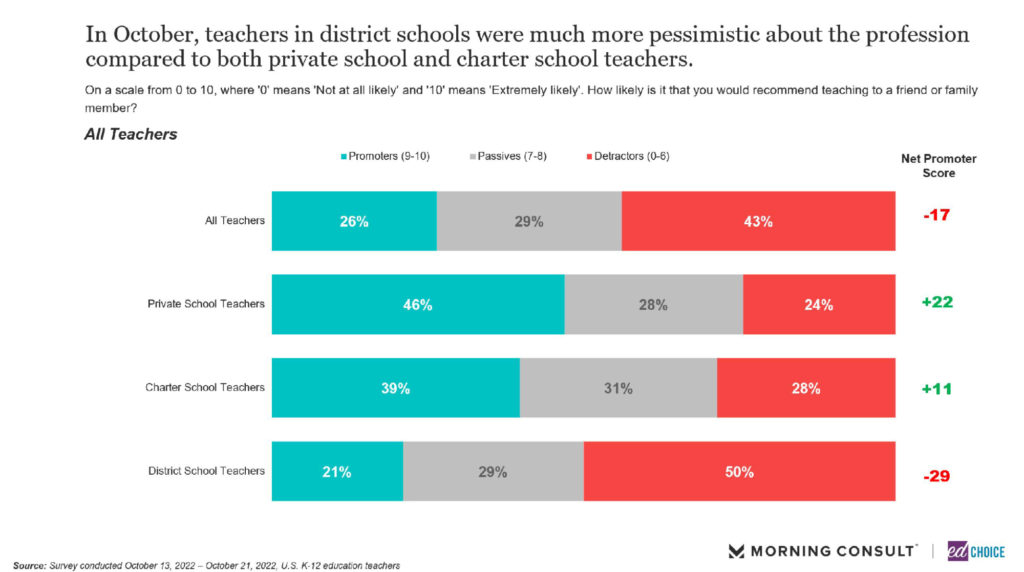
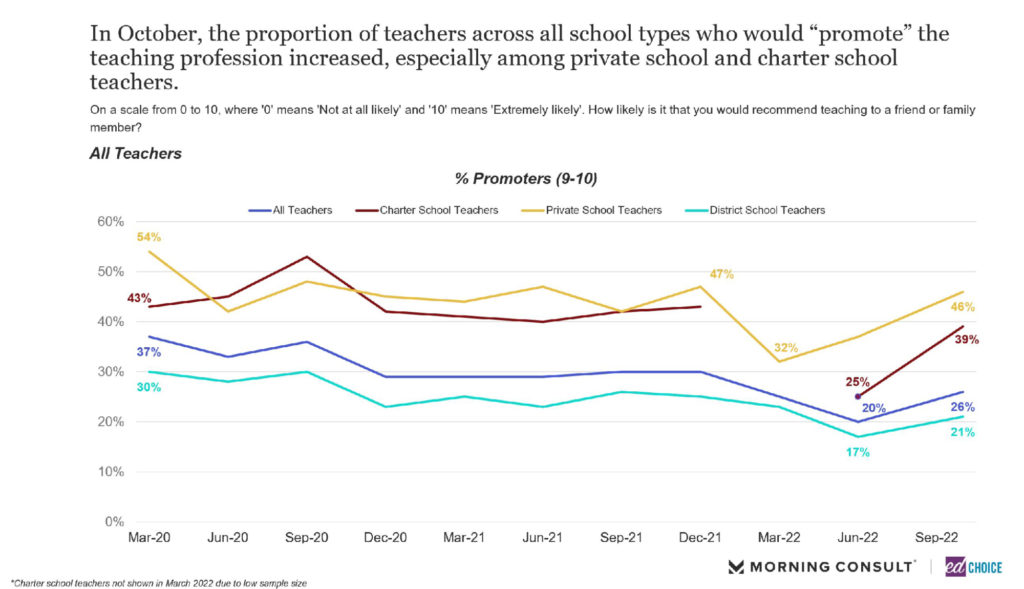
3. District school teachers were much more pessimistic about the teaching profession compared to private school and charter school teachers. Both private school (46%) and charter school (39%) teachers were more likely than not to recommend the teaching profession. On the other hand, only 21 percent of district school teachers would recommend the profession, while half would NOT recommend the teaching profession. That said, district school teachers grew more optimistic towards the profession in this wave than our last wave in June. In fact, the proportion of teachers who were willing to promote the teaching profession increased across the board in October.
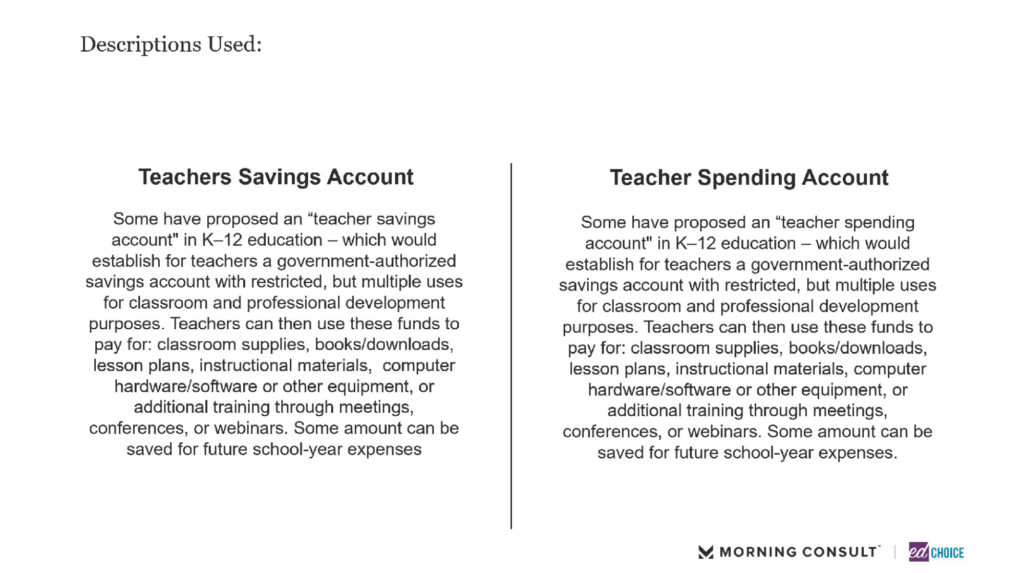
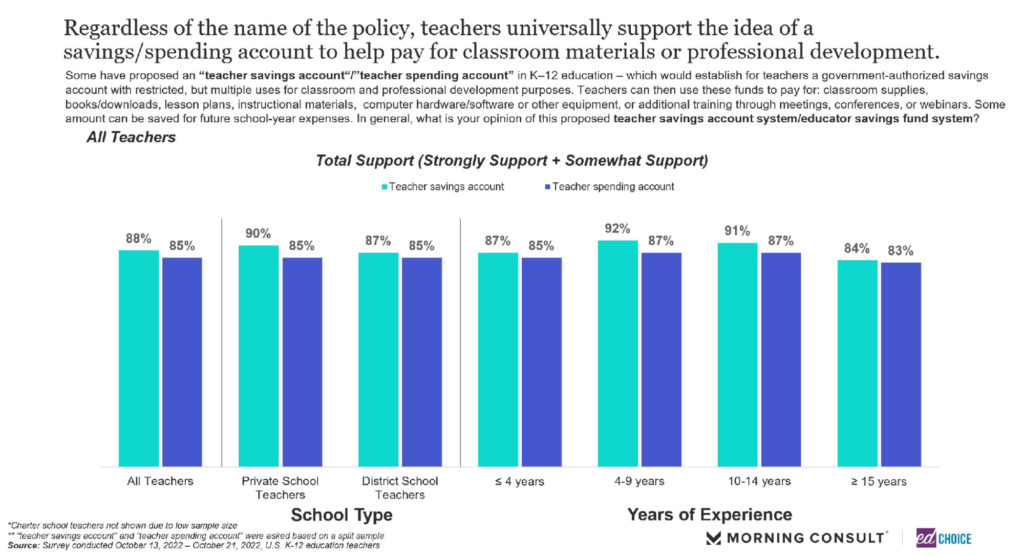
4. Teachers universally support the idea of publicly funded teacher savings/spending account. The poll described to teachers a government-authorized savings account with multiple, but restricted uses for classroom and professional development purposes that teachers could use to pay for classroom supplies, books, lesson plans, instructional materials, computer hardware or software, additional training through meetings, conferences, or webinars. We titled this policy idea as “teacher savings accounts” or “teacher spending accounts” (TSAs) (and randomized which title respondents saw) and asked teachers what they thought.
“Teacher savings accounts” garnered slightly more support compared to “teacher spending accounts,” but the headline figure is that both had very high levels of support.
Teachers were incredibly supportive of TSAs, regardless of school type and tenure of the teacher. Private school teachers (90%) were slightly more approving of “teacher savings accounts” than district school teachers (87%). Years of teaching experience had little effect on the levels of support for TSAs.
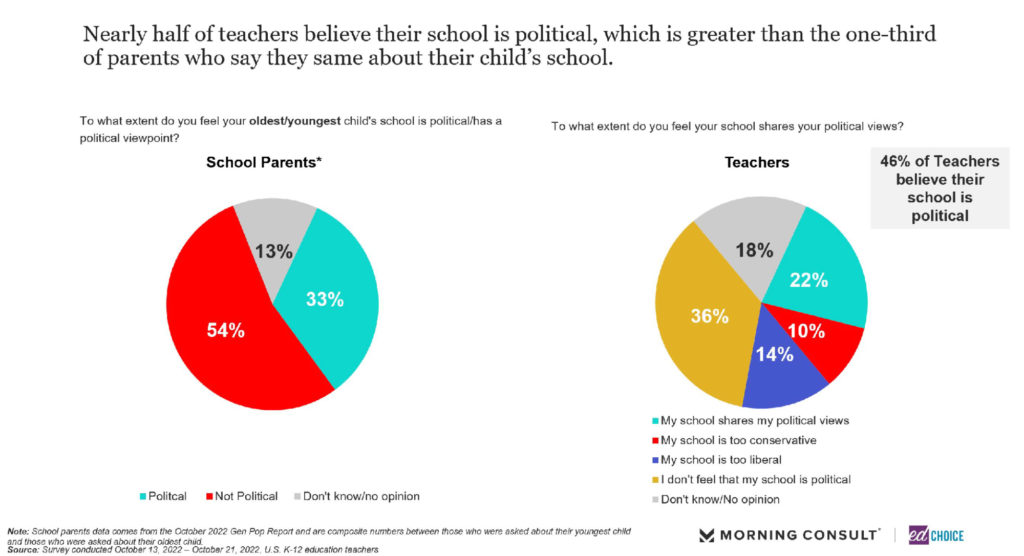
5. Nearly half of teachers believe their school is political, which is higher than what we have observed among parents. For the first time in our teachers’ surveys, we asked teachers whether they believe their school is political and if their school matches their own political beliefs. While about half of teachers believe their school is political, only about one in five teachers believe their school shares similar political beliefs. Comparing teachers’ perspectives with that of parents, only one-third of parents say their child’s school is political.
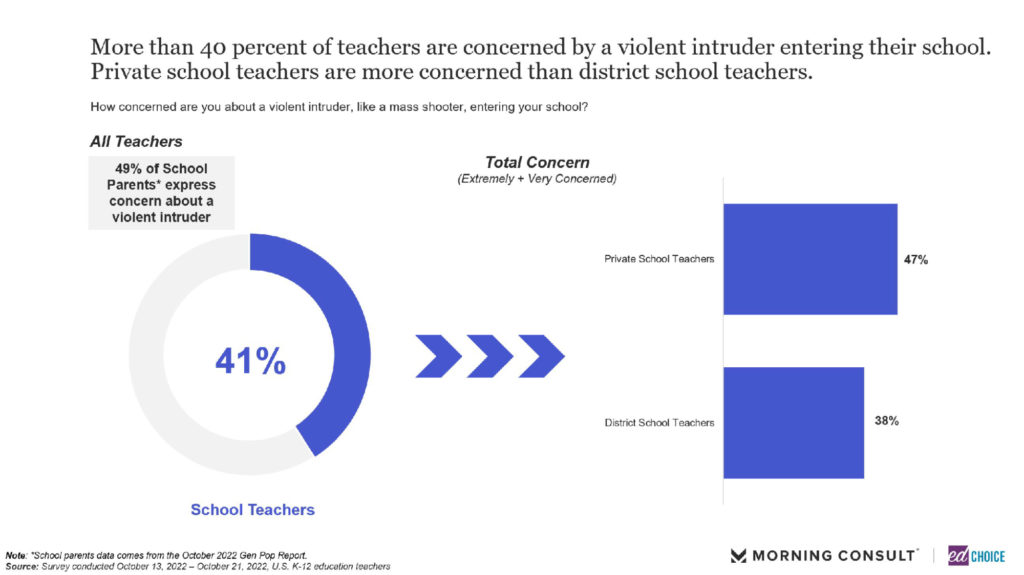
6. More than four in ten teachers are concerned about a violent intruder entering their school. Private school teachers (47%) are slightly more concerned about violent intruders than district school teachers (38%). Interestingly, when we compare their responses to our recent polls of parents and teens, teachers are more concerned than teens (only 32% of them are concerned) but less concerned than parents (49% of them are concerned).
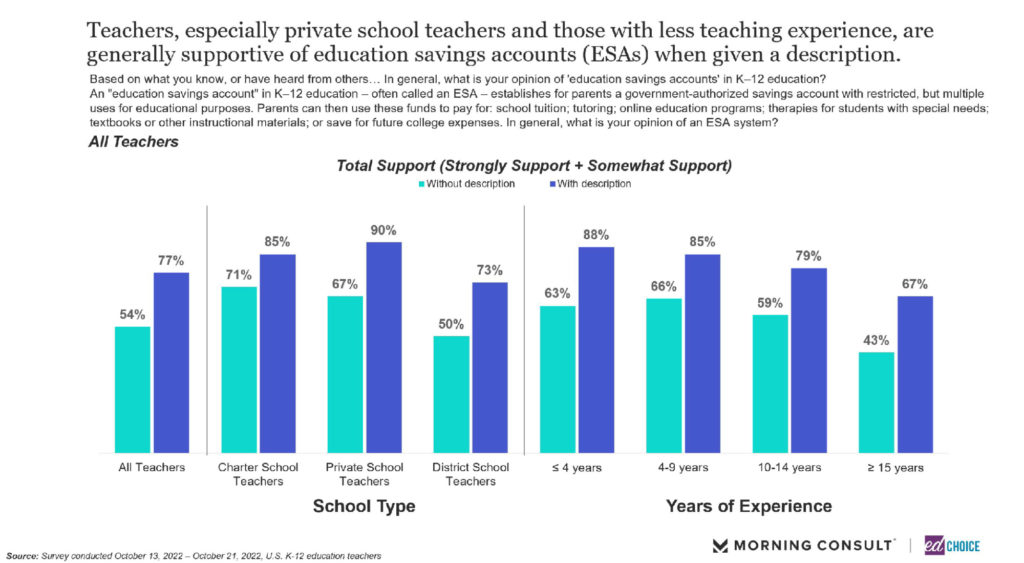
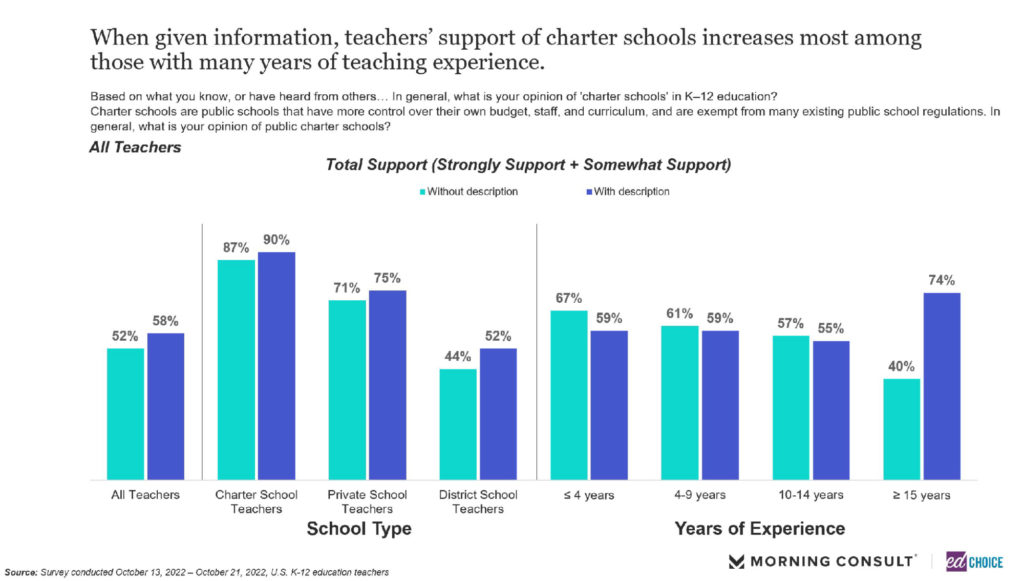
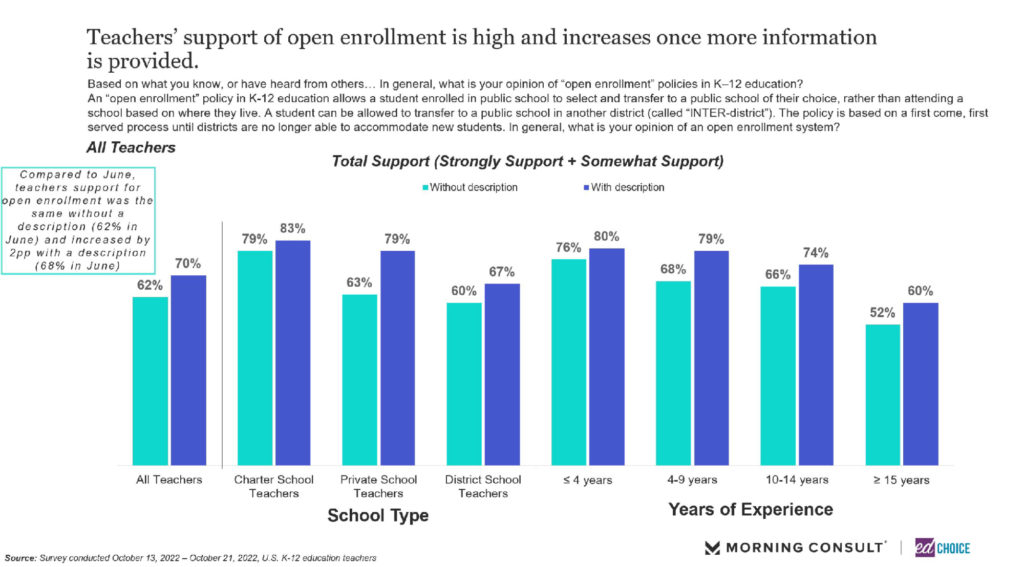
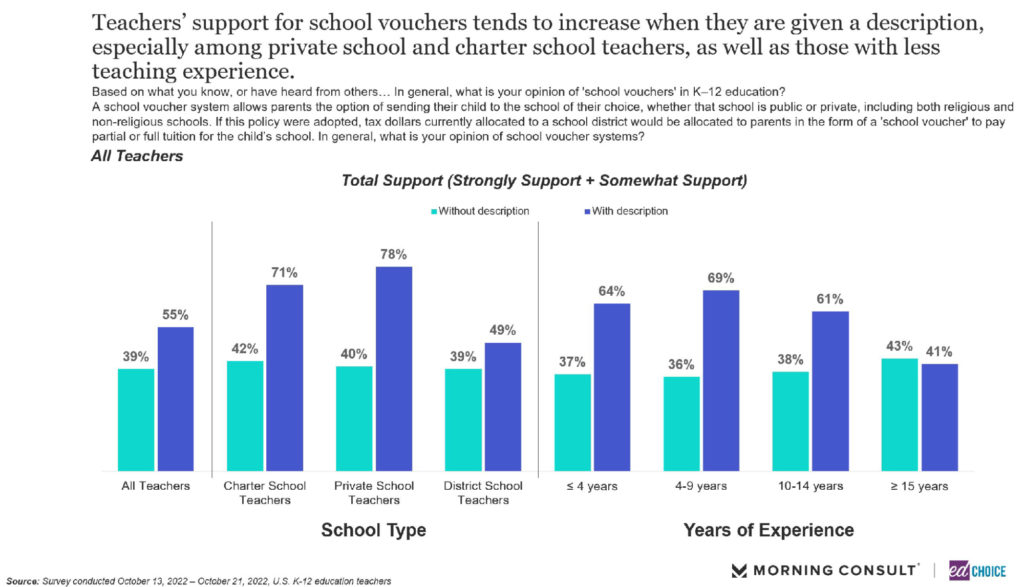
7. The majority of teachers support school choice policies when given a basic definition. For Education Savings Accounts (ESAs), charter schools, and open enrollment, the majority of teachers are supportive regardless of whether information is provided or not. That said, providing information on the school choice polices consistently resulted in higher levels of support. Support for ESAs, vouchers, charter schools, and open enrollment increased 23 points, 16 points, 6 points, and 8 points, respectively, among teachers when information was provided. ESAs, the most popular of the school choice programs, was supported by 77 percent of teachers with information provided.
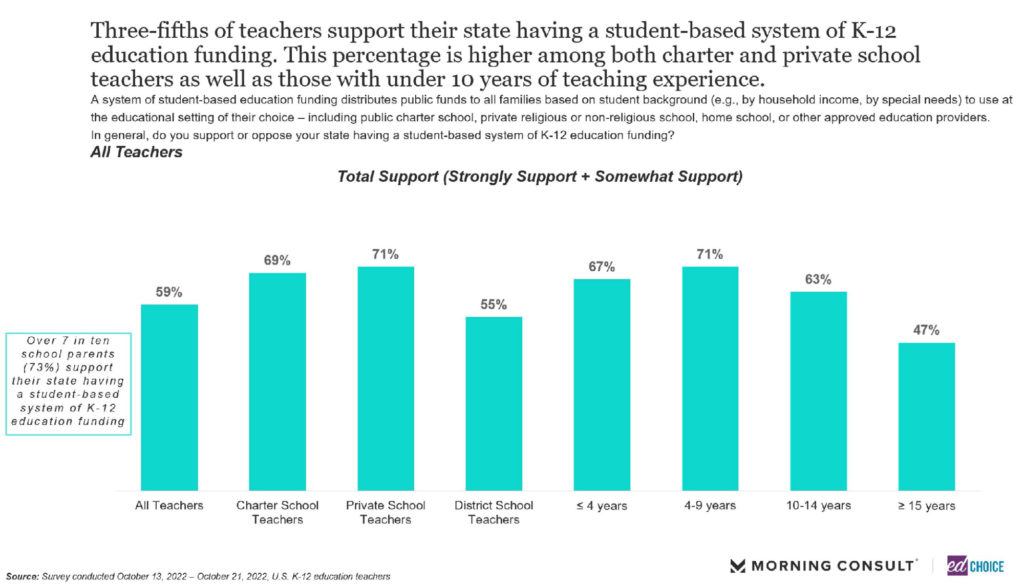
We also asked teachers about the idea of a student-based system of K-12 education funding. We posed the idea of a system of student-based education funding that distributes public funds to all families based on student background (e.g., by household income, or by special needs) to use at the educational setting of their choice. Nearly three-fifths of teachers agreed with the idea, with higher levels of support shown from charter and private school teachers. The majority of districts school teachers supported the idea as well. Support is strong with parents (73%), as well.
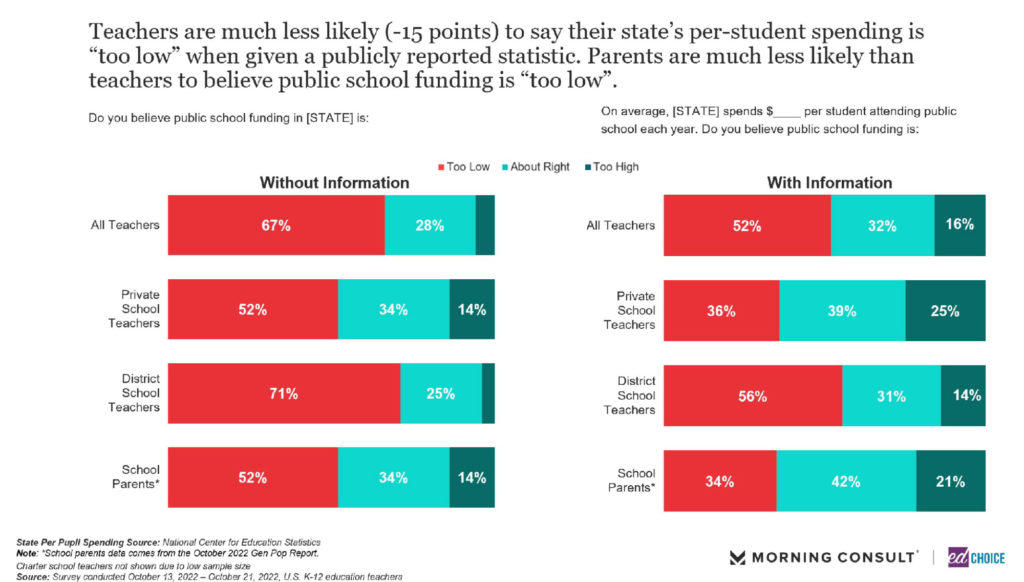
8. Teachers are much less likely to say their state’s per student spending is “too low” when given a publicly reported statistic. Without any information on school funding, two-thirds of teachers say the funding in their state is too low. With information provided, however, the proportion of teachers who believe the per-student spending in their state is “too low” drops 15 points. District school teachers are the most likely group to believe funding is too low, regardless if a statistic was provided. Interestingly, only about one-third of school parents believe funding is too low when shown a publicly reported statistic.
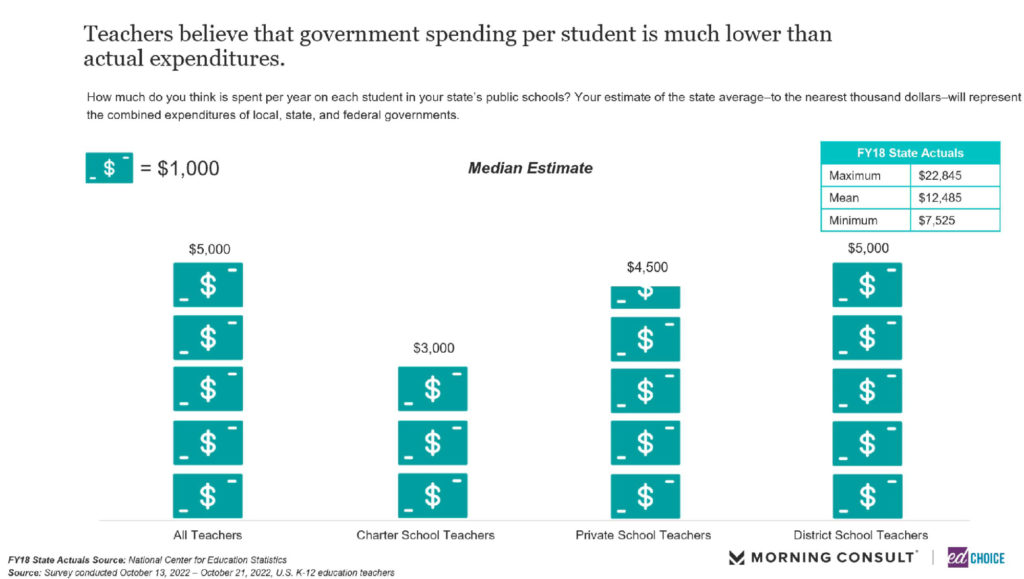
We also asked teachers to estimate how much is being spent on each student in their states’ public schools. Teachers estimated $5,000 is being spent on each student. Their estimate is much lower than the true average public school per-student expenditure in our country, which is roughly $13,000.
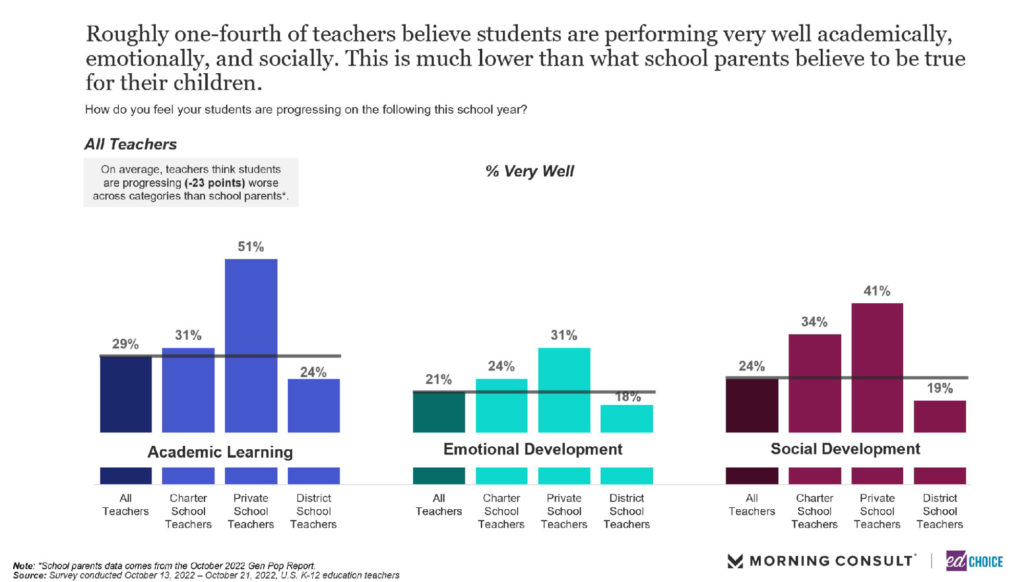
9. Only roughly one-fourth of teachers believe their students are progressing very well academically, emotionally, and socially. Teachers and parents have two different perspectives on this issue, however. On average, teachers think students are progressing worse (-23 points) in the three categories than school parents. Across the board, private school teachers are much more optimistic about their students’ progress. On the other hand, district school teachers are the least likely to say their students are progressing very well in the three areas.
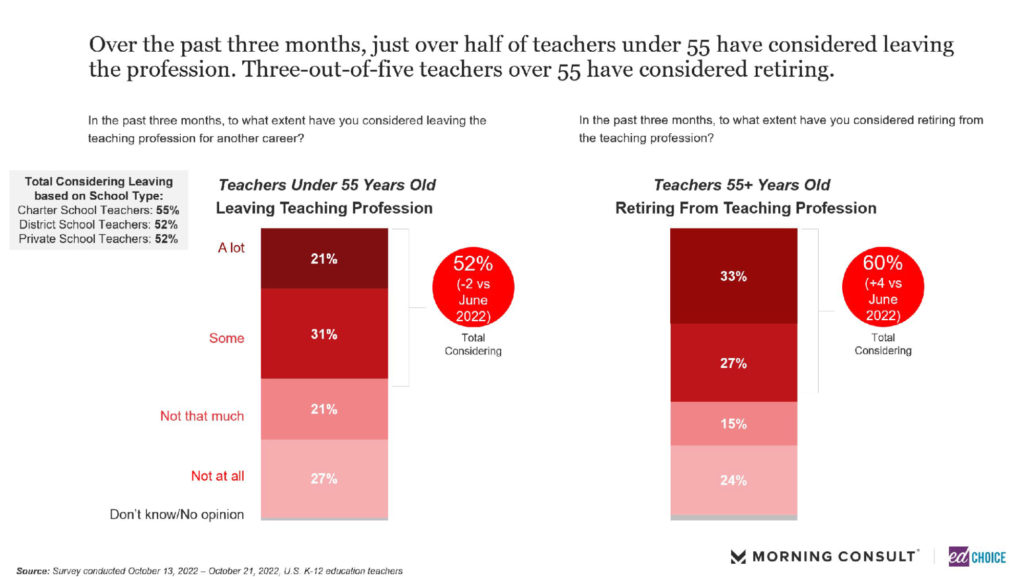
10. Regardless of age, the majority of teachers considered leaving the teaching profession in October. More than half (52%) of teachers under the age of 55 considered leaving the teaching profession, down slightly from our last wave in June. However, 60 percent of teachers over the age of 55 considered retiring from the profession, which is a 4-point increase from the summer. The main drivers pushing teachers to consider leaving are the impact of the pandemic, feeling undervalued, and the politics of the job.
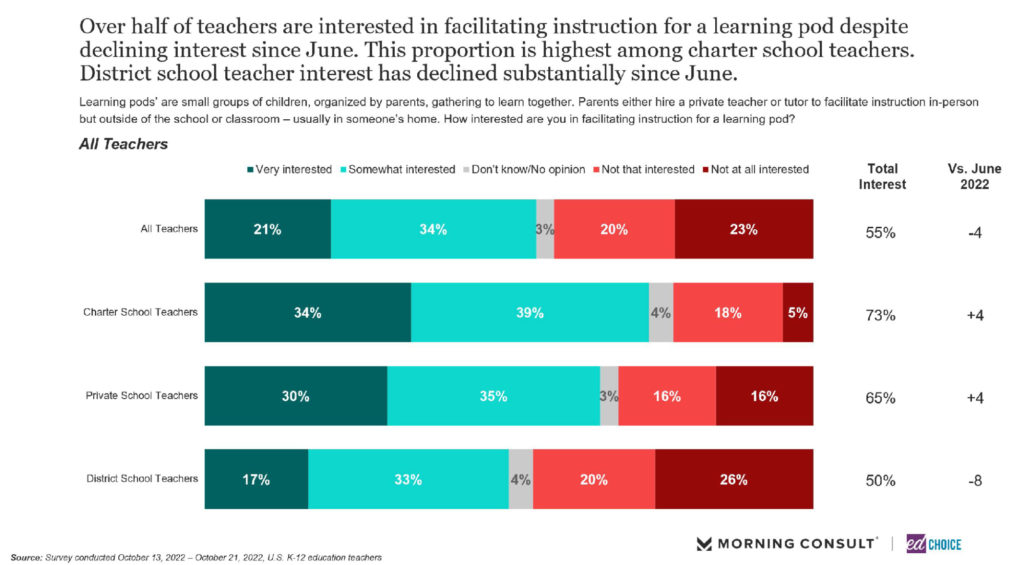
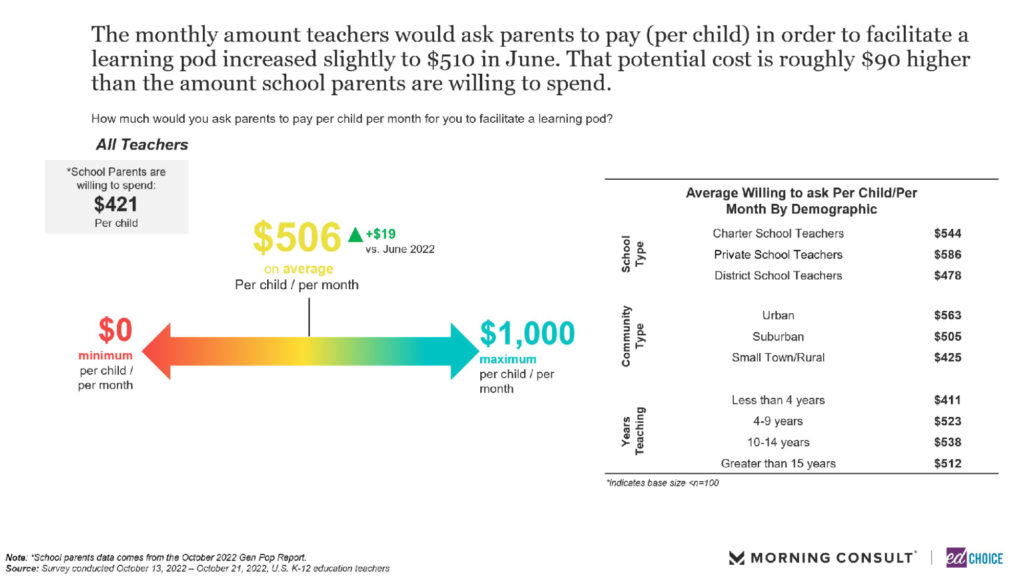
11. Over half of teachers are interested in facilitating a learning pod. Charter school teachers are the most willing to teach in a learning pod, with 73 percent showing interest. District school teachers show the least interest among the groups of teachers, though the level of interest is still quite high at 50 percent. We also asked teachers how much they would charge parents (per child) per month to facilitate a learning pod. The average price (per child) for a teacher was slightly more than $500, while the average price parents would be willing to pay (per child) was $421.
Visit the EdChoice Public Opinion Tracker site to access past reports, crosstabs, and questionnaires. We update our national and state dashboards every month. We also provide a more in-depth description of our research and survey methods.
Our K–12 education polls archive is updated on a rolling basis, roughly a few times each month. Please don’t hesitate to let us know if we are missing any surveys, or if there are accidental errors.