Schooling in America Series: Getting to Know Our Teachers
This year, our annual Schooling in America Survey series put a special emphasis on those who teach in our classrooms. We surveyed 777 current public school teachers to get their general views on their profession, as well as contentious subjects in K–12 education such as state accountability systems, standardized testing and school choice reforms.
We explore all the usual topics our Schooling in America Survey covers in this series, including parents’ schooling experiences, awareness of school funding, and school choice. Each post will incorporate other polling work and current events in order to contextualize our results.
But we begin with teachers.
Who Are Our Public School Teachers?
Before digging further into the results, it’s worth pointing out who teach in our public schools. Unlike our general population sample—which is nationally representative of demographic characteristics like race, income and educational background—teachers in our sample are overwhelmingly white (84%, vs. 71% general population), hold college degrees at high rates (85% vs. 30% general population) and more likely to live in a middle-income household of $40,000 to $80,000 (49%, vs. 30% general population).
These teacher demographic data are weighted using targets obtained via the U.S. Department of Education’s National Center for Education Statistics. The demographic differences between teachers and the general public aren’t terribly surprising. To be certified to teach in public schools, you typically must have at least a bachelor’s degree. Study after study links college attainment to higher lifetime earnings, which helps explain the higher rate of middle-income earners in our teacher sample compared to the general population. Following that line, non-Hispanic whites make up the bulk of those holding a bachelor’s degree or higher, so the teacher population seems to reflect that.
Just because teachers are highly educated, though, doesn’t mean they’re highly satisfied with their jobs.
Are Our Teachers Happy in their Jobs?
On a scale from 0 to 10, how likely is it that you would recommend Product X to a friend or a colleague?
We’ve all seen these types of survey questions when trying to read an article online. You’ve probably mindlessly answered at least a few. But what if we asked about your job? How highly would you recommend what you do for a living to those you care about, and how does that reflect on your profession?
That’s the idea behind the Net Promotor Score (NPS) question that we asked current public school teachers.
We’ve used this NPS question in our previous surveys of state legislators and military service members. Although to slightly varying degrees, those groups reported net-positive NPS scores (+41 and +45, respectively on a -100 to +100 scale), indicating a high level of promotion of and commitment to their professions.
Public school teachers, on the other hand, reported a -17 NPS score. We can cautiously interpret that score as signaling discontent with the profession.
The average public school teacher is not a promoter, based on NPS. If that’s surprising, it may be worth looking at the data differently. Another way to look at these data is the mean result of asking the NPS question, or mean score. On average, public school teachers gave a 6.4 rating out of 0 to 10, which is nearly two points lower than active-duty military members (8.4) and state legislators (8.4) and indicates the run-of-the-mill teacher is passive about their profession or worse.
These NPS levels should concern states and school districts looking to retain their teachers and attract new ones to the profession.
Other surveys have previously asked about teacher satisfaction in different ways. Back in 2000, Public Agenda conducted an extensive survey of new teaches, both from public and private schools, about myriad topics, including job satisfaction and commitment. It found two-thirds (68%) of new teachers get a lot of satisfaction out of teaching. Fast forward a dozen years to the 2012 MetLife Survey of the American Teacher, and satisfaction among all public school teachers had dropped to its lowest point in a quarter century. Our results indicate teacher satisfaction may be even lower since 2012.
The teachers from the Public Agenda survey who have stuck with the profession are now in the middle of their careers. Teachers with 10 or more years of experience—those who could comfortably be described as mid-to-late in their careers—made up a little more than half (53%) of our sample. And it’s these teachers, especially, who register the lowest (-21) NPS scores when compared to other tenure groups.
Some may interpret these results in a negative fashion, so let’s turn to a hopeful bright spot: teachers’ trust in those they teach.
Who Do Our Teachers Trust?
Teachers place “complete” or “a lot of” trust in their principals (57%) and their students (52%). Only about a third, though, were likely to place the same level of trust in their students’ parents.
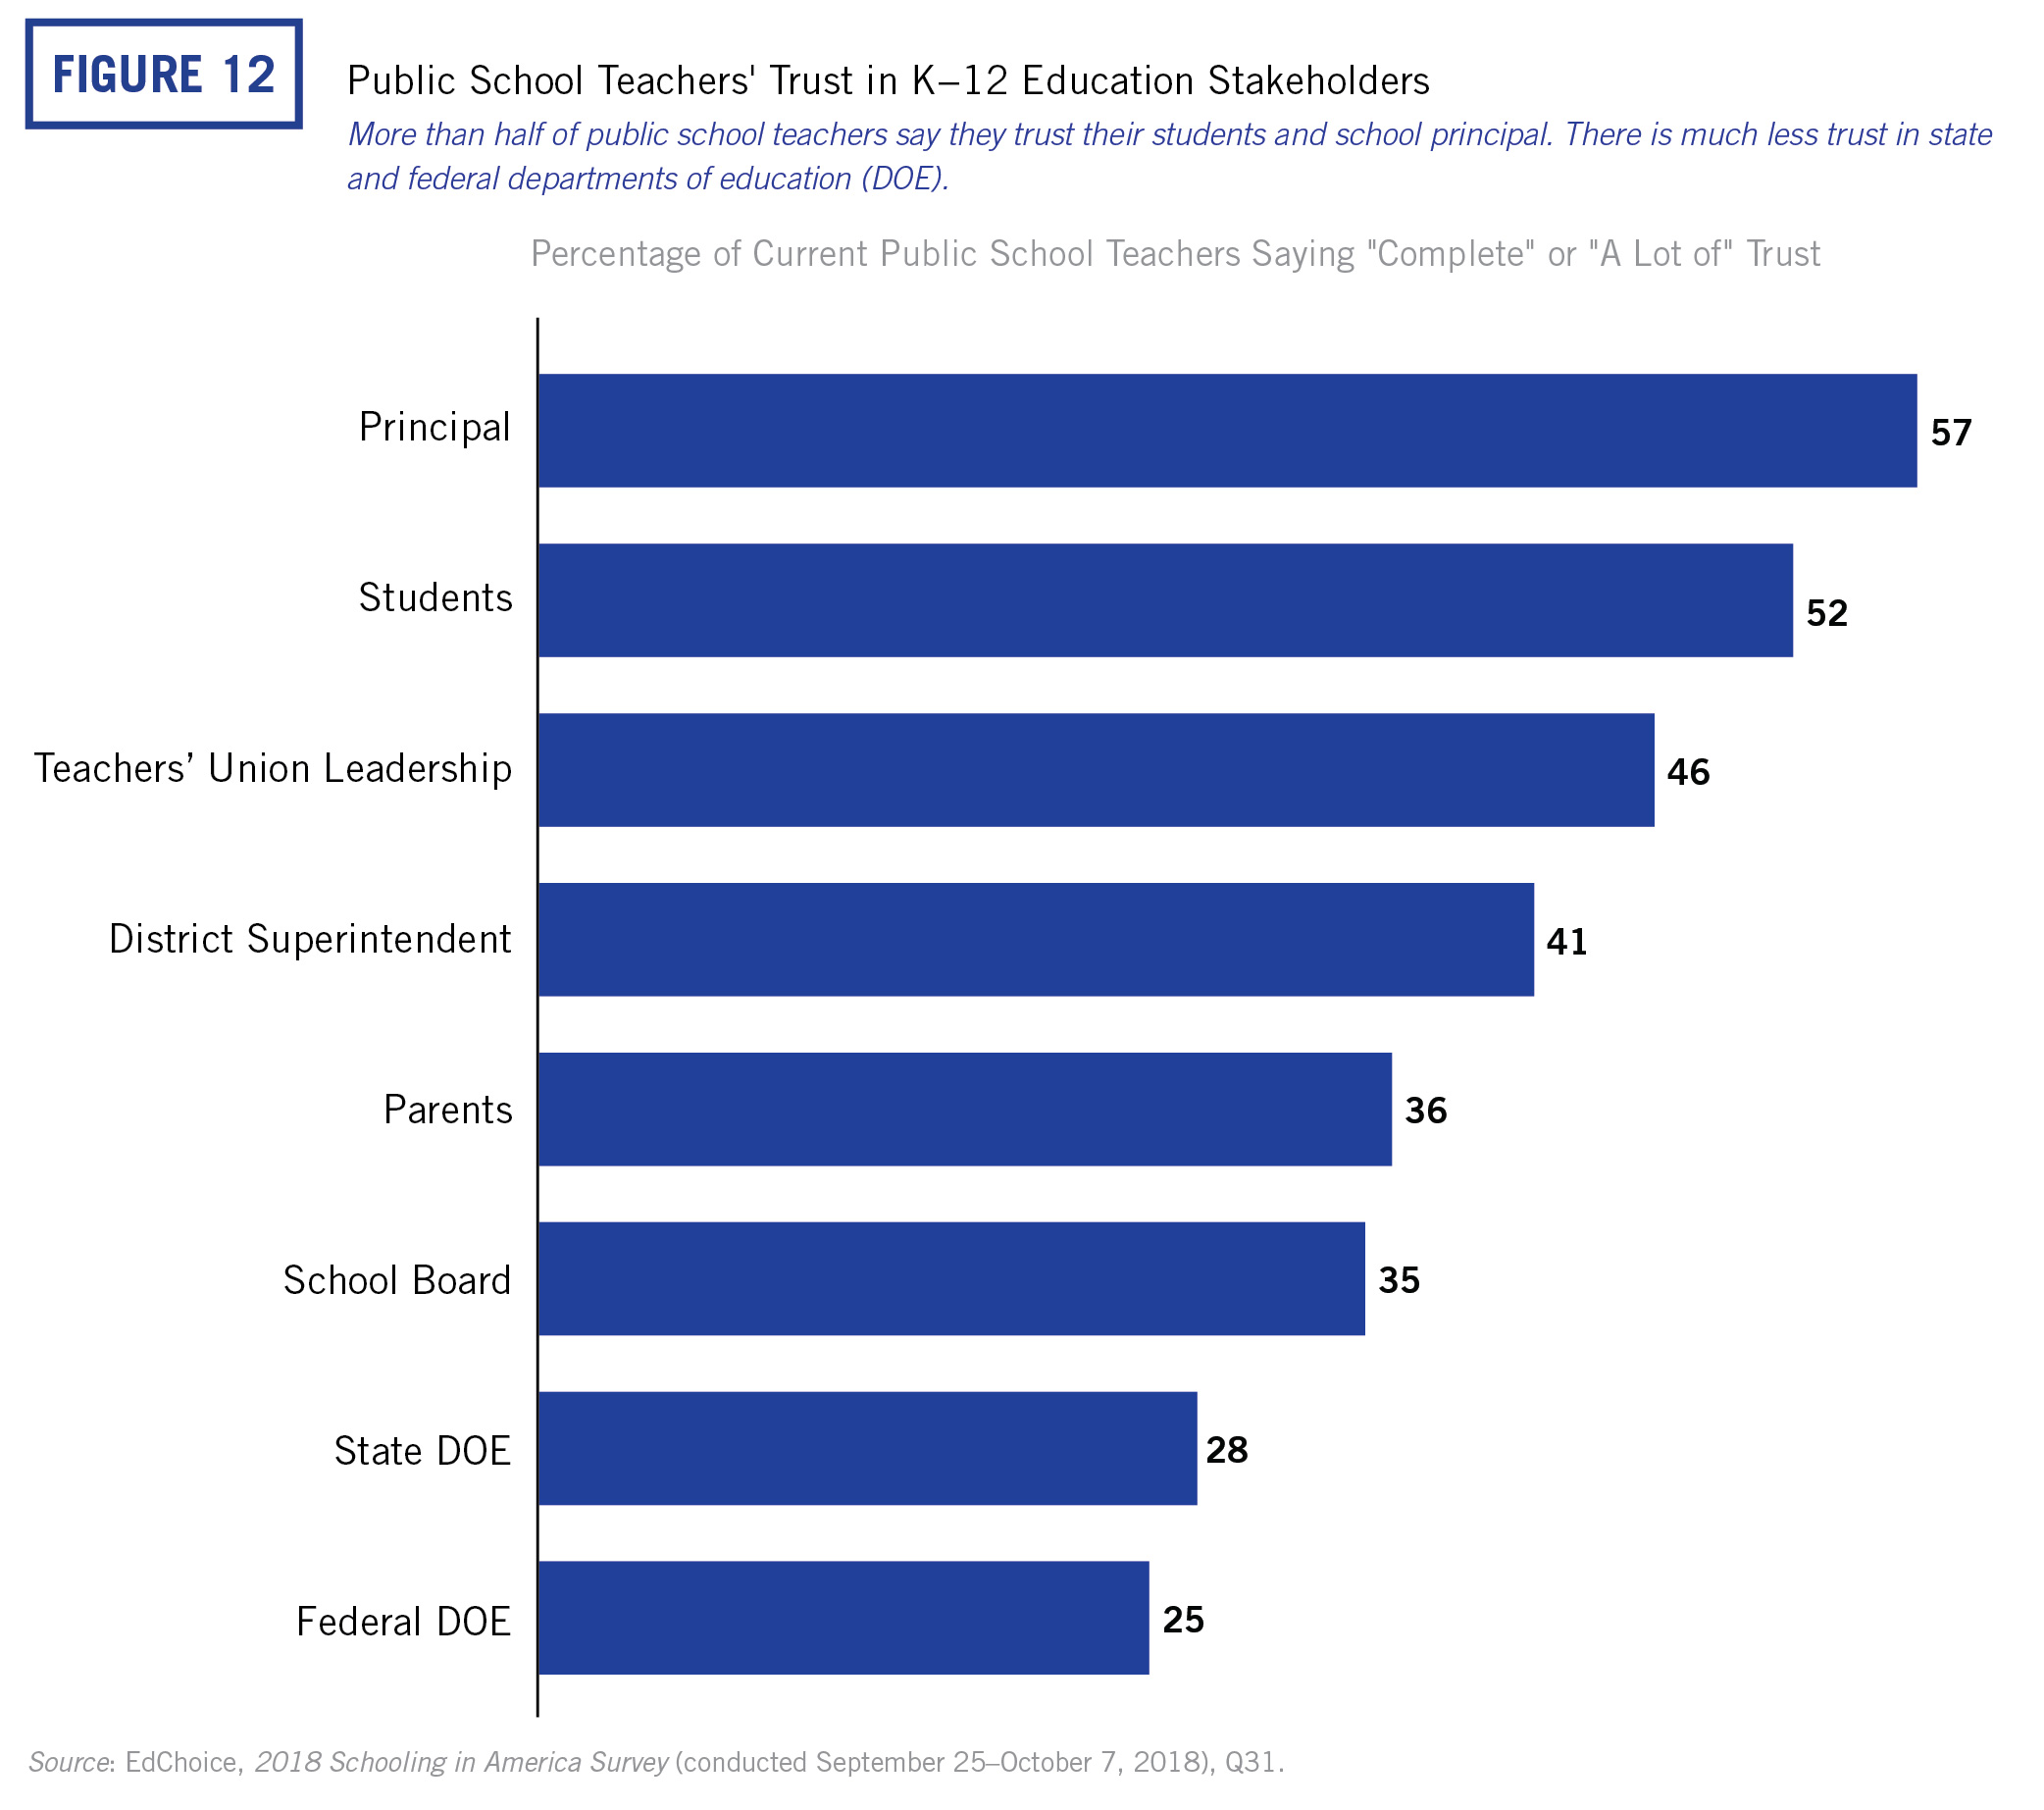
Trust in teachers’ unions ranked third in our survey. Using Educators for Excellence polling to dig deeper, teachers seem to be split on their connection to their unions. Almost half (46%) say unions provide teachers with feelings of pride and solidarity in addition to the practical benefits of membership, and a little less (43%) say they really only receive practical benefits from their unions. Less than one in 10 (7%) say their union membership makes them uncomfortable.
This teacher-union relationship became particularly relevant this year after teacher walkouts and a huge court case.
What Do Our Teachers Think About Current Events?
The United States Supreme Court struck down mandatory union agency fees for non-union members for public employees in June 2018. Many “right-to-work” states had already disallowed this practice, but now it is illegal for public-sector unions, including teachers’ unions, to collect fees from those who don’t wish to join them.
It already seems to have affected union membership in some states. Educators for Excellence reported 82 percent of teachers were likely or somewhat likely to opt in to their union post-Janus v. AFSCME, leaving about a fifth unlikely to if not automatically enrolled.
How do public school teachers feel about this change? It depends on how you ask them.
We split our teacher sample three ways, asking each group a slightly different question regarding union fees. When asked generally about disallowing mandatory union fees, about half (48%) of public school teachers said they “strongly” or “somewhat” support it. That number dropped a bit to 46 percent when specifying such a measure includes teachers’ unions. Notably, support jumped to nearly six in 10 public school teachers when we mentioned the specific Supreme Court case.
Teachers seem unified, though, in their support for higher teacher pay.
EdNext reported three-fourth (76%) of teachers support raising teaching salaries in the same year it has seen the largest one-year change in general public support for higher teacher pay. This comes the same year as large-scale teacher walkouts in several states demanded just that. Those in states where teachers went on strike were 16 percentage points more likely to support higher teacher pay than those in states that did not experience teacher walkouts.
We tried to learn a bit more about what teachers thought of these walkouts. Current public school teachers were more likely to rank their local school district (60%) and their state government (54%) as the top two responsible for the disruptions from the walkouts than their union or themselves.
Tomorrow, we’ll examine parents’ views on education, specifically their schooling experiences and preferences.
Other Posts in the Schooling in America Series
Schooling in America Series: Getting to Know School Parents
Schooling in America Series: Getting to Know the Public on Public Education