Summarizing 2017’s National K–12 Education and School Choice Surveys
School choice programs received high marks from Americans in 2017.
Five national, highly discussed polls detailed a wide range of public opinion results regarding American education this year. Gallup, the Associated Press-National Opinion Research Center (AP-NORC), Education Next (EdNext), Phi Delta Kappa (PDK) and EdChoice all measured what the public thinks about education and schooling options in 2017.
Most of the polling organizations found support and/or recent gains for certain types of school choice programs and private schools, as well as interesting differences among subgroups and school preferences.
Just as with any type of research, though, it’s important to consider the framing and design of survey questionnaires. The surveys mentioned above all adhere to standard industry methodology and all surveyed representative samples of the American general population. But question wording and operational definitions differ from poll to poll. Interested readers should examine these surveys’ topline and related questionnaire documents to gather even more insight.
With that in mind, let’s dig in.
AP-NORC
Four in 10 respondents of this April University of Chicago-led survey said American parents have too little choice when it comes to where their children attend school. This ratio held when interviewers asked respondents were asked about parents’ schooling choices in their communities, states and nationally, although those who said that parents have too many choices doubled when the question was asked about the country as a whole.
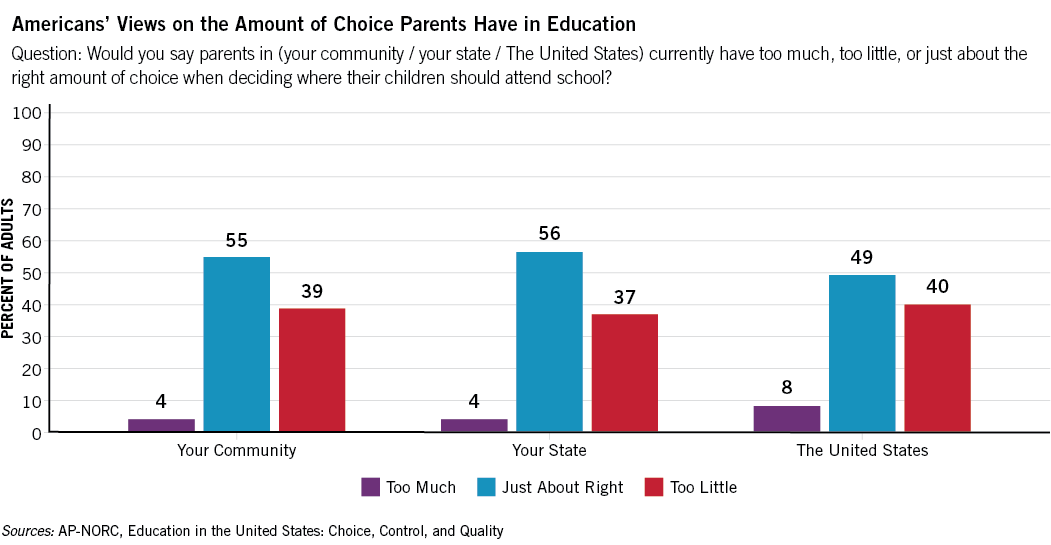
While such responses could conceivably yield support for school choice policies, AP-NORC found low levels of familiarity for such programs. Two-thirds of respondents, including three-fourths of parents, expressed hearing “little or nothing” about vouchers. A similar proportion—about six in 10—were unfamiliar with charter schools. This lack of awareness is even higher than EdChoice found in our latest Indiana survey of parents, hinting at a lot of work state agencies and education reformers have yet to do to educate the public about educational choice options.
Such urgency is heightened by AP-NORC’s results for public district schools. Only 26 percent of respondents and about half (52%) of public school parents described the nation’s public schools to be “excellent” or “good.”
Gallup
This survey, released in late August by the firm many find analogous with American opinion polling, found a 27 percentage point gap between respondents who rated education at private schools vs. public schools as excellent or good. Though 71 percent of respondents rated private schools this way, only 10 percent of American students attend such schools. This disconnect points to a mismatch between the Americans’ preferences and the type of education children actually receive.
While private schools’ ratings slipped slightly since Gallup’s last school rankings survey, released in 2012, they still rank as the preferred option of the American public. Gallup broke private schools down by “independent” and “parochial,” with the two subgroups ranking first and second, respectively, on perceived quality. Public charter schools fell 5 percentage points to 55 percent since 2012 but still ranked third in the survey, followed by homeschooling and public district schools.
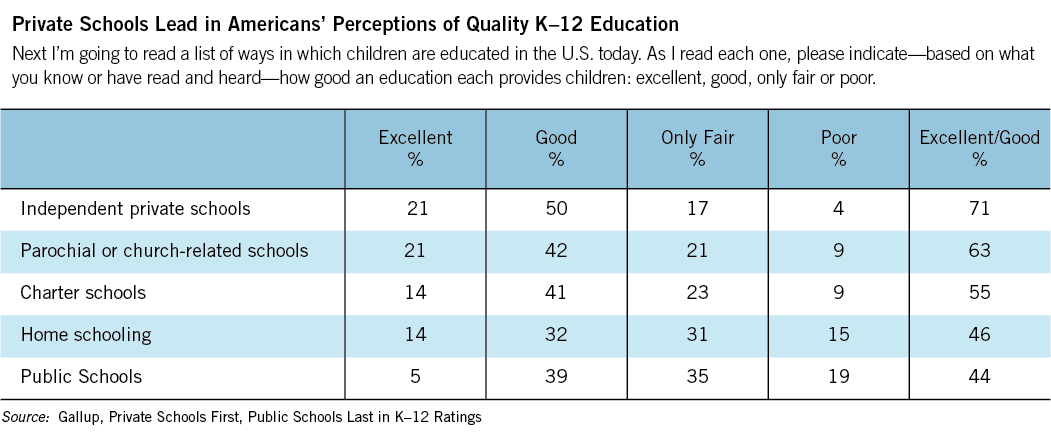
Both Republicans and Democrats expressed similar levels of approval for private schools, but sharply differed on public charters schools. Just 38 percent of Democratic-leaning respondents thought charters do an “excellent or good” job of educating students—the same rate as public district schools—and more than three-fifths (62%) of those who identify as Republicans ranked charters positively.
PDK
This annual poll on the public’s attitudes toward public schools also examined trends on private school choice. It found public support for vouchers has grown 12 percentage points during the past four years, with more than half of that growth generated since mid-2015. Opposition to vouchers fell at a greater rate during this time, decreasing 18 percentage points during the last four years.
PDK asked interesting questions that give insight to the “stickiness” of private school tuition and voucher amounts. About half (54 percent) of public school parents would stick with their child’s school if given funds to send to a private institution. The question was worded in a way that presumed all of the private school tuition would be covered in such a scenario. The number of respondents saying they would keep their child in a public school ballooned to 72 percent when the theoretical voucher amount was decreased to half of tuition costs.
The poll’s analysis focused on traditional public schooling, finding 62 percent of public school parents rated their children’s district schools as an “A” or “B.” Just a third of parents said they’d pick a traditional public school if location and money weren’t issues.
Interviewers for this poll have asked at least 10 different voucher-related questions since 1970, with three versions used most frequently. The figure below displays support trends of these versions.
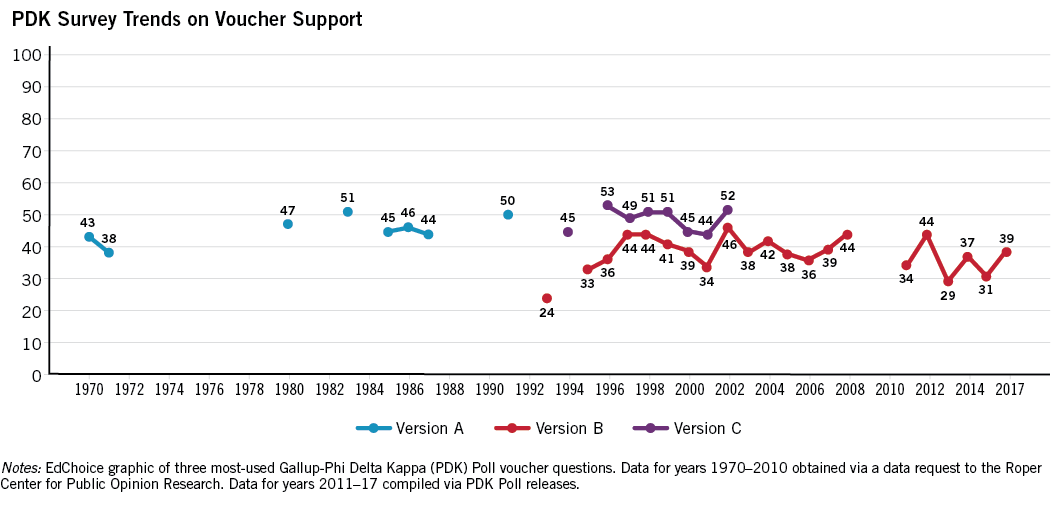
As the chart shows, the voucher question has been volatile in PDK polls, especially in recent years. These variances and possibly loaded language point to this year’s low level of voucher support (39%) being an extremum in this poll’s long history.
Education Next
School Choice was just one of 10 education-related topics that this poll detailed during its summer launch and winter journal publication.
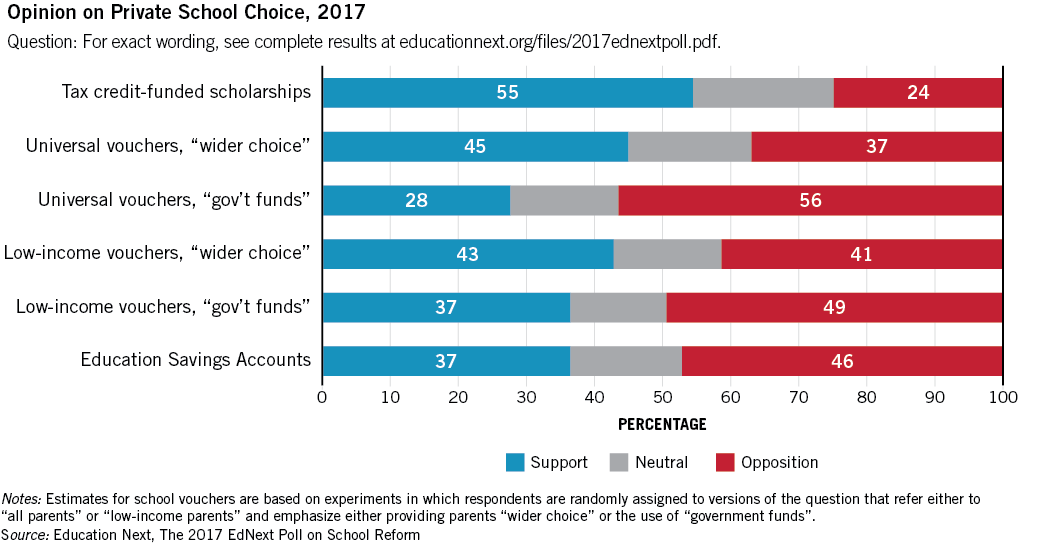
As EdNext found in its previous annual surveys, tax-credit scholarships continue to be the most popular form of private school choice based on their results. Opposition to tax-credit scholarships fell from 29 percent to 24 percent since last year, but vouchers also gained steam.
In contrast to Gallup and our own national survey, EdNext found a sharp drop in support for charters—and from both major political parties. Support dropped 12 percentage points since last year’s survey. The EdNext report’s authors explored the Trump administration’s support for charters as a possible reason for the drop, but discounted that reason when noting “informing Americans of the president’s position on charters actually lifts their level of support.”
EdChoice’s 2017 Schooling in America Survey
Our annual national survey focused special attention on small town and rural residents via an oversample of this population. We found small town and rural children had experiences with public district schools at a greater rate (87%) than urban respondents (83%). Those living in small towns and rural communities, though, were significantly more likely (15%) to prefer homeschooling than their urban (6%) and suburban (5%) counterparts. A lack of charter and private school options in these communities compared with urban and suburban dwellings may explain this finding.
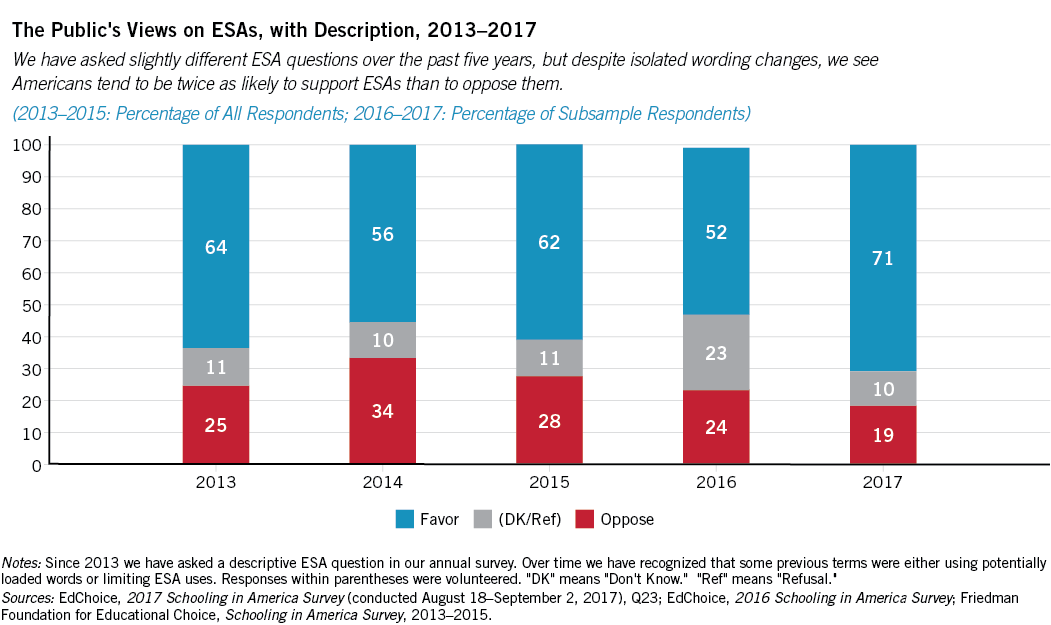
But among the general population we also saw steadfast support for private school choice programs. Education savings accounts (ESAs), in particular, saw a large bump compared to last year. Americans were more than twice as likely to support (71%) ESAs than to oppose (19%) them when interviewers provided them a definition of these flexible education spending alternatives, which itself was a jump from the baseline, non-descriptive support level (45%). Similar questions were used to measure how support changes when respondents are provided with definitions for vouchers (37% support vs. 62% when provided a definition) and charter schools (50 vs. 61%).
We also found that most school parents rate their school districts well, but at least one-third gave low marks in several district performance categories. These include: providing academic support outside the classroom (42%), being responsive/proactive in unique situations (40%), counseling services (38%) and communicating effectively with parents (35%).
Finally, only 11 percent of respondents could estimate the correct range of K–12 funding in the United States. When provided with the national average ($11,392 in 2014–15), the proportion of respondents that said education spending was “too low” shrank from 54 percent to 38 percent.
—
As mentioned in the 2017 Schooling in America Survey, public policy debates surrounding K–12 education should include the input of the public. These survey results serve as conduits for the American people, who in 2017 expressed growing support for school choice and continued diverse preferences for schooling and educational options. While more survey work is to be done in 2018, these results can serve as a public opinion road map for policymakers in the coming year.