Support for School Choice Rose in December 2022, Quarter of Parents Report Switching School Types
As the new year’s celebrations wind down and calendars turn to a new page, many of us await what 2023 will bring to American K-12 education. Deliberating on resolutions for the new year is already underway, and one important aspect of that is reflecting on lessons learned from the previous year.
How do Americans–and importantly, parents–feel about their K-12 education experiences as 2022 wrapped up? What are their biggest educational priorities for 2023?
In partnership with Morning Consult, EdChoice surveyed a nationally representative sample of American adults 18 and older (N=2,200) from December 9-12, 2022. With additional sampling, we obtained responses from 1,186 parents of children currently in K-12 education. We asked a plethora of questions regarding funding, how parents felt their child progressed over the year, how often children switched schools, and opinions on learning pods, school choice, and more. We also included a new question about children’s eligibility for free and reduced-priced meals. The full report can be found here, but for now here are the top takeaways from the December edition of our public opinion tracker:
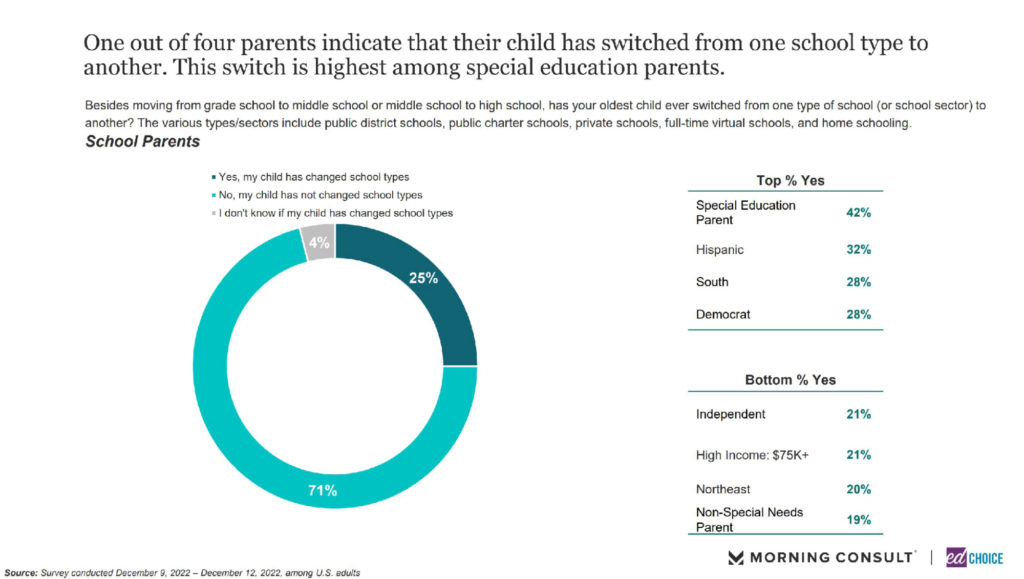
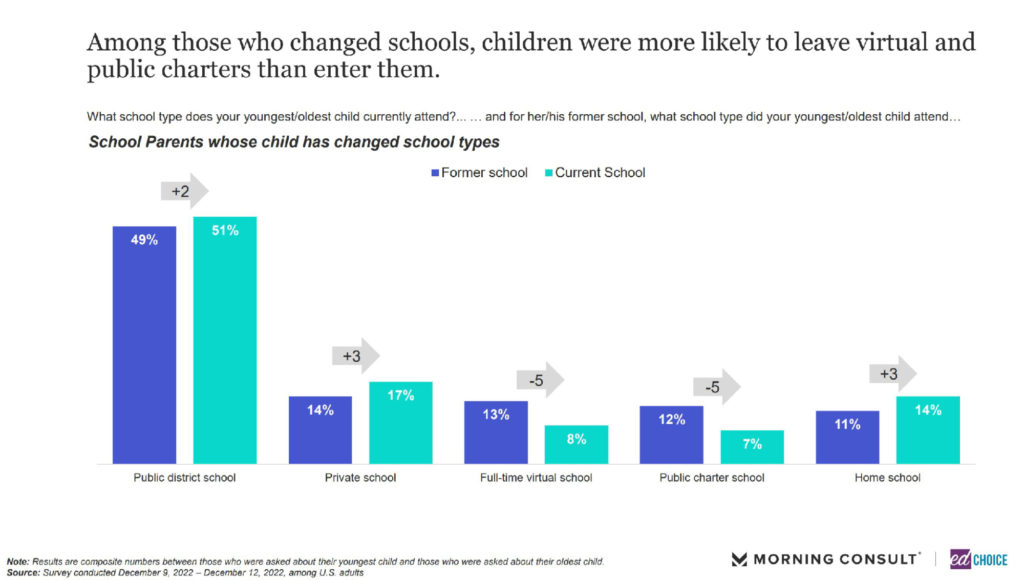
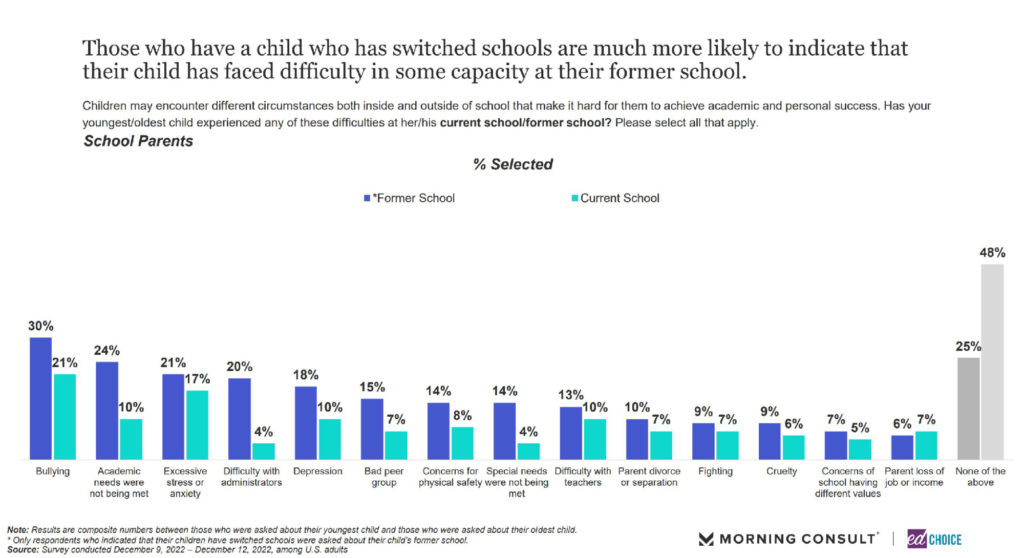
1. One out of four parents report their child switching from one school type to another. We posed the following question to parents: “Besides moving from grade school to middle school or middle school to high school, has your oldest child ever switched from one type of school (or school sector) to another?” Special education and Hispanic parents were the most likely to report their child having switched from one school type to another, at 42 and 32 percent, respectively. We also examined which type of school parents removed their child from and which type of school parents sought for their child. Public district schools, private schools, and homeschools were school types that parents were more likely to move their children to. On the other hand, children were more likely to leave full time virtual schooling and public charter schools than enter them. When asked why parents were looking to switch the type of school their child attends, bullying and failing to meet the child’s academic needs were the two most popular reasons. Parents report their child facing these difficulties less frequently at their current school.
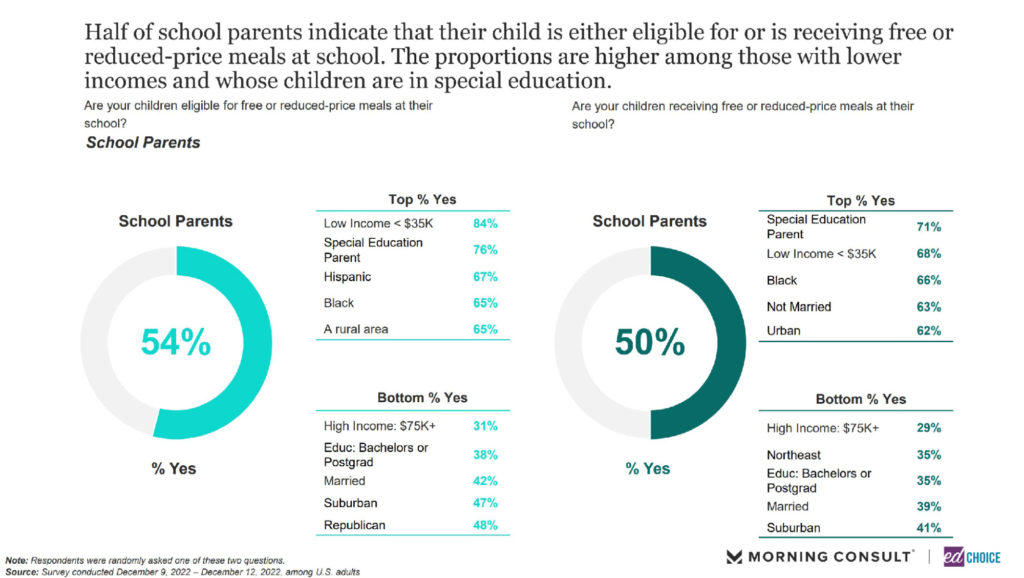
2. Half of parents report their child receives free or reduced-price meals at their school. For the first time in our polling, we asked parents whether their child is eligible to receive, or is currently receiving, free or reduced-price meals at their school. More than half of parents (54%) indicated their child is eligible for free or reduced-price meals at their school. Our data aligns with recent National Center for Education Statistics findings on the matter, showing that 52 percent of students in our country are eligible for free and reduced-priced meals at school. The demographic breakdown yielded some noteworthy findings. Among parents who report their child receiving free or reduced-price meals at their school, parents with lower incomes and parents of children in special education were the most likely. Additionally, nearly two-thirds of parents from urban communities said their child receives free or reduced-priced meals at their school.
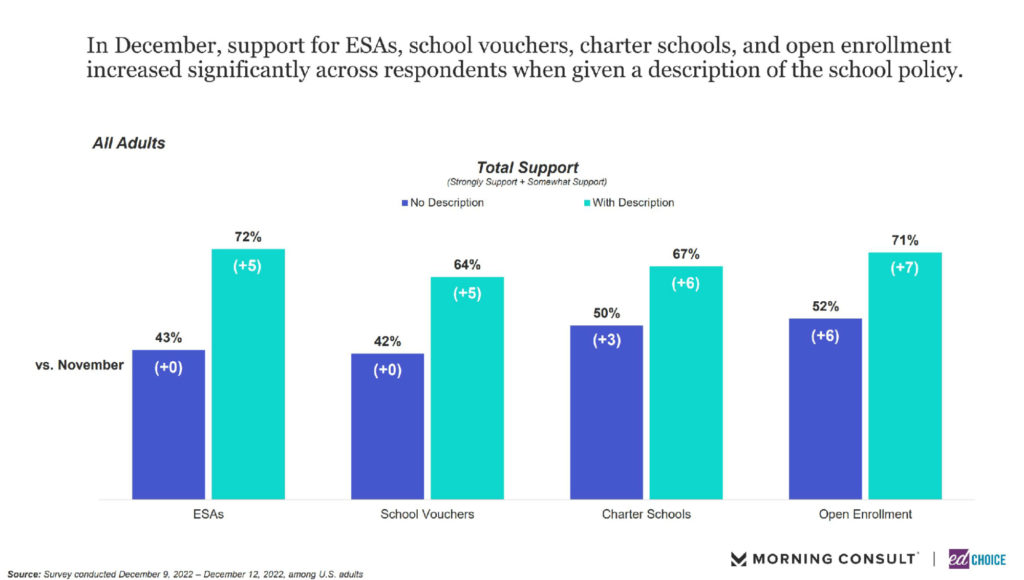
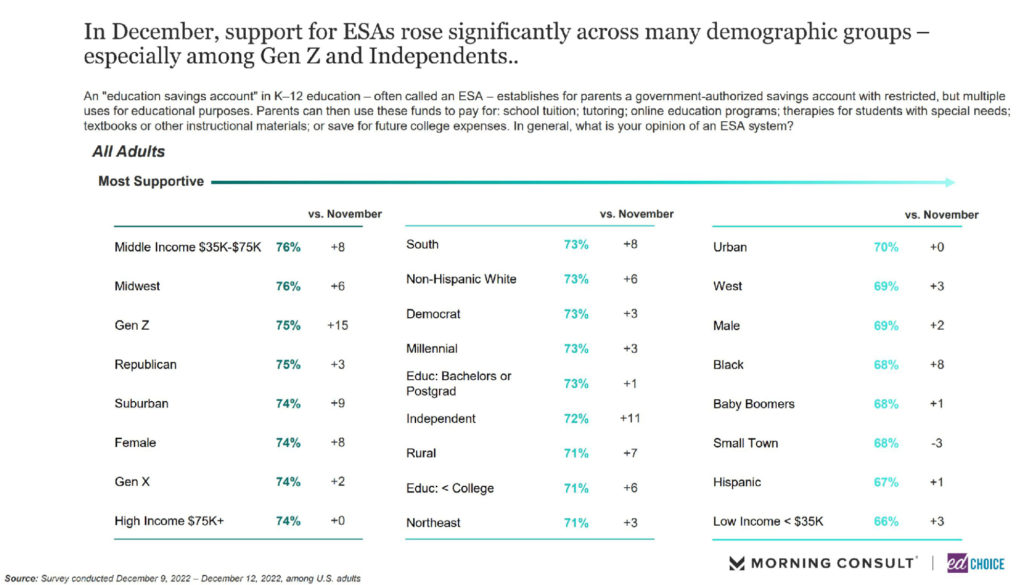
3. Support for school choice policies increased significantly in December. November saw decreased support across the board for school choice policies, but support rebounded in December for education savings accounts (ESAs), vouchers, charter schools, and open enrollment with increases of 5 points, 5 points, 6 points and 7 points, respectively. The breakdown of support among different demographics for these policies is usually ripe with interesting headlines, but a few stuck out. Middle income earners ($35K-$75K) and Gen-Z support for school choice policies increased significantly across the board in December. In December, Middle income earners and Gen-Z were the two most likely groups to support ESAs after 8-point and 15-point increases from November, respectively. Some demographic groups tend to yo-yo with their levels of support with these policies, so it will be interesting to see where these particular groups land next month.
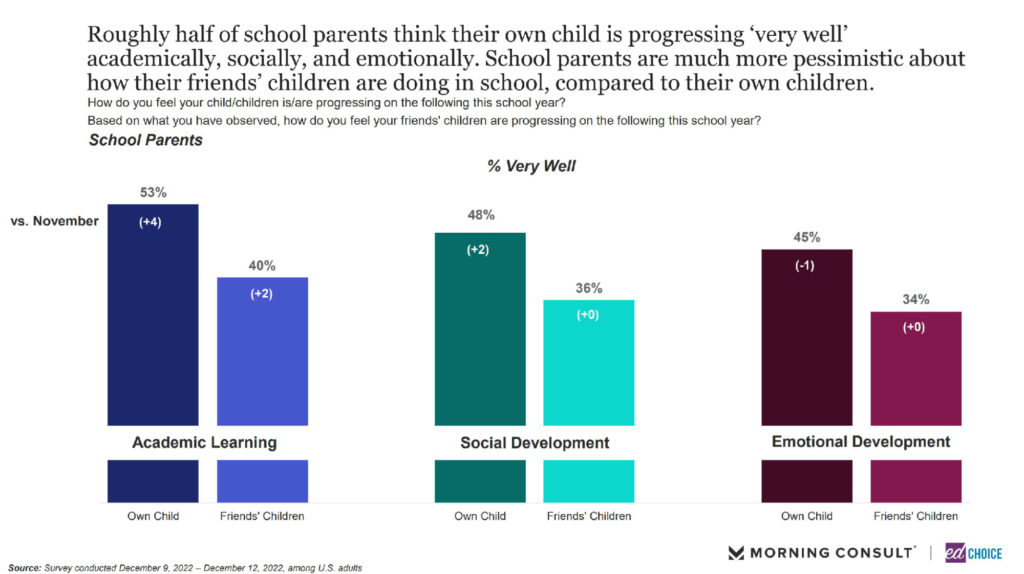
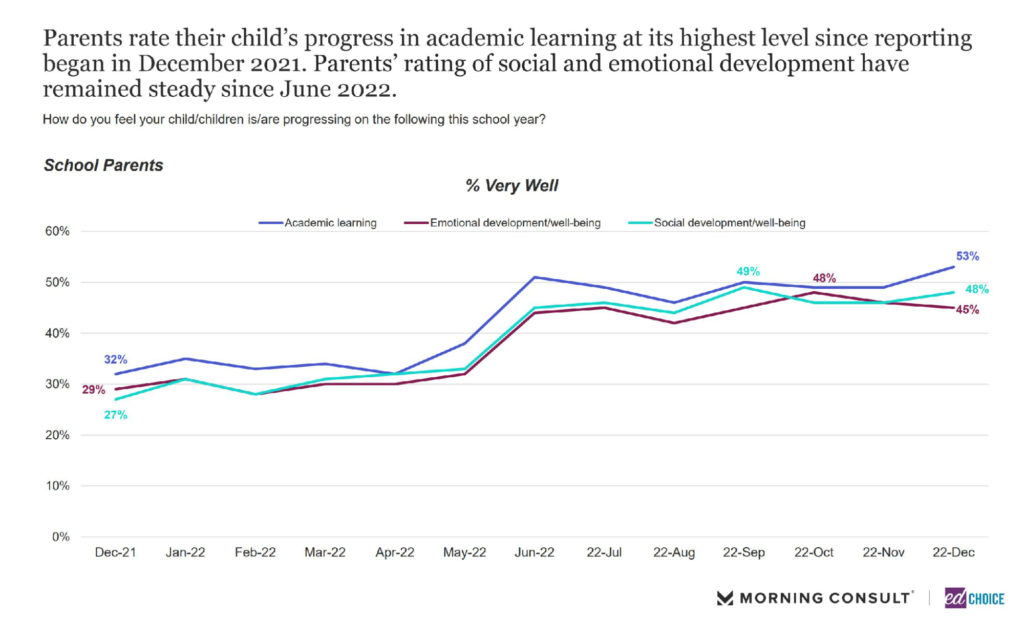
4. More than half of parents believe their child is progressing very well academically this year. The proportion of parents (53%) who believe their child is progressing very well academically is at its highest level since we started asking this question in December 2021. When looking at emotional and social development, nearly half of parents believe their child is progressing very well this year. When asked about their friends’ children, however, only 40 percent of parents believe their friends’ children are progressing very well academically. Since we first began asking about children other than their own, parents are consistently more confident in their own child’s progression. That trend continued this month. There are many reasons why parents might feel this way, but one worthy of note is that nearly 60 percent of parents believe their child’s teacher does an effective job teaching English/Language Arts and Math.


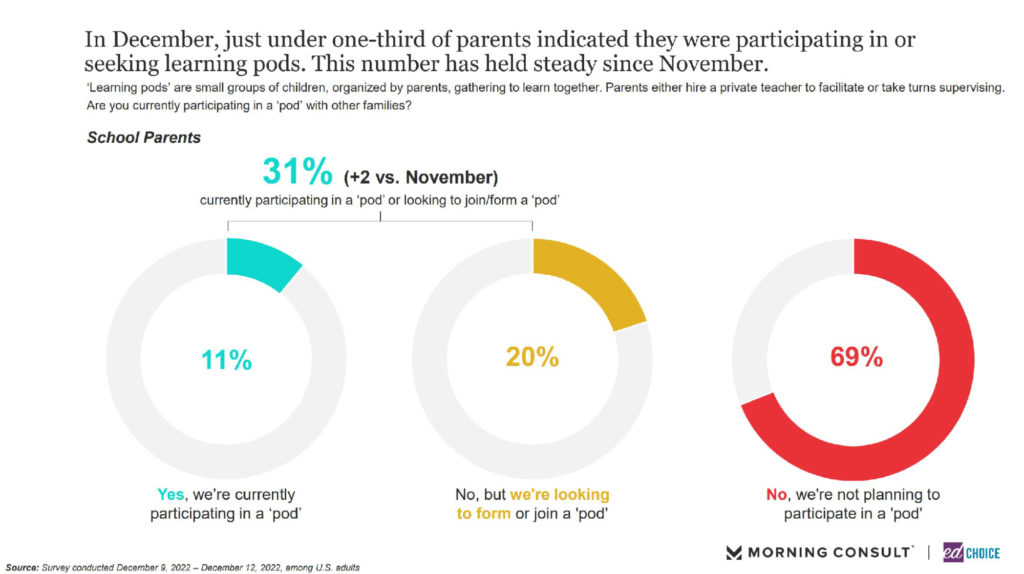
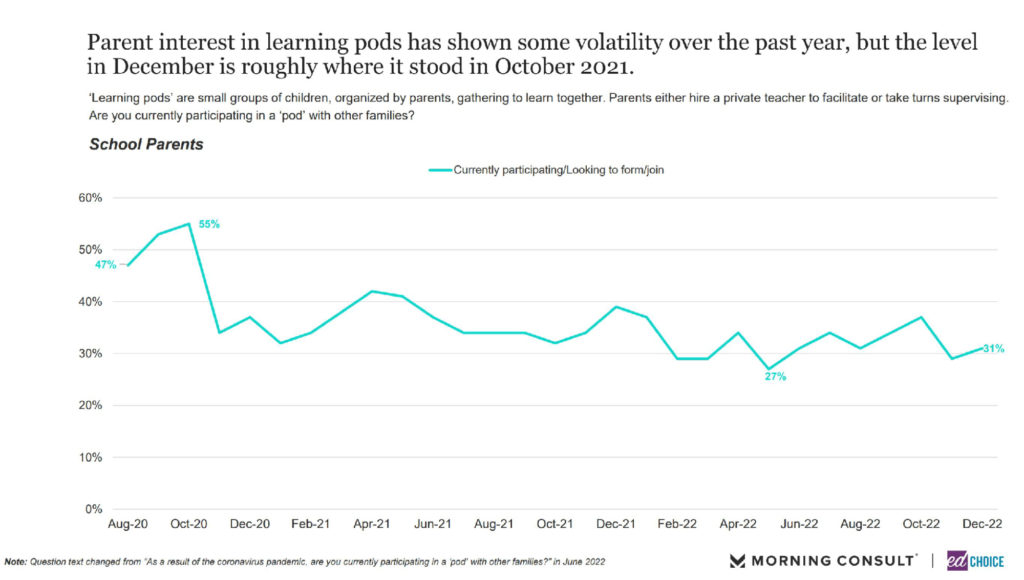
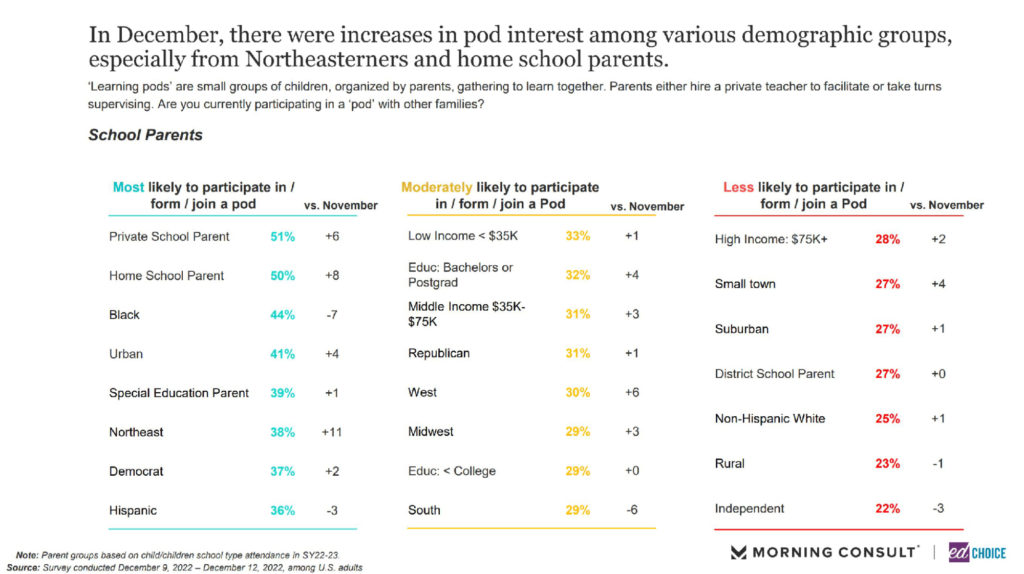
5. Interest in learning pods increased slightly in December. After a significant decrease in November, interest in learning pods bounced back slightly last month. Now, roughly one-third of parents are participating or looking to join a learning pod. Of those parents, the majority desire learning pod instruction in addition to, and supplementing, regular schooling. Of the parents participating in or looking for a pod, only roughly one in four parents are looking for a learning pod as substitute for regular schooling. Diving into the demographics, private school and homeschool parents are the most likely to participate or form a learning pod.
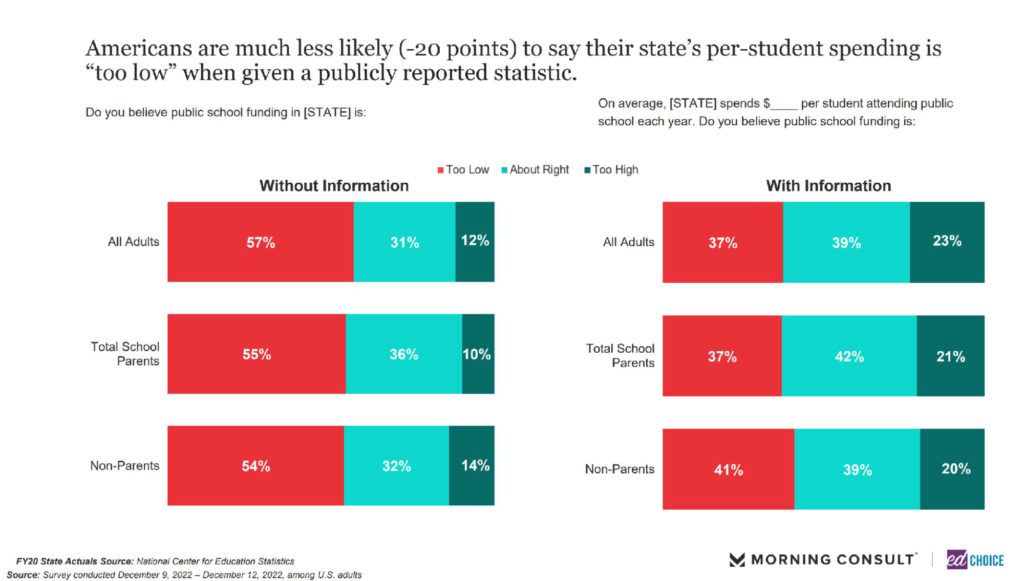
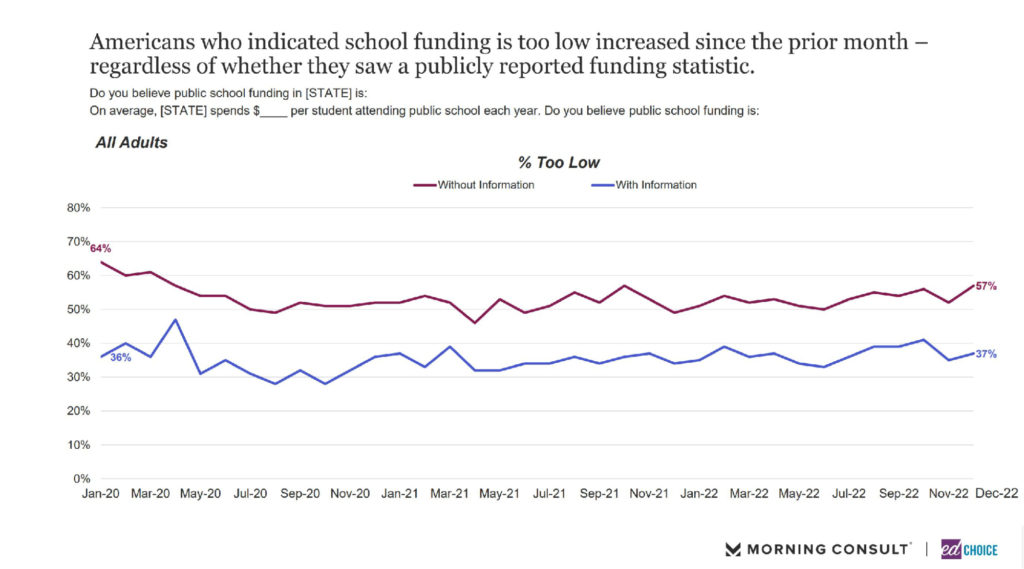
6. The majority of Americans believe their state’s per–student spending is too low—until more information is provided. Without being provided data, 57 percent of Americans and 55 percent of parents believe the funding in their state’s public schools is too low. When shown how much states are spending per-student, the proportion of Americans who still believe per-student spending is too low in their state drops significantly (37%). On the other hand, 10 percent of parents and 12 percent of Americans believe funding is too high in their state’s public schools without any information provided. However, when information is provided, the proportions of parents and Americans who believe funding is too high nearly doubles.
Visit the EdChoice Public Opinion Tracker site to access past reports, crosstabs, and questionnaires. We update our national and state dashboards every month. We also provide a more in-depth description of our research and survey methods.
Our K–12 education polls archive is updated on a rolling basis, roughly a few times each month. Please don’t hesitate to let us know if we are missing any surveys, or if there are accidental errors.