U.S. States Ranked by Educational Choice Share, 2019
Where are America’s students getting their education? Which types of schools and educational settings are they choosing?
MID-YEAR UPDATE: With the recent release of results from the 2017–18 Private School Universe Survey, this post has been updated to include 2017–18 private school enrollment data, 2017–18 homeschooler estimates, 2016–17 charter school enrollment data, and 2016–17 public district school enrollment data (total public minus charter), along with an update to the numbers of students enrolled in an education savings account, school voucher or tax-credit scholarship program.
First, this post—our second annual—coins the term Educational Choice Share (or EdChoice Share) to represent the proportion of all K–12 students who are enrolled in an education savings account, school voucher or tax-credit scholarship program.
To get this number, I divided the total number of a state’s educational choice program participants by the total number of K–12 students in the state. More on how we do our calculations can be found in our first annual EdChoice Share post here.
Second, this post not only ranks the states by highest and lowest EdChoice Share, but also it provides a state-by-state breakdown of public district school share, charter school share, home school share and “out of pocket” private school share—which we describe as “by other means” or “Other Private School Share.”
Why do we care about this?
Data from our 2018 national poll shows American parents—for myriad reasons—are not able to access the types of schools they’d prefer for their children.
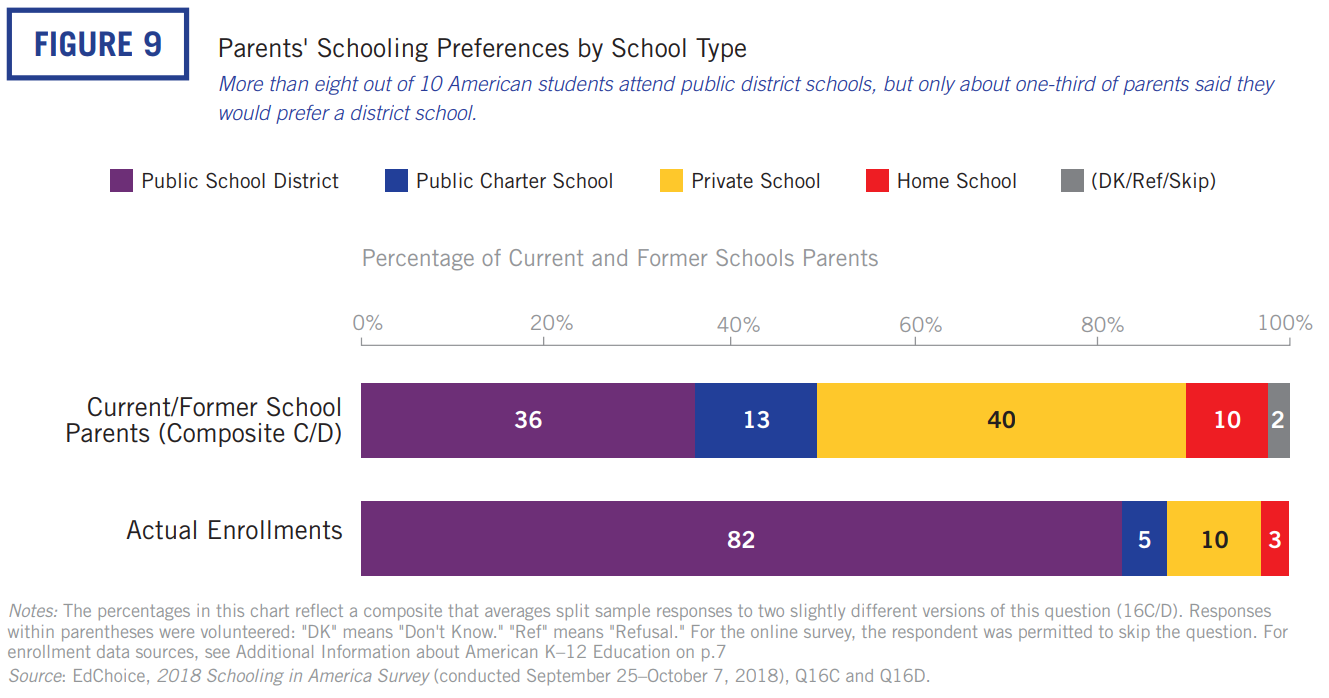
If our K–12 education system is innovating and finding ways to better serve students and their families, then—as years pass—we would expect the numbers below to begin looking more and more like the chart above.
On a national level:
• 0.9 percent of students are utilizing a private educational choice program
• 8.0 percent attend private school by other means
• 83.1 percent attend a public district school
• 5.4 percent attend a charter school, and
• 2.6 percent are homeschooled.
On a state level:
EdChoice Share 2019
| State | Number of Programs | EdChoice Share | Other Private School Share | Public District School Share | Charter School Share | Home School Share |
|---|---|---|---|---|---|---|
| Arizona | 5 | 5.4% | <1.0% | 77.7% | 15.6% | 2.7% |
| Florida | 5 | 4.4% | 8.0% | 76.2% | 8.7% | 2.8% |
| Wisconsin | 5 | 4.2% | 9.7% | 79.4% | 4.6% | 2.2% |
| Indiana | 3 | 3.8% | 7.0% | 83.0% | 3.6% | 2.6% |
| Vermont | 1 | 3.9% | 5.8% | 87.8% | - | 2.5% |
| Maine | 1 | 2.6% | 6.2% | 87.4% | 1.0% | 2.7% |
| Ohio | 5 | 2.6% | 8.5% | 81.2% | 6.1% | 1.6% |
| Pennsylvania | 2 | 2.3% | 10.0% | 78.4% | 6.6% | 2.6% |
| Iowa | 2 | 2.0% | 6.4% | 88.9% | 0.1% | 2.6% |
| District of Columbia | 1 | 1.9% | 13.2% | 40.2% | 42.3% | 2.4% |
| Louisiana | 4 | 1.1% | 14.5% | 73.3% | 9.5% | 1.6% |
| Georgia | 2 | 0.9% | 6.2% | 86.0% | 3.5% | 3.4% |
| North Carolina | 3 | 0.6% | 5.5% | 81.0% | 5.2% | 7.7% |
| Nevada | 1 | 0.6% | 3.6% | 85.2% | 8.0% | 2.7% |
| Oklahoma | 2 | 0.4% | 3.4% | 90.0% | 3.5% | 2.7% |
| Alabama | 2 | 0.4% | 7.0% | 89.9% | - | 2.6% |
| Illinois | 2 | 0.3% | 9.5% | 84.7% | 3.0% | 2.6% |
| Maryland | 1 | 0.3% | 12.9% | 82.1% | 2.2% | 2.6% |
| Virginia | 1 | 0.3% | 7.2% | 89.7% | <0.1% | 2.6% |
| South Dakota | 1 | 0.3% | 6.6% | 89.9% | - | 3.2% |
| South Carolina | 2 | 0.3% | 5.8% | 87.3% | 4.0% | 2.7% |
| Rhode Island | 1 | 0.2% | 10.3% | 81.8% | 5.1% | 2.6% |
| New Hampshire | 2 | 0.2% | 12.2% | 83.5% | 1.7% | 2.5% |
| Utah | 1 | 0.1% | 2.7% | 84.1% | 10.5% | 2.6% |
| Mississippi | 3 | 0.1% | 7.8% | 89.3% | - | 2.7% |
| Arkansas | 1 | <0.1% | 4.7% | 86.2% | 5.4% | 3.7% |
| Kansas | 1 | <0.1% | 7.4% | 89.2% | 0.6% | 2.7% |
| Montana | 1 | <0.1% | 5.3% | 91.3% | - | 3.4% |
| Tennessee | 2 | <0.1% | 7.8% | 86.2% | 3.2% | 2.7% |
| Minnesota | 2 | Not Available | 11.5% | 81.1% | 5.5% | 1.9% |
| Alaska | 0 | - | 2.5% | 90.0% | 4.9% | 2.6% |
| California | 0 | - | 8.1% | 80.8% | 8.7% | 2.4% |
| Colorado | 0 | - | 4.6% | 82.2% | 12.4% | 0.8% |
| Connecticut | 0 | - | 9.7% | 86.1% | 1.6% | 2.6% |
| Delaware | 0 | - | 14.2% | 74.8% | 9.2% | 1.8% |
| Hawaii | 0 | - | 16.7% | 75.9% | 4.8% | 2.6% |
| Idaho | 0 | - | 5.3% | 85.6% | 6.4% | 2.7% |
| Kentucky | 0 | - | 10.0% | 87.4% | - | 2.6% |
| Massachusetts | 0 | - | 10.4% | 84.8% | 4.1% | 0.7% |
| Michigan | 0 | - | 7.7% | 80.7% | 8.9% | 2.6% |
| Missouri | 0 | - | 11.4% | 83.8% | 2.2% | 2.6% |
| Nebraska | 0 | - | 12.9% | 84.5% | - | 2.6% |
| New Jersey | 0 | - | 11.9% | 82.4% | 3.1% | 2.6% |
| New Mexico | 0 | - | 5.6% | 87.1% | 7.2% | <0.1% |
| New York | 0 | - | 13.5% | 79.8% | 4.1% | 2.6% |
| North Dakota | 0 | - | 6.6% | 90.7% | - | 2.6% |
| Oregon | 0 | - | 6.8% | 84.5% | 5.1% | 3.6% |
| Texas | 0 | - | 5.0% | 86.8% | 5.6% | 2.6% |
| Washington | 0 | - | 6.9% | 91.2% | - | 1.8% |
| West Virginia | 0 | - | 4.5% | 92.9% | - | 2.6% |
| Wyoming | 0 | - | 1.6% | 95.1% | 0.5% | 2.7% |
Notes: I did not include data on individual tax credit or deduction programs, unless it was a refundable credit, which is why Minnesota’s EdChoice Share is Not Available. Kansas and Virginia provide counts of unduplicated scholarship students and Iowa and Florida do not allow students to receive more than one tax-credit scholarship, but I assumed 25 percent of tax-credit scholarships went to multi-scholarship students in Arizona and 10 percent in all other states.