U.S. States Ranked by Educational Choice Share, 2018
We have arrived at that time of year where we look at where each state’s students are educated. Similar to last year, the EdChoice Share looks at what proportion of all K–12 students are enrolled in an education savings account (ESA), voucher or tax-credit scholarship program.
To get this number, I divided the total number of a state’s program participants by the total number of K–12 students in the state.
All of the charter school enrollment data, public district school enrollment data (total public minus charter), private school enrollment data, and homeschooler estimates are for 2015–16.
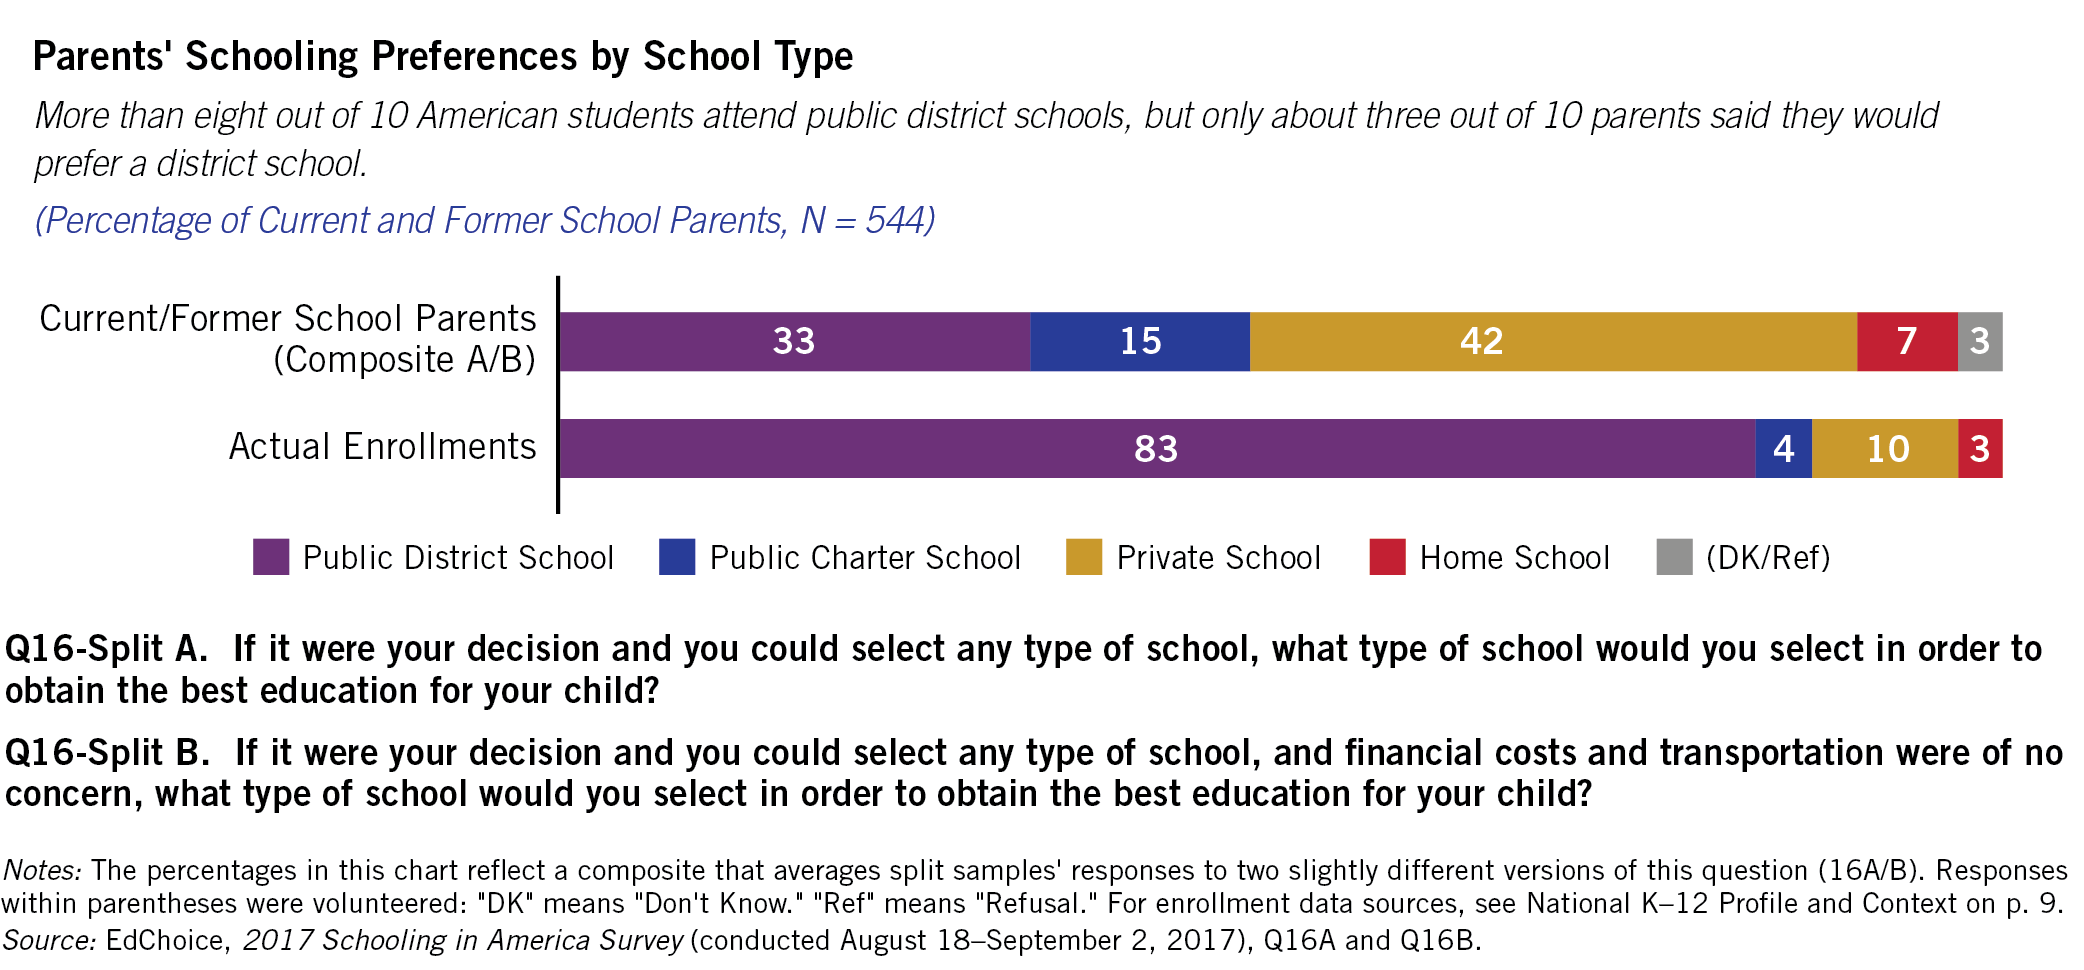
Those are the same four categories from our national poll:

On a national level:
- 0.8 percent of students are utilizing an educational choice program
- 7.9 percent attend private school by other means
- 83.7 percent attend a public district school
- 5.0 percent attend a charter school, and
- 2.6 percent are homeschooled.
On a state level:
EdChoice Share 2018
| EdChoice Share Rank | State | Number of Programs | EdChoice Share | Other Private School Share | Public District School Share | Charter School Share | Home School Share |
|---|---|---|---|---|---|---|---|
| 1 | Arizona | 5 | 5.00% | <0.1% | 78.50% | 14.90% | 2.70% |
| 2 | Florida | 3 | 4.70% | 5.50% | 78.80% | 8.50% | 2.60% |
| 3 | Wisconsin | 5 | 3.60% | 8.80% | 81.30% | 4.40% | 1.90% |
| 4 | Indiana | 3 | 3.40% | 8.70% | 81.70% | 3.20% | 2.90% |
| 5 | Vermont | 1 | 3.40% | 6.00% | 88.10% | - | 2.50% |
| 6 | Maine | 1 | 2.80% | 5.70% | 88.20% | 0.70% | 2.60% |
| 7 | Ohio | 5 | 2.30% | 8.90% | 80.20% | 6.00% | 2.70% |
| 8 | Pennsylvania | 2 | 1.90% | 11.60% | 78.90% | 6.50% | 1.10% |
| 9 | Iowa | 2 | 1.70% | 8.50% | 87.20% | <0.1% | 2.50% |
| 10 | District of Columbia | 1 | 1.10% | 14.40% | 47.40% | 35.20% | 1.90% |
| 11 | Louisiana | 4 | 1.00% | 16.10% | 72.10% | 8.30% | 2.50% |
| 12 | Georgia | 2 | 0.80% | 7.70% | 85.30% | 3.70% | 2.50% |
| 13 | Alabama | 2 | 0.50% | 7.20% | 89.60% | - | 2.70% |
| 14 | North Carolina | 3 | 0.40% | 5.80% | 82.50% | 4.70% | 6.70% |
| 15 | Oklahoma | 2 | 0.40% | 3.30% | 91.10% | 2.70% | 2.50% |
| 16 | Maryland | 1 | 0.30% | 11.60% | 83.50% | 2.00% | 2.60% |
| 17 | Virginia | 1 | 0.20% | 7.50% | 89.90% | <0.1% | 2.30% |
| 18 | Rhode Island | 1 | 0.20% | 10.80% | 81.90% | 4.40% | 2.70% |
| 19 | South Carolina | 2 | 0.20% | 5.60% | 88.10% | 3.50% | 2.60% |
| 20 | South Dakota | 1 | 0.20% | 5.80% | 91.30% | - | 2.70% |
| 21 | New Hampshire | 2 | 0.10% | 9.50% | 86.20% | 1.40% | 2.70% |
| 22 | Utah | 1 | 0.10% | 2.50% | 85.00% | 9.90% | 2.50% |
| 23 | Nevada | 1 | 0.10% | 3.70% | 86.50% | 7.00% | 2.60% |
| 24 | Mississippi | 3 | <0.1% | 7.00% | 90.20% | - | 2.70% |
| 25 | Kansas | 1 | <0.1% | 6.90% | 89.90% | 0.60% | 2.60% |
| 26 | Arkansas | 1 | <0.1% | 5.70% | 87.20% | 4.50% | 2.60% |
| 27 | Montana | 1 | <0.1% | 6.00% | 91.20% | - | 2.80% |
| 28 | Tennessee | 1 | <0.1% | 7.20% | 87.50% | 2.60% | 2.70% |
| - | Illinois | 2 | Not Available | 9.90% | 84.70% | 2.70% | 2.60% |
| - | Minnesota | 2 | Not Available | 7.10% | 84.90% | 5.30% | 2.70% |
| - | Alaska | 0 | - | 3.20% | 89.70% | 4.50% | 2.60% |
| - | California | 0 | - | 7.80% | 81.30% | 8.20% | 2.60% |
| - | Colorado | 0 | - | 4.90% | 81.30% | 11.20% | 2.50% |
| - | Connecticut | 0 | - | 10.10% | 88.10% | 1.50% | 0.30% |
| - | Delaware | 0 | - | 11.20% | 78.30% | 8.80% | 1.70% |
| - | Hawaii | 0 | - | 18.20% | 74.70% | 4.50% | 2.60% |
| - | Idaho | 0 | - | 4.40% | 86.70% | 6.20% | 2.70% |
| - | Kentucky | 0 | - | 8.00% | 89.30% | - | 2.60% |
| - | Massachusetts | 0 | - | 9.60% | 84.10% | 3.70% | 2.60% |
| - | Michigan | 0 | - | 8.80% | 80.20% | 8.40% | 2.70% |
| - | Missouri | 0 | - | 10.40% | 84.90% | 2.00% | 2.60% |
| - | Nebraska | 0 | - | 11.90% | 85.60% | - | 2.50% |
| - | New Jersey | 0 | - | 10.60% | 84.30% | 2.50% | 2.50% |
| - | New Mexico | 0 | - | 5.40% | 85.80% | 6.00% | 2.80% |
| - | New York | 0 | - | 14.20% | 79.60% | 3.60% | 2.60% |
| - | North Dakota | 0 | - | 5.40% | 92.00% | - | 2.60% |
| - | Oregon | 0 | - | 7.30% | 84.50% | 4.80% | 3.50% |
| - | Texas | 0 | - | 4.70% | 87.90% | 5.00% | 2.40% |
| - | Washington | 0 | - | 6.90% | 90.40% | - | 2.60% |
| - | West Virginia | 0 | - | 4.30% | 92.00% | - | 3.70% |
| - | Wyoming | 0 | - | 1.50% | 95.30% | 0.50% | 2.70% |
Notes: I did not include data on individual tax credit or deduction programs, unless it was a refundable credit, which is why Minnesota’s EdChoice Share is Not Available. Illinois’s tax-credit scholarship program will not start providing scholarships until later this year. Kansas and Virginia provide counts of unduplicated scholarship students and Iowa and Florida do not allow students to receive more than one tax-credit scholarship, but I assumed 25 percent of tax-credit scholarships went to multi-scholarship students in Arizona and 10 percent in all other states.


