Friday Freakout: Are Friedman Surveys Reliable?
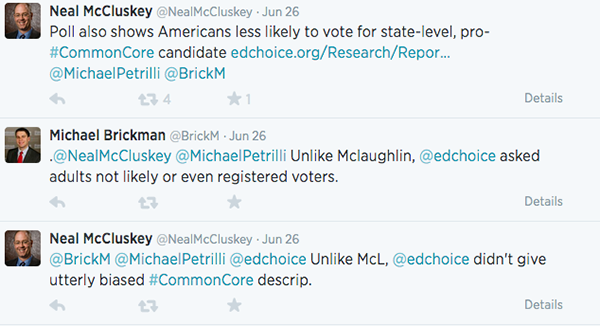
This week, we released our 2014 Schooling in America Survey. In it, we asked a representative sample of American adults, not just voters, their views on issues such as the state of education, school choice, Common Core State Standards, and standardized testing. Some of our fellow school choice supporters – some from the Thomas B. Fordham Institute, some from the CATO Institute – had a frank discussion on social media about our findings, which brings us to today’s friendly “freakout.”
That said, let’s compare the wording of the questions asked in our poll questions that include context against the polls mentioned in the conversation above.
On Common Core
“Common Core State Standards are simply a set of standards in Math and English which state what a child should know in both subjects by the end of each grade of school they complete. Common Core set expectations for what students should be able to achieve and compare schools from state to state. Knowing this, do you approve or disapprove of the Common Core State Standards?”
65 percent of respondents said they approve of Common Core
29 percent said they disapprove
Baseline without definition – 35 percent approve, 33 percent disapprove
The objective of Common Core State Standards Initiative is to establish similar academic standards and comparable tests across all states for students in grades K-12. The standards were initially developed by the National Governors Association and Council of Chief State School Officers. States and districts have adopted the common standards and tests in association with U.S. Department of Education incentives. In general, do you favor or oppose the “Common Core”?
50 percent of respondents said they favor Common Core
41 percent said they oppose
Baseline without definition – 34 percent favor, 39 percent oppose
On Vouchers
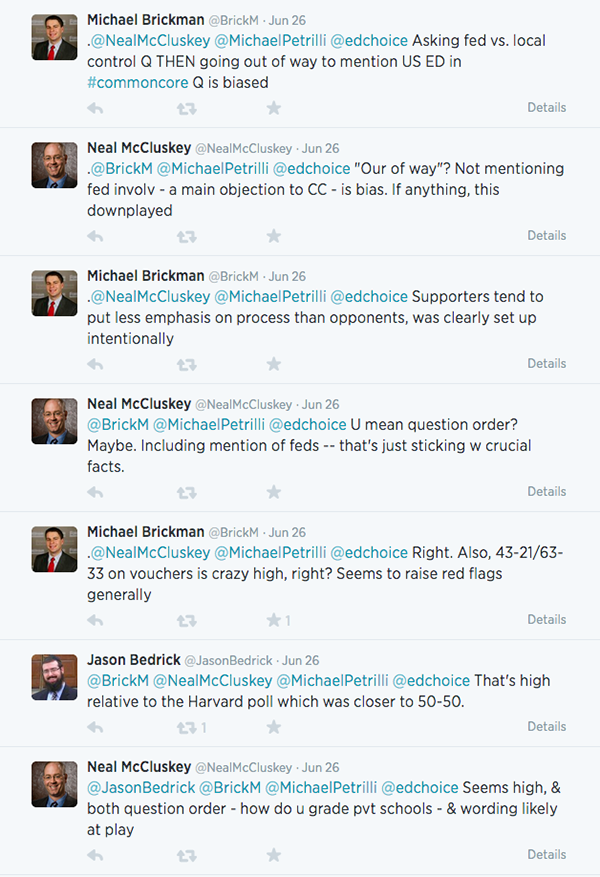
The 2013 “Harvard” poll:
“A proposal has been made that would give families with children in public schools a wider choice, by allowing them to enroll their children in private schools instead, with government helping to pay the tuition. Would you favor or oppose this proposal?”
44 percent of respondents said they support or somewhat support
37 percent said they oppose or somewhat oppose
This poll didn’t ask a baseline question.
A school voucher system allows parents the option of sending their child to the school of their choice, whether that school is public or private, including both religious and non-religious schools. If this policy were adopted, tax dollars currently allocated to a school district would be allocated to parents in the form of a “school voucher” to pay partial or full tuition for their child’s school. In general, do you favor or oppose a school voucher system?
63 percent of respondents said they favor school vouchers
33 percent said they oppose
Baseline without definition – 43 percent favor, 21 percent oppose
We can’t say whether those definitions are objective or biased, too descriptive or not descriptive enough. That is up to individuals to decide for themselves.
What we can say is that we take great care to minimize bias through wording, response order, and question order in our polls. We believe that describing how a concept works (i.e. process) is absolutely necessary for ensuring someone understands that idea. For those who choose not to trust the responses to questions that provide description, we often ask a baseline question that eliminates that issue.
We encourage poll observers to compare the wording and ordering of questions across the landscape of education surveys. The ordering of our questions, including which questions are rotated or randomized, can be found after page 80 of the report.
In the end, we can be sure of only a few things in this world: death, taxes, and the questioning of polling and survey research motives. For what it’s worth, our motive is to present all of the results as they come. Accurate results based on the most unbiased methods possible provide us more value than “swayed” results ever could. After all, how can we know how much more work we must do educating Americans on school choice if we’ve overestimated the number who already support it?
Friedman Foundation Research Director Paul DiPerna discussed these issues and more on a panel yesterday with a few policy experts and pundits who also care about these issues. Check the video out here for more opinions on these survey findings. Enjoy!

