Schooling in America Series: Parents’ Views on Accountability and School Choice
Not long ago, school choice programs in places like Mississippi simply didn’t exist. Now, not only does the state have charter schools, two voucher programs and an education savings account program, but parents are rallying for expanding these and other choices.
Are such rallies really an indication that school choice policies are popular among parents? And how do parents view these programs and education accountability policies on a national scale?
In this series, we’re incorporating other polls and current events to add context to our 2018 Schooling in America Survey. Today, we’re taking a closer look at parents’ views of school choice and education accountability policies.
How Parents View School Choice Policies
Of the three types of private school choice programs (vouchers, tax-credit scholarships, and education savings accounts), ESAs garnered the most support among parents when provided with a definition. Three out of four (76 percent) parents say they favor ESAs. While this level of support is not statistically different than support from the general population, parents were more likely to “strongly favor” ESAs (37 percent) than non-parents, public school teachers and the general population of American adults.
Parents expressed two predominant reasons for favoring ESAs. Of those favoring ESAs, one in three (30 percent) parents listed “access to a better academic environment” as the primary reason. A similar proportion (28 percent) said they supported ESAs because they provide more freedom and flexibility.
When initially asked about vouchers without a description, parents did not express a majority opinion about them. A little less than half (47 percent) said they favored vouchers. When provided with a definition of vouchers, however, parental support jumped to 69 percent.
Two-thirds (67 percent) of parents favor tax-credit scholarships. One in four (24 percent) oppose tax-credit scholarships, and a little less than one in 10 (8 percent) were unsure of their opinions on them.
A slightly lower proportion of parents (62 percent) expressed favorability of tax-credit scholarship in the 2018 Education Next Poll. That poll also asked parents about their support for vouchers, but in a variety of ways. Six in 10 (61 percent) support a system akin to a universal voucher program when asked a question without using the “voucher” label. When using the term “voucher,” parental support dropped to 55 percent for a universal program. Support dropped further for vouchers intended only for low-income families; 45 percent of parents favor them when asked specifically about low-income vouchers.
How Parents View Accountability in Education
Over the past two decades in education accountability, many states have adopted A–F and similar systems that grade each school largely by how they perform on standardized tests and impose consequences for those that qualify as failing. Such systems can have huge consequences for school funding and local control, among other issues. But three in 10 parents (29 percent) were unsure whether their states used an A–F accountability system. These were parent-provided responses not checked against whether respondents’ states actually had such a system, so the ratio may in fact be larger.
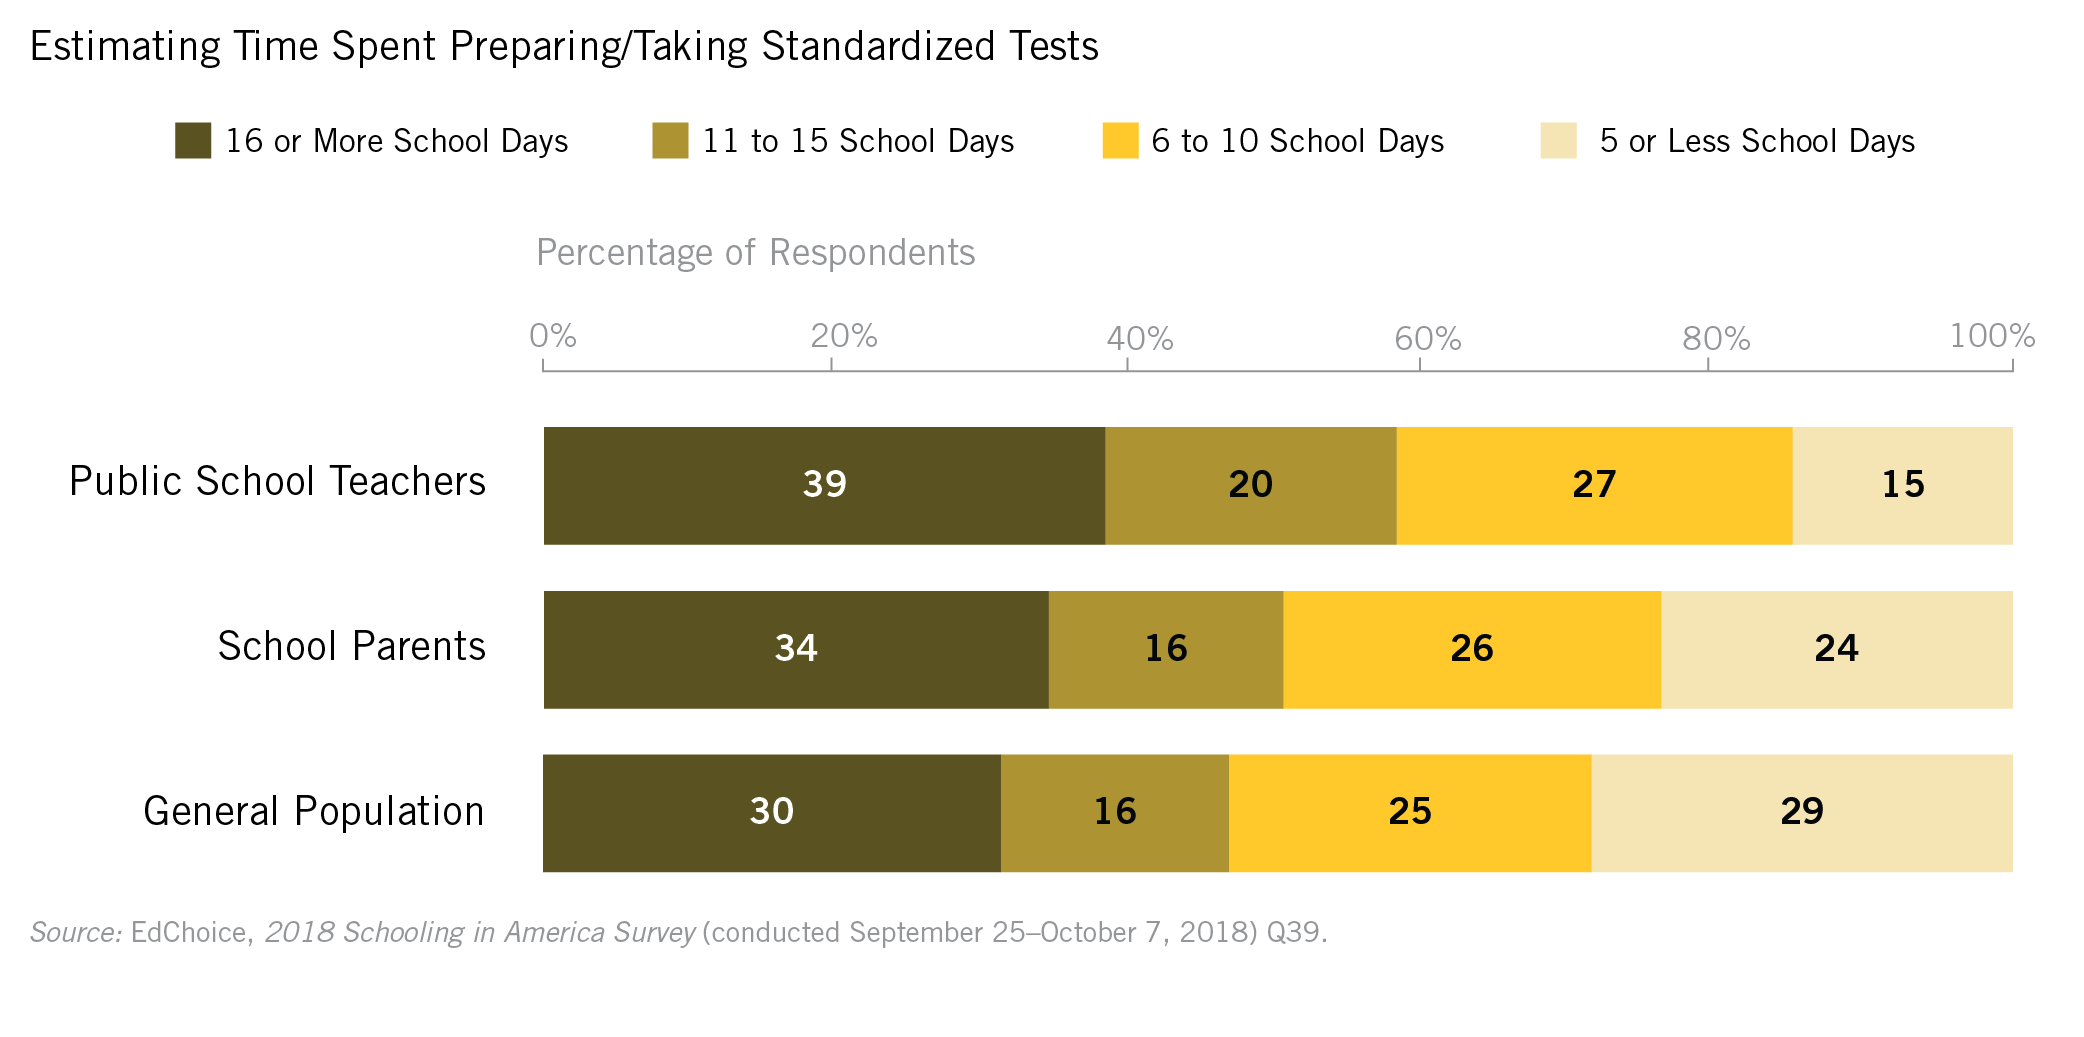
Speaking of testing, one in three parents (34 percent) estimate the typical student spends 16 or more school days preparing for and taking mandatory standardized tests in the classroom. That was a higher ratio than the general public (30 percent) but lower than public school teachers (39 percent).
A similar ratio of parents (36 percent) believe too much time is spent on standardized testing. This was significantly lower than the proportion of teachers (52 percent), but similar to that of the general population (36).
Regarding the purpose of accountability, 38 percent of parents identified school safety as one of the top two things a state accountability system should evaluate. A third (34 percent) of parents in the 2018 PDK Poll said they feared for their child’s safety at school, which was a 22-point increase since 2013
Parents expressed their favorability toward various school choice options in our poll. But what about those living in communities that traditionally have had few to no schooling options? Next time on the Schooling in America Series, we’ll revisit results of small town and rural residents to see how their preferences and education priorities have changed since 2016.
Other Posts in the Schooling in America Series
Schooling in America Series: Getting to Know Our Teachers
Schooling in America Series: Getting to Know School Parents
Schooling in America Series: Getting to Know the Public on Public Education
Schooling in America Series: K-12 Education Funding
Schooling in America Series: The Public on School Choice
Schooling in America Series: The Public on K–12 Accountability
Schooling in America Series: Teachers’ Views on Accountability and School Choice