Top Seven Findings from Our Minnesota School Choice, K–12 Education Survey
Minnesota voters like public schools and private school choice policies.
Minnesota has a long history of bucking conventional thinking about K–12 education. Most important, the state is known for implementing policies that enhance the flexibility of families to send their children to the schools that fit them best, whether public or private.
In 1955, Minnesota became the first in the United States to include tax deductions for a family’s expenses related to private school tuition and fees. Twenty-four years ago, Minnesota became the first state to enact a public charter school law. In addition, the state began providing tax credits for non-tuition educational expenses for both public and private school families in 1998.
Time has shown many school parents want those programs. More than 220,000 taxpayers claimed a school choice deduction in 2012; more than 43,000 Minnesota students attended 149 charter schools statewide in 2013–14; and it is estimated more than 50,000 taxpayers utilize the public and private educational tax credit in a given year.
The Minnesota legislature is considering further expanding school choice options for families this session with new programs, such as tax-credit scholarships and education savings accounts (ESAs). Legislation has also been proposed that would broaden family eligibility, make tuition expenses allowable, and increase funding amounts for the state’s existing education tax credit.
But what do Minnesota voters have to say about the proposals for new school choice policies? What do they say about their public schools?
To answer those questions, the Friedman Foundation for Educational Choice and Braun Research released the Minnesota K–12 & School Choice Survey today.
Here are six key snapshots:
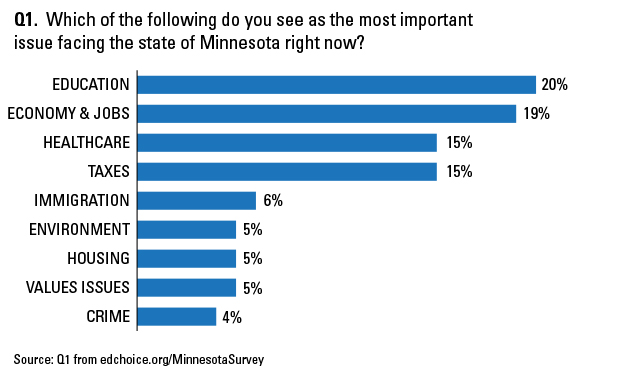
1. One out of five Minnesota voters (20 percent) said “education” should be the state’s highest priority. That response slightly edged out “economy and jobs” (19 percent).
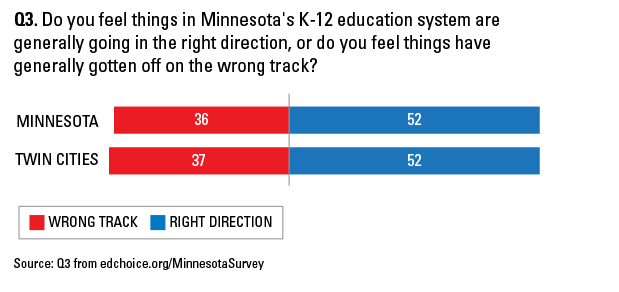
2. More than half of Minnesota voters were optimistic about the direction of K–12 education in their state. They are much more likely to think K–12 education is heading in the “right direction” (52 percent), compared with being on the “wrong track” (36 percent).
That is the second largest “right direction” response we have recorded among the 25 states we have surveyed since 2010.
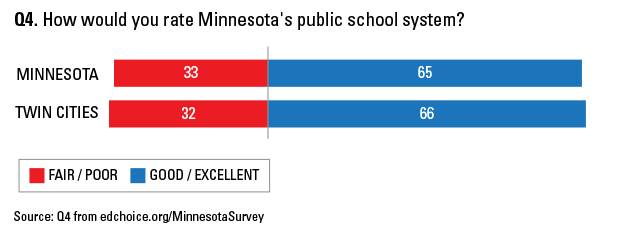
3. A very large proportion of voters have a clearly positive view of the state’s public school system. Nearly two out of three gave positive ratings to the state’s public school system (65 percent said “good” or “excellent;” 33 percent said “fair” or “poor”).
That percentage is tied with Iowa for the second largest positive rating we have observed in our state surveys.
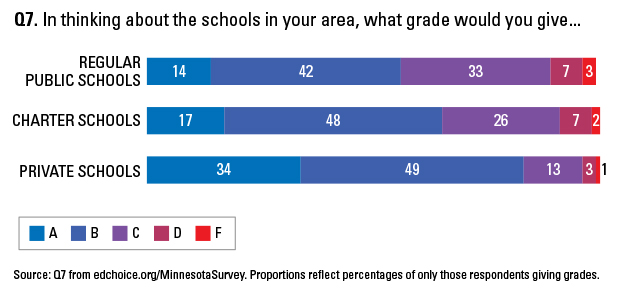
4. Even with their positive sentiment and ratings of public schools, Minnesota voters are still more likely to give A or B grades to private and parochial schools in their communities than they are their local public schools.
When examining only those responses giving grades to different school types in their communities, we saw approximately 56 percent of voters give an A or B to local public schools, whereas 83 percent give an A or B to local private/parochial schools. Only 4 percent of voters give a D or F grade to private schools, and 10 percent assigned similar low grades to area public schools.
It should be noted that much higher proportions of voters did not express a view for private schools (23 percent) or charter schools (36 percent), compared with the proportion that did not grade public schools (4 percent).
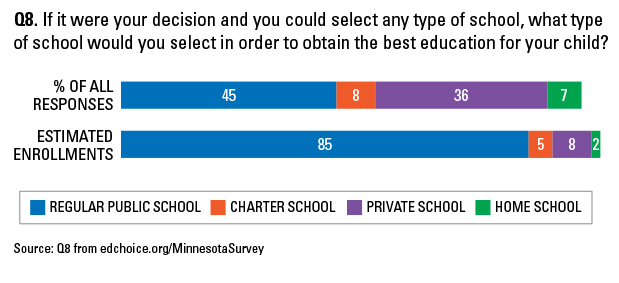
5. In Minnesota, as in other states, substantial gaps exist between personal school preferences and actual school enrollments.
When asked for a preferred school type, a plurality of voters said they would choose a regular public school (45 percent) as a first option. In reality, about 85 percent of K-12 students attend public schools in Minnesota. More than one out of three voters (36 percent) said they would want to send their child to a private school, yet only 8 percent of students are enrolled in private schools. Almost one out of 10 would opt for a charter school (8 percent), but only about 5 percent of students currently go to public charter schools. Approximately 7 percent of respondents said they would like to homeschool their child. It is estimated that fewer than 2 percent of the state’s students are homeschooled.
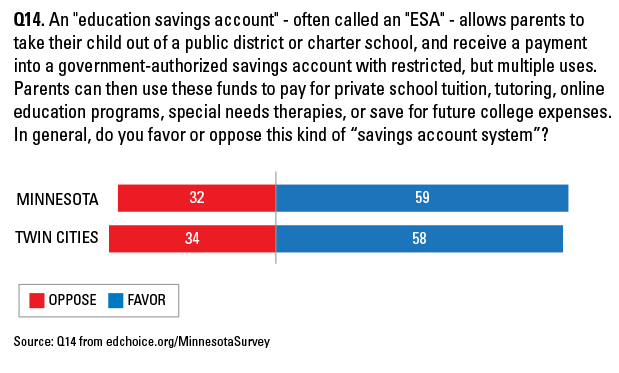
6. During the current 2015 legislative session, the Minnesota state legislature is considering proposals for ESAs and tax-credit scholarships. In our survey, voters signaled broad support for both of those types of school choice policies.
Nearly six out of 10 Minnesotans (59 percent) said they support ESAs. Voters are significantly more likely to favor ESAs than oppose them – the margin of support is large (+27 points) and just one-third (32 percent) said they oppose ESAs.
There are some notable differences within demographic categories:
- School parents (65 percent) are more likely to favor ESAs compared with non-schoolers (56 percent)
- Republicans (65 percent) are more favorable than Democrats (54 percent).
- Older voters (51 percent) are significantly less supportive than young voters (63 percent) or middle-age voters (65 percent).
- Low-income earners (66 percent) are more likely to support ESAs than high-income earners (53 percent).
There is overwhelming support to establish ESAs for students with physical disabilities or who have been diagnosed with other special needs.
- Four out of five voters (80 percent) support this general proposal that state policymakers are considering in 2015. Only 15 percent of voters oppose this ESA plan.
- Minnesotans were six times more likely to say they “strongly favor” ESAs for student with special needs (42 percent) compared with those who said they “strongly oppose” (7 percent) the idea.
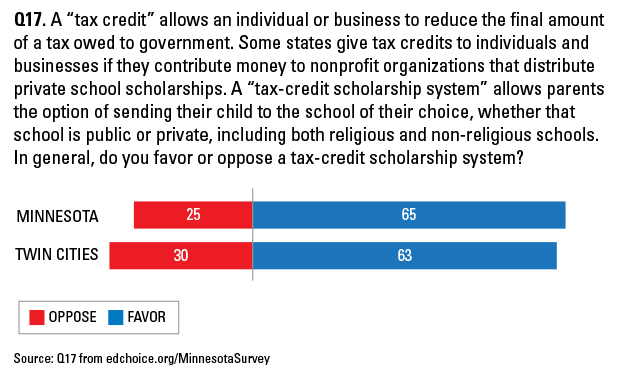
Almost two out of three voters support the concept of tax-credit scholarships. The percentage of those who favor (65 percent) is much larger than the proportion of voters who say they oppose such a school choice reform (25 percent). The favor-oppose margin is +40 percentage points. Voters are also more than twice as likely to express intensely positive responses toward tax-credit scholarships (26 percent “strongly favor” vs. 10 percent “strongly oppose”).
We saw some significant contrasts within demographic categories:
- Republicans (76 percent) are much more supportive than either Democrats (62 percent) or Independents (60 percent).
- Older voters (56 percent) are relatively less likely to support such a policy compared with young voters (76 percent) and middle-age voters (69 percent).
- High-income earners (58 percent) are relatively less likely to support tax-credit scholarships compared with low-income earners (74 percent) and middle-income earners (68 percent).
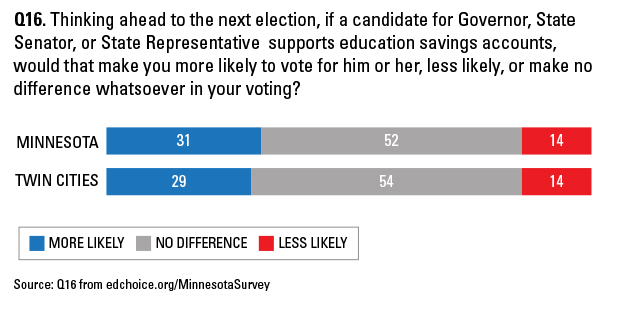
7. The “politics” of school choice appears to be more bark than bite for public officials. Results from our poll suggest there is opportunity to pursue a non-partisan path.
If a voter has a particular view on ESAs, he or she is twice as likely to vote for the pro-ESA candidate (31 percent “more likely” vs. 14 percent “less likely”). About one-half of voters (56 percent) signaled that ESAs are not a make or break issue or did not express an opinion on this item.
There is a consistent likelihood to support a pro-ESA candidate regardless of political party preference:
Democrat: 35 percent more likely to support; margin = +18 points
Republican: 31 percent more likely to support; margin = +19 points
Independent: 29 percent more likely to support; margin = +11 points
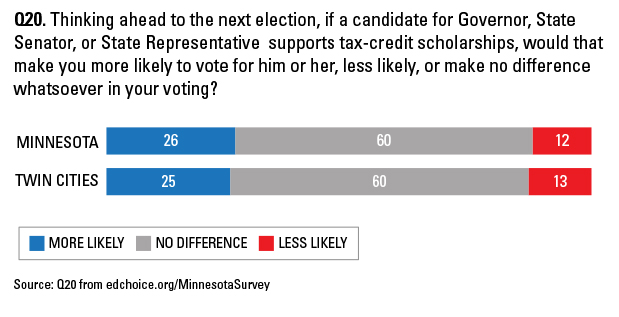
If a voter has a particular view on tax-credit scholarships, he or she is more than twice as likely to vote for the pro-school choice candidate (26 percent “more likely” vs. 12 percent “less likely”). Six out of 10 voters (60 percent) signaled that tax-credit scholarship program would not be a make or break issue or did not express an opinion on this item.
Like ESAs, there is a consistent likelihood voters will support a pro-tax-credit scholarship candidate regardless of political party identification:
Democrat: 28 percent more likely to support; margin = +14 points
Republican: 29 percent more likely to support; margin = +18 points
Independent: 21 percent more likely to support; margin = +8 points