2021 EdChoice Share: Where Are America’s Students Getting Their Education?
END OF Q1 UPDATE: We will update this post quarterly to reflect updates to private school participation as well as enrollment changes in states’ public, charter, home school, and non-choice program private schools.
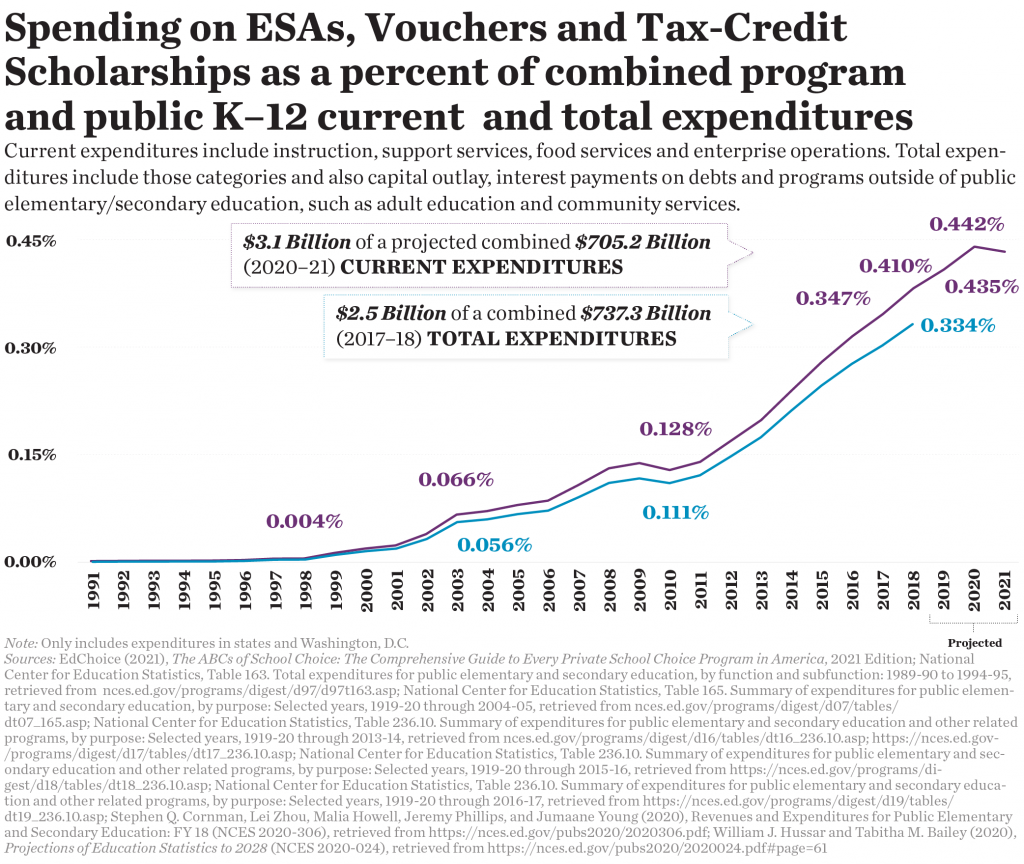
This series coins the term Educational Choice Share (or EdChoice Share) to represent the proportion of all K–12 students who are enrolled in an education savings account, school voucher or tax-credit scholarship program.
To get this number, EdChoice divides the total number of a state’s educational choice program participants by the total number of K–12 students in the state, regardless of schooling sector. Not all program data are reported for the most recent school year, so carry-forward participation data are used for programs that don’t yet have 2020–21 data.
This post also provides a state-by-state breakdown of public district school share, charter school share, home school share and “out of pocket” private school share—which we describe as “by other means” or “Other Private School Share.”
Additionally, evidence suggests that homeschooling figures have surged during the past two school years. These figures are not yet able to be incorporated into our state-based calculations, but we suspect once they are both homeschooling and overall non-district enrollment percentages will rise.
The charter school enrollment data are for 2017–18 and the public district school enrollment data (total public minus charter) reflect the 2018–19 school year. The private school enrollment data* and homeschooler estimates are for 2017–18.
*New Mexico private school enrollment data did not meet the USDOE’s reporting standards in 2017–18 so we used the 2015–16 private school enrollment data instead for that state.
Why do we care about this?
Data from our 2020 national poll shows American parents—for myriad reasons—are not able to access the types of schools they would prefer for their children.
If our K–12 education system is innovating and finding ways to better serve students and their families, then—as years pass—we would expect the numbers below to begin looking more and more like the chart above.
Importantly, school closures stemming from the coronavirus pandemic caused swarms of new parents to explore educational alternatives for their children. While new private school choice data for the 2020–21 school year are still being reported as state agencies and scholarship organizations prepare for a new semester, we will be sure to monitor and report on how future enrollment changes affect the country’s and states’ EdChoice Share throughout this year.
On a national level:
- 1.0 percent of students are utilizing an educational choice program
- 7.5 percent attend private school by other means
- 83.4 percent attend a public district school
- 5.5 percent attend a charter school, and
- 2.6 percent are homeschooled.
On a state level:
[table id=84 /]
Notes: U.S. territories were not included in these calculations, nor were data on individual tax credit or deduction programs, unless it was a refundable credit (such as Alabama’s Parent Taxpayer Refundable Tax Credits), which is why Minnesota’s EdChoice Share is Not Available. EdChocie assumes 20 percent of tax-credit scholarships went to multi-scholarship students in Arizona, whereas other tax-credit scholarship programs are assumed to have a 1:1 student-to-scholarship ratio for the purposes of these rankings.
Latest from the Blog
-

Everything People Care About More Than Standardized Test Scores
We asked parents to identify up to three out of a possible six indicators they look at to know if their child’s school year has been successful: standardized test scores were a clear least favorite.
-
The 2026 EdChoice Bundle Pro: Friedman Index, Legal Landscape, Fiscal Factbook
New this year in the Bundle Pro, you will find our newest Bundle product, Friedman Index as well as a revamped Legal Landscape with more details about cases, and new sections in Fiscal Factbook on Arizona and the long-term effects of school choice.
-

Summer Reading: Reducing Chronic Absenteeism
As we start to think about next school year, taming chronic absenteeism needs to be a serious priority.