Inside the 2025 Schooling in America Survey
What parents and the public really think about K–12 education, funding, and school choice
What do Americans really think about K–12 education? Each year, EdChoice’s Schooling in America Survey provides one of the most comprehensive answers to that question. This week, we released the 2025 edition — our 13th annual, nationally representative look at parents’ and the public’s views on everything from school satisfaction and funding to educational choice policies and the role of government. Over the course of the survey’s 13-year history, we have asked a set of recurring questions focusing on the direction of K–12 education, parents’ schooling preferences, parents’ satisfaction with their child’s schooling experiences, and public feelings towards educational choice policies. Furthermore, we include a set of new questions each year to better understand parents’ opinions on more timely issues within K–12 education. Some of the new questions this year revolve around the role of the federal government in K–12 education, school funding, and more.
The Schooling in America survey was fielded from March 28th to April 7th, 2025. We obtained nationally representative samples of both the general population (N=1,514) and current school parents (N=2,455).
Note to readers: Every year when we release SIA, someone reaches out to ask how this survey is different from the monthly EdChoice Public Opinion Tracker. SIA is an annual survey (first launched in 2013) that employs a mixed-methodology including non-probability-based online panels and probability-based live phone calls. We take the longer view with SIA – reporting historical trends and year-over-year changes for key questions surrounding K–12 education. Our Tracker launched in January 2020 in partnership with Morning Consult. The Tracker differs from SIA in a few key areas. First, it is fielded monthly which allows us to ask questions that gauge how the public and parents feel about more timely issues around K–12 education. That frequency allows us to examine more granular changes in opinion – as we did during the COVID-19 pandemic – to see how experiences and opinions may shift in shorter time periods during the school year. Finally, within the overarching Public Opinion Tracker polling series we also survey a nationally representative sample of K–12 teachers twice a year.
With that, let’s dive into some of the key findings from the 2025 SIA survey:
Parents are more optimistic about the direction of K–12 education
When asked whether they feel K–12 education is headed in the right direction or on the wrong track, 41% of school parents feel education is headed in the right direction, up 5 points from 2024. Last year, nearly two-thirds (64%) of school parents felt as though K–12 education was on the wrong track, the highest level of pessimism we have observed in the history of this survey. Even with positive sentiment increasing this year, 59% of school parents feel that education is on the wrong track in America, the third highest level of pessimism we’ve recorded in the 13 years of SIA.

Interestingly, just over half of Republican school parents (53%) feel K–12 education in America is headed in the right direction. Last year, only 25% of Republican school parents felt optimistic. How can that change so drastically in just one year? There are probably many factors playing into this, but is worth noting, as my colleague John Kristof wrote a few years ago, that partisanship plays a role in people’s sentiments. As he wrote, “trends appear to morph the year following a presidential election.” This certainly appears to be the case again in 2025.
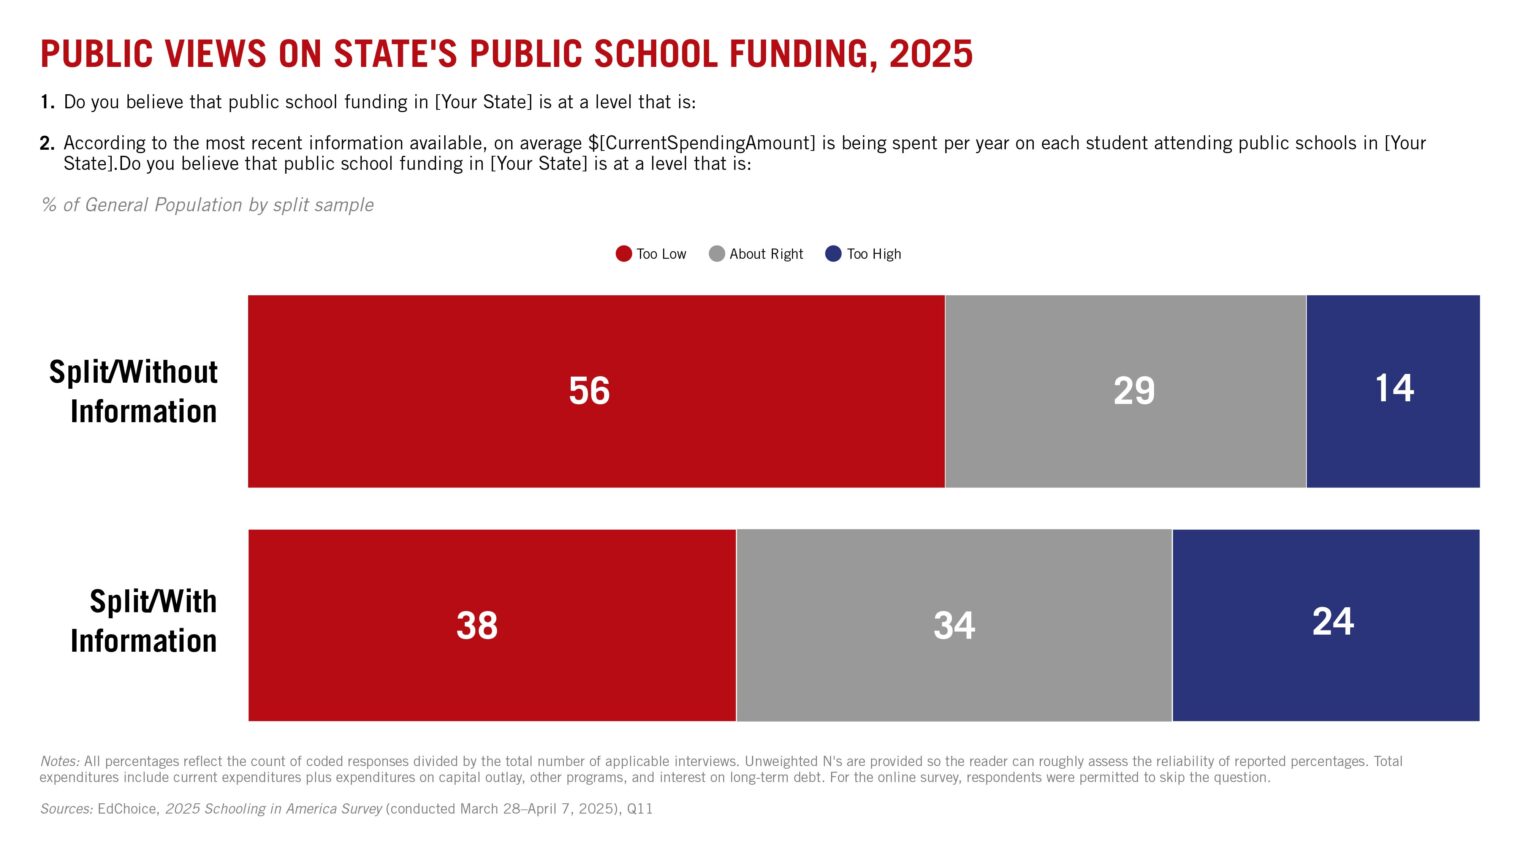
Americans continue to be less likely to say public school funding is “too low” when shown a publicly recorded statistic on the matter.
We posed a split-sample question to respondents about their opinions on the level of public school funding in their state. In a split-sample question, respondents are randomly shown one of two question options. In this case, half of respondents received a question asking if public school funding was too high, too low, or about right. The other half were asked the same question but were given the spending figures for the state where they live.
Without any data included, 56% of Americans felt that public school funding in their state is “too low”, a 7-point decrease from last year. With a publicly recorded statistic included, however, only 38% of Americans felt their state’s per-pupil funding in public schools was “too low.” The effect of information proved to be significant, as it has in the past.

For reference, without any information provided, only 14% of Americans felt that their state’s funding for public schools was “too high.” That proportion jumped to 24% with information provided. Furthermore, 29% of Americans felt their state’s public school funding was “about right” without being given a publicly recorded statistic. When shown a statistic, 34% of Americans felt their state’s public school funding was “about right.”
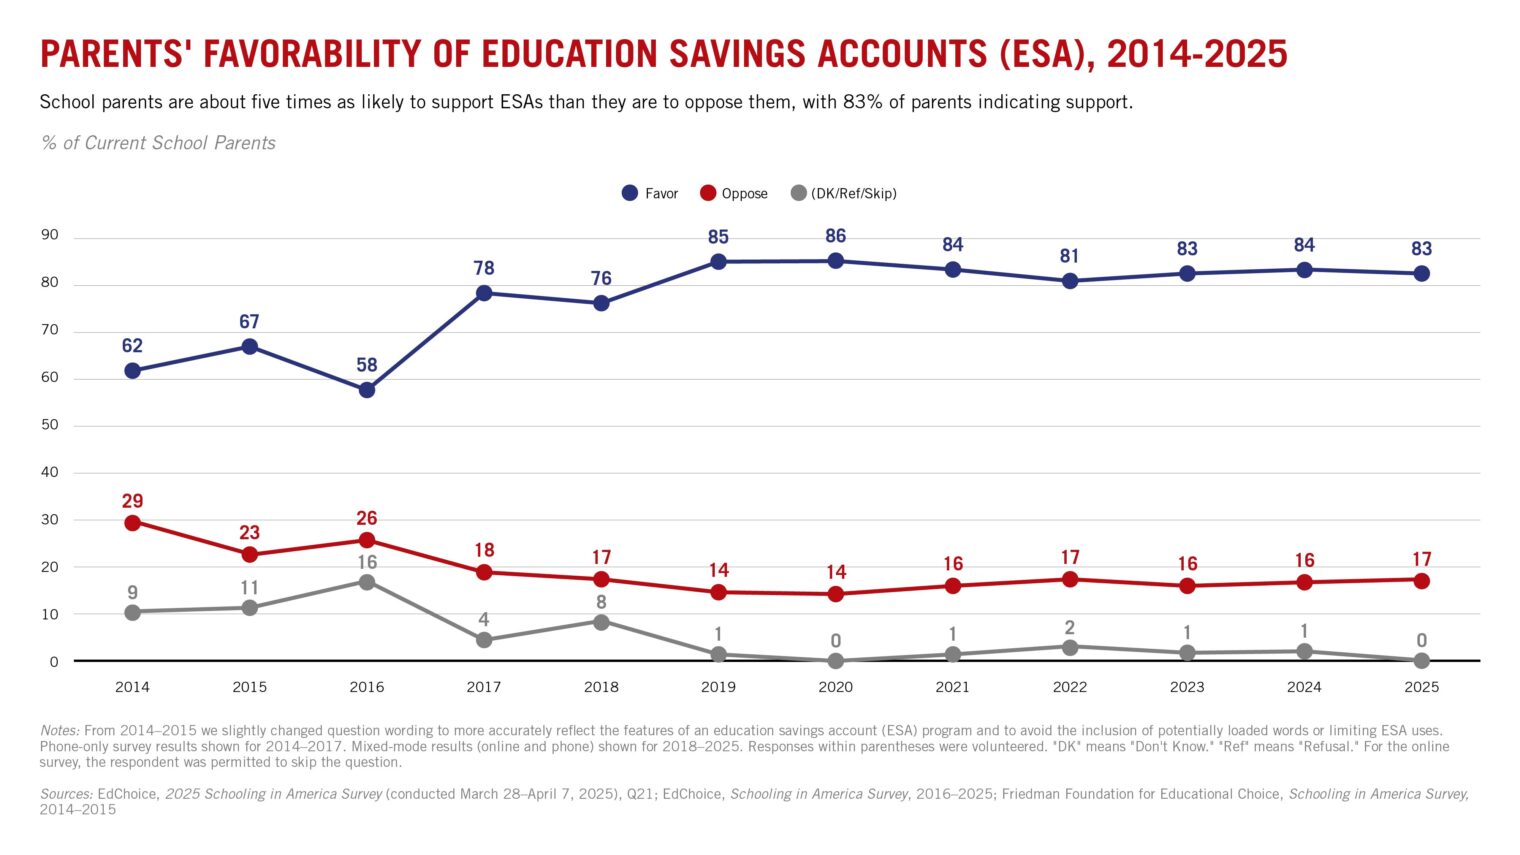
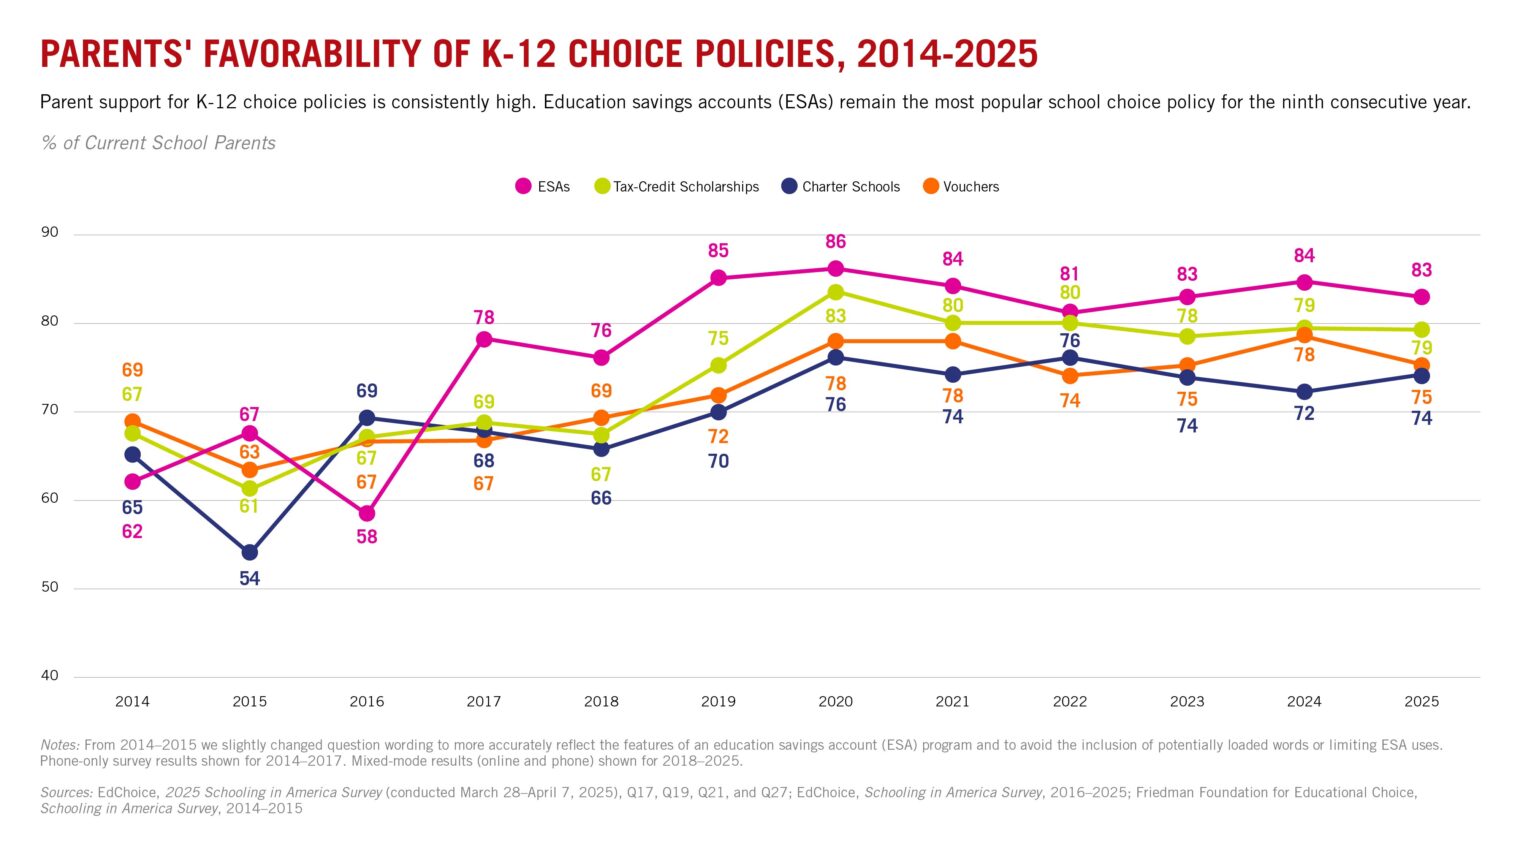
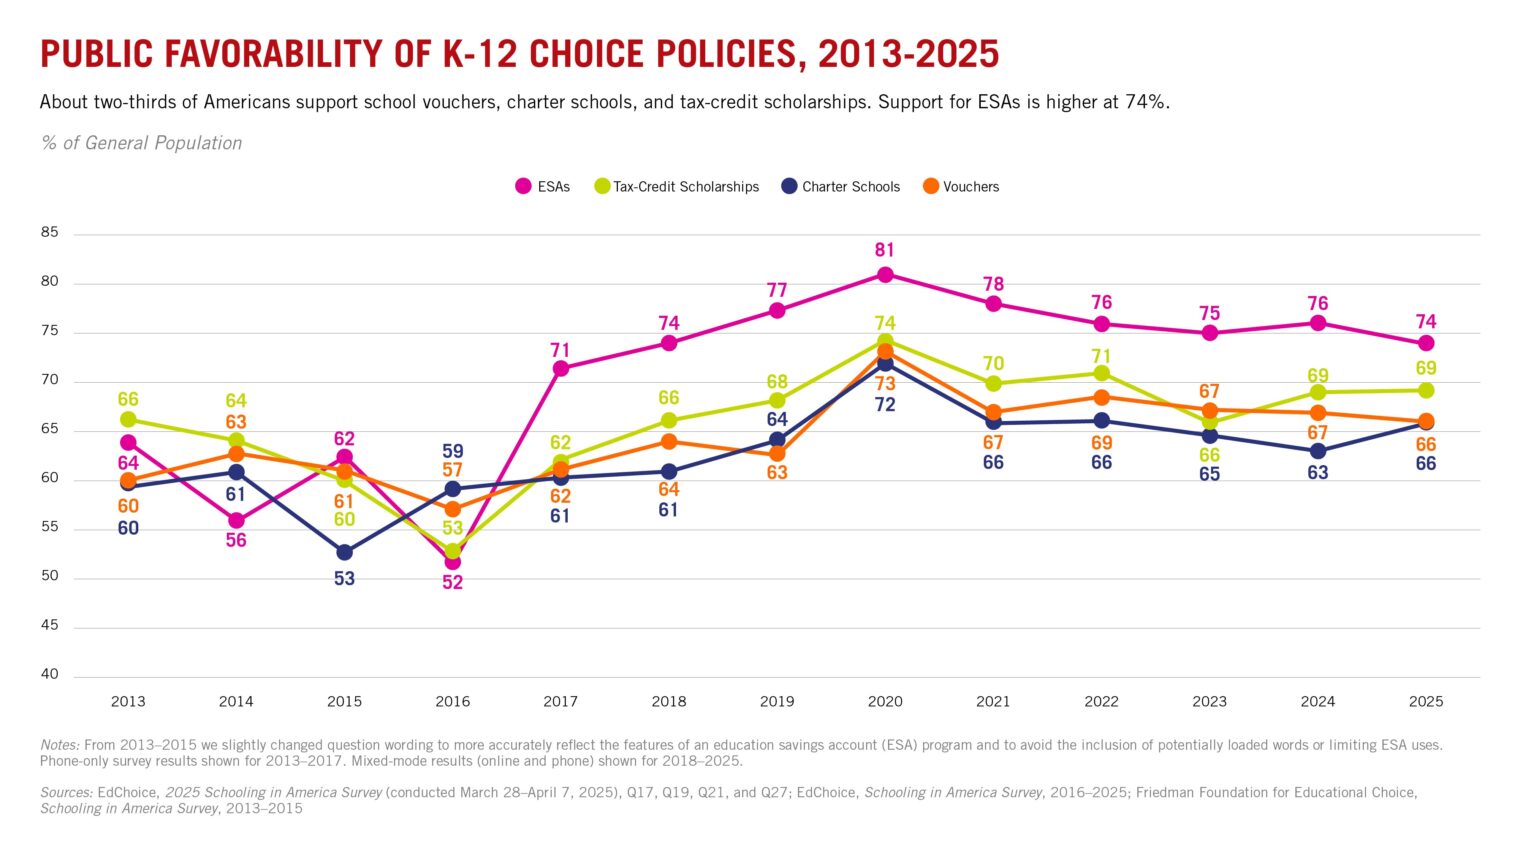
ESAs continue to be the most popular school choice policy among both the general population and school parents.
Education savings accounts (ESAs) consistently enjoy strong levels of support from both Americans and school parents, and this year is no exception. Nearly three-in-four Americans (74%) support ESAs, while 83% of school parents support the policy. While other forms of school choice like charter schools, school vouchers, and tax credit scholarships also enjoy high levels of support from Americans (between 60%-70%) and school parents (between 70%-80%), ESAs continue to be the most popular school choice policy, having topped the list for the 9th consecutive year.
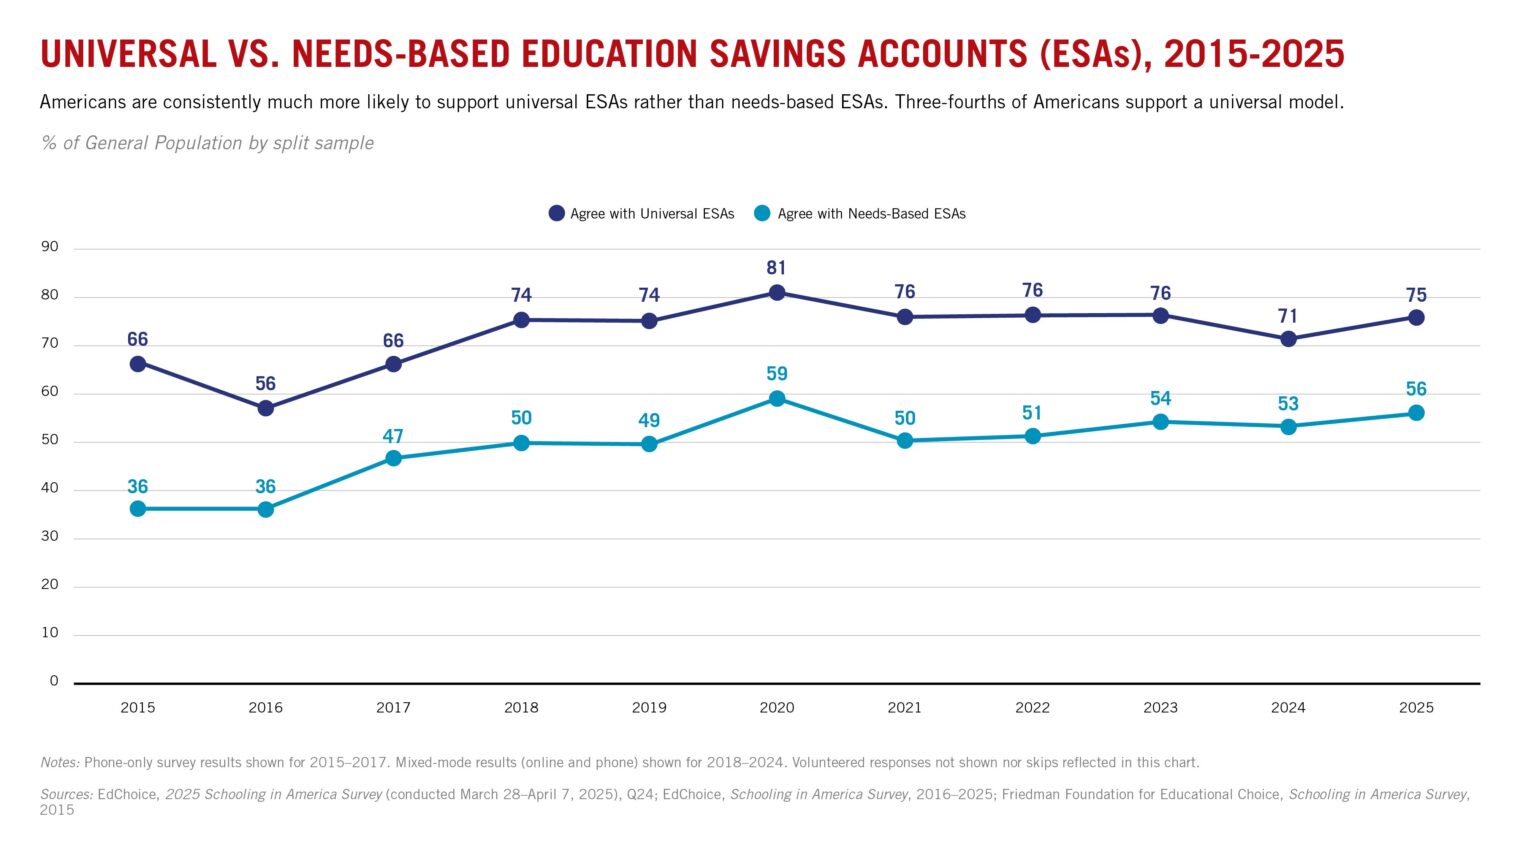
Diving deeper into the topic of ESAs, Americans are consistently more likely to support universal ESAs (ESAs made available to all students, not just based on financial need), with three-in-four Americans supporting a universal model. On the other hand, just over half of Americans (56%) support needs-based ESAs (ESAs only available to students with special needs or lower income households). Indeed, Americans’ preference for universal ESAs has not wavered once over the course of SIA’s 13-year history. The gap between support levels for each type of ESA policy has not been particularly small, either. The smallest gap in support was 18 points just last year (71% for universal ESAs, compared to 53% for needs-based ESAs).
Housekeeping Items
The findings above are just a glimpse into the 2025 Schooling in America survey. In the coming weeks we will release several additional blog posts dedicated to specific topics found within the survey, as well as demographic data from the crosstabs. You can also find more content focusing on SIA in our Substack, Informed Choice.
Latest from the Blog
-

Declining Enrollment Doesn’t Have to Mean Declining Schools
Declining enrollment presents real challenges. It also gives district leaders a chance to build stronger schools for the students they serve.
-

Everything People Care About More Than Standardized Test Scores
We asked parents to identify up to three out of a possible six indicators they look at to know if their child’s school year has been successful: standardized test scores were a clear least favorite.
-
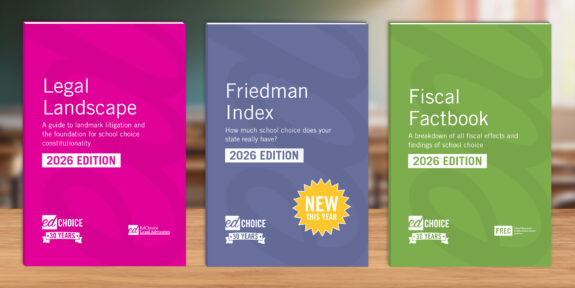
The 2026 EdChoice Bundle Pro: Friedman Index, Legal Landscape, Fiscal Factbook
New this year in the Bundle Pro, you will find our newest Bundle product, Friedman Index as well as a revamped Legal Landscape with more details about cases, and new sections in Fiscal Factbook on Arizona and the long-term effects of school choice.