
School Choice Surge: Private School Program Use Up 25% Nationwide
Most American students are back to school and more than ever are taking advantage of school choice. In just one year, the total number of students participating in private school choice programs across the nation skyrocketed, increasing by 25%.
Last summer, the number of students participating in school choice surpassed the one million mark for the first time, with an estimated 1,038,500 using a program. As of July 2025, that number has climbed to approximately 1,300,905.*
The numbers speak for themselves; families want choice, and a 25% increase in one year shows that more families are starting to take advantage of programs offered in their area. Importantly, it’s a positive step in closing the gap between parent preferences and student enrollment.
In EdChoice’s annual Schooling in America Survey, 50% of parents say they’d choose a private or homeschool if given the chance, but in reality, 80% of students attend a traditional public school. In states that have recently enacted school choice programs with wide and universal eligibility, the increased participation is striking, suggesting that when given the option to customize their child’s education, families will jump at the opportunity.
Arkansas
- Enrollment increased from 5,132 (2023-2024)to 14,628 (2024-2025) in the state’s tax-credit scholarship and ESA programs.
- ESA enacted in 2023, launched in fall 2023 with student eligibility increasing annually. In the coming school year, any student may participate.
Iowa
- Enrollment increased from 26,996 (2023-2024) to 38,101 (2024-2025) in the state’s tax-credit scholarship and ESA programs.
- ESA enacted in 2023, launched in fall 2023, with student eligibility increasing annually. In the coming school year, any student may participate.
West Virginia
- Enrollment increased from 5,400 (2023-2024) to 11,000 (2024-2025) in the state’s ESA program.
- ESA enacted in 2021, launched in fall 2022, with student eligibility increasing annually. By the 2026-2027 school year, any student will be eligible to participate.
Florida
- Enrollment increased from 345,223 (2023–24) to 449,467 (2024–25) in the state’s tax-credit ESA and ESA programs.
- In 2023, Florida policymakers expanded eligibility in one of the state’s ESA programs to include all students, after a multi-year phase-in. In the same year, the state also expanded eligibility in its tax-credit ESA program to include all students upon phase in.
Indiana
- Enrollment increased from 82,040 (2023-2024)to 87,536 (2024–25) in the state’s tax-credit scholarship, voucher, and ESA program.
- In 2023, Indiana policymakers expanded eligibility in its voucher program to include nearly all students. In 2025, policymakers lifted the enrollment cap entirely, meaning any child in the state is eligible to participate.
With the continued momentum to expand educational freedom in statehouses, the number of students using private school choice is only expected to rise. This year, Texas and Idaho created new, sweeping choice programs, while several others, like Indiana, lifted participation caps.
Two prominent programs, ESAs in Alabama and Louisiana, are launching with the start of this school year, both to high demand. In Alabama, more than 36,000 students applied for the program that has enough funding to cover 23,000 scholarships. In Louisiana, 6,000 students received scholarships, but nearly 40,000 applied to receive them. Other states, like Utah and North Carolina, have also experienced high need and corresponding waitlists for their programs, with North Carolina responding by providing more funding so the 55,000 students on its waitlist could receive funding.
Given the potential size of the Texas program, and demand for others that are teeing up to launch, the number of school choice participants is likely to continue to spike in the coming years.
Large waitlists for school choice programs and fulfilled enrollment caps highlight the desire of families to escape the one-size-fits-all public school system. This is why supporting these programs is vital to families across the nation, as the larger these waitlists grow and enrollment caps are hit, the number of students being denied access to the education that fits them increases.
These numbers remind us that there is a demand for school choice programs and that making these programs more accessible nationwide should be a key focus for parents and policymakers. With school choice participation at its highest level in history, with a 25% increase in a single year, growing program waitlists, and hitting enrollment caps, it’s clear that demand for school choice programs is high. Now, it’s just a matter of ensuring that each student and family in America has reliable access to these programs.
*Most data are from the 2024-2025 school year, though some is from 2023-2024. Participation in tax-credit scholarship programs tends to lag a year or two behind, while participation in larger voucher and ESA programs tends to be more up-to-date. Data is from a variety of sources, depending on state. Some states publish annual reports with participation data via the DOE, some is disseminated through a partner organization, and some obtained via FIOA requests.
Editor’s note: This blog was updated after publishing to include the types of programs counted in state-level participation data. The participation counts for some states were updated.
Latest from the Blog
-

Highlights from the Newly Released 2026 Schooling in America Survey
With Schooling in America, we can uncover long term trends on how parents and the public think K–12 education is going nationally, what type of schools parents prefer, their satisfaction with their child’s schooling experience, and the public’s feelings towards school choice policies.
-

Highlights from the LEGO State of the Classroom Engagement Report
LEGO Education has been around for over 45 years, working alongside schools, school districts, and educators to help students learn about a variety of subjects including robotics, science, computer science, and AI, just to name a few.
-
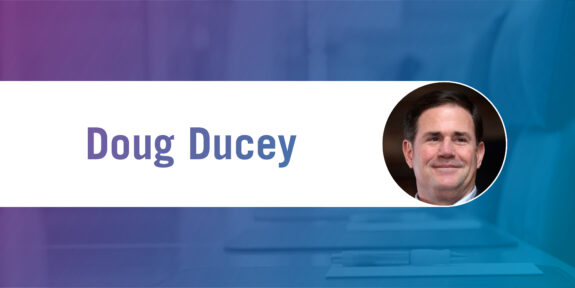
Former Arizona Gov. Doug Ducey Joins EdChoice Board of Directors
Former Arizona Gov. Doug Ducey is joining the organization's Board of Directors, bringing one of the nation's most accomplished school choice leaders to help guide its next chapter.