
We’re Talking About Enrollment Declines All Wrong
Growing populations grow choice programs, too
Hardly a week goes by without some sort of article describing population trends in the United States. Mathematically, in order for the population to remain steady (without considering immigration), there needs to be 2.1 children born per woman. Right now, our rate is about 1.6 births per woman, an all-time low.
In the K-12 policy space, we already are seeing enrollment declines due to a smaller population of school-age children. This has major implications for education decisionmakers who have to figure out what the new “right size” of public education infrastructure might be.
I’m not here to rehash all that has already been said about public education and the K-12 population. Instead, I want to view trends at the state and local levels and speculate on their connections to trends in school choice.
The short version is this: states leaning more into school choice also are likelier to be states struggling the least with declining public school enrollment. Shared associations with birth rates might have something to do with this connection.
As a recent Bellwether report cleanly illustrates, there is a strong relationship between a state’s birth rate and its projected public school enrollment over the next decade. Lots of other factors can contribute to the demographics here, including immigration and interstate migration, but simply looking at the number of babies being born explains a lot.
That doesn’t stop headline writers from pointing at school choice programs first. In one notable example in the Washington Post last year, a story looked at a struggling Arizona district and drew a lot of arrows at Arizona’s ESA program. What that story didn’t say—and what Marty Lueken and I had to point out in a letter to the editor—is that district had lost 27% of its student body before Arizona made its ESA universal. What’s more, at the time the Post piece was published, only 129 students had left that district’s schools with an ESA. To put that in context, the district enrolled about 7,300 students in 2022, so we’re talking about less than 2% of enrollment in the district. And yet, the choice program was the primary scapegoat.
But a recent conversation with my colleague Alex Wolf had me question whether we’re getting this backwards. We know birth rates say a lot about public school enrollment—what if they also explain something about school choice adoption?
I assembled some state-level stats from the National Center for Education Statistics and some datapoints from our website, and I ran some basic correlation tests. Chalk all this up to the “just to see if there might be something there” category of exploratory analysis.
The numbers
If your state had a universal-eligibility ESA or voucher program on the books by 2026, it is likely to be facing much more tempered enrollment declines over the next decade (r = 0.50, p < 0.001).
Likewise, those choice states have consistently higher birth rates than non-choice states (r = 0.34, p = 0.015). Averaging the two groups, choice states have about 0.8 more births per 1,000 women (11.16 vs 10.36).
Correlations: births per 1,000, projected enrollment change (through 2031), and universal-eligibility ESAs and vouchers
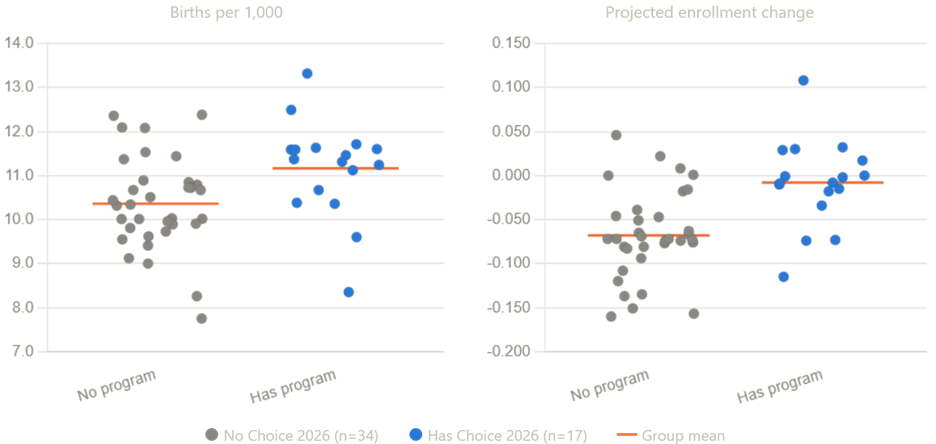
Taken together, these findings aren’t too surprising. States with higher birth rates are the states NCES projects to face the least public school enrollment decline in the near future (r = 0.45, p < 0.001). States with higher birth rates also have less historical decline in public school enrollment from 2014-2024. Individual states’ birth rates did not really shift much relative to each other during that period. So, if choice states are states with higher birth rates, it makes sense that they would have tempered historical and projected public school enrollment changes.
While sample sizes obviously are very small (there are only so many states), this trend holds true if you take the size of choice programs into account.
If you look at our EdChoice Share numbers, which lists the percentage of children participating in private school choice programs (non-universal and tax credit scholarship programs are included here, so it’s not a one-for-one match with the last “Has Choice” grouping), there also is a positive correlation between choice program participation and projected public school enrollment (r = 0.30, p = 0.36). For every 1 percentage point increase in EdChoice share, projected enrollment increases by about 0.49 percentage points.
Correlation: EdChoice Share (2026) and projected public school enrollment change (through 2031)
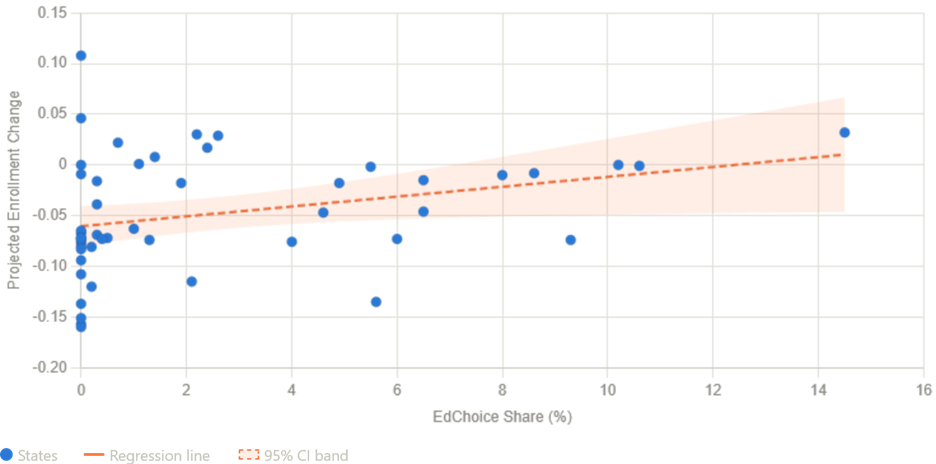
States like Florida and Arizona are carrying those numbers somewhat, but there are signs, at least, that choice programs are not breaking the link between birth rates and public school enrollment.
I think it’s worth speculating why choice programs are linked with higher birth rates and, by extension milder expected public school enrollment declines.
Our long-running survey work, such as the 2026 edition of the Schooling in America survey, consistently finds that parents are more supportive of school choice policies than the general public. If a state has a greater share of voters who are current school parents than another state, it may have more political pressure to adopt school choice policies.
A more speculative thought I have is whether migration choices are at play at all. Universal choice states tend to have higher net migration rates than other states (the top six states according to the most recent data have universal-eligibility programs). Notably, young people don’t necessarily choose these states, but they are especially driven by adults likelier to have children.
Rationalist politics might have something to say here as well. States losing their child populations more rapidly might be in a more defensive stance with respect to their public schools. As our editor Mike McShane put it, when the pie is growing, fighting over the size of slices is less vicious.
That’s a bit more of a speculative connection, but this limited data does run counter to popular narratives about school choice and public schools. The dramatic alarm bells some opponents rang about the impending death of public education look rather silly given these numbers. We have examples of states creating systems that are pro-family enough that allow both private school choice programs and the traditional public school system to thrive—or at least survive better than their counterparts.
Note: The graphs were made via Claude but verified by me. Any mistakes are my own.
This was originally published to our Substack.
Latest from the Blog
-

New Survey: Back to School and Election Season
As a new school year begins and midterm elections approach, new EdChoice polling reveals what Americans and school parents think about the biggest issues facing K–12 education—and what they’re prioritizing in the year ahead.
-
Does School Choice Cause Public Schools to Close?
Does school choice cause public schools to close? New research examining nearly three decades of data finds little evidence that it does—even in rural communities. Instead, closures are more closely tied to broader enrollment and demographic trends.
-
State Audit Finds Incredibly Few Errors in Arkansas’ ESA
When reviewing the $93.8 million Arkansas ESA program for the 2024-25 school year, the state auditor identified $60,417 in anomalous payments. To save you a trip to your calculator app, that’s a finding of 0.06% of total spending that was problematic.