Executive Summary
This report summarizes the fiscal effects of educational choice programs across the United States from an analysis of 40 private educational choice programs in 19 states plus D.C. The programs in the analysis include three education savings accounts programs, 19 school voucher programs, and 18 tax-credit scholarship programs.
This study estimates the combined net fiscal effects of each educational choice program on state and local taxpayers through FY 2018—in both the short run and the long run. It uses short-run and long-run variable cost estimates to generate lower bounds and upper bounds of the fiscal effects of educational choice program on taxpayers through FY 2018. The longer a program operates, the closer the savings approach the upper bound (long-run) estimates. The less time a program is in place, the closer its fiscal effects to the lower bound (short-run) estimate. Of the 40 programs in the analysis, four programs in this study were in operation for less than five years while the remaining 36 programs were in operation for at least five years through FY 2018. Thus, for these 36 programs open for five years or more, the fiscal effects of these programs will likely be at or very close to the high-end estimates.
The report also provides context by presenting basic facts about the size and scope of each program, in terms of participation and funding, relative to each state’s public school system. It presents the facts on taxpayer funding disparities between students using the choice programs and their peers in public schools.
Most revenue for K–12 public schools come from state and local sources, and K–12 expenditures comprise a significant share (35.5 percent) of the general fund for all state governments and are a substantial expense for local taxpayers as well.i Given the significant state and local taxpayer funding devoted to children’s education, both citizens and policymakers need to know how school choice programs affect their states’ budgets and the budgets of local public school districts.
Key Findings
Fiscal Effects Estimates
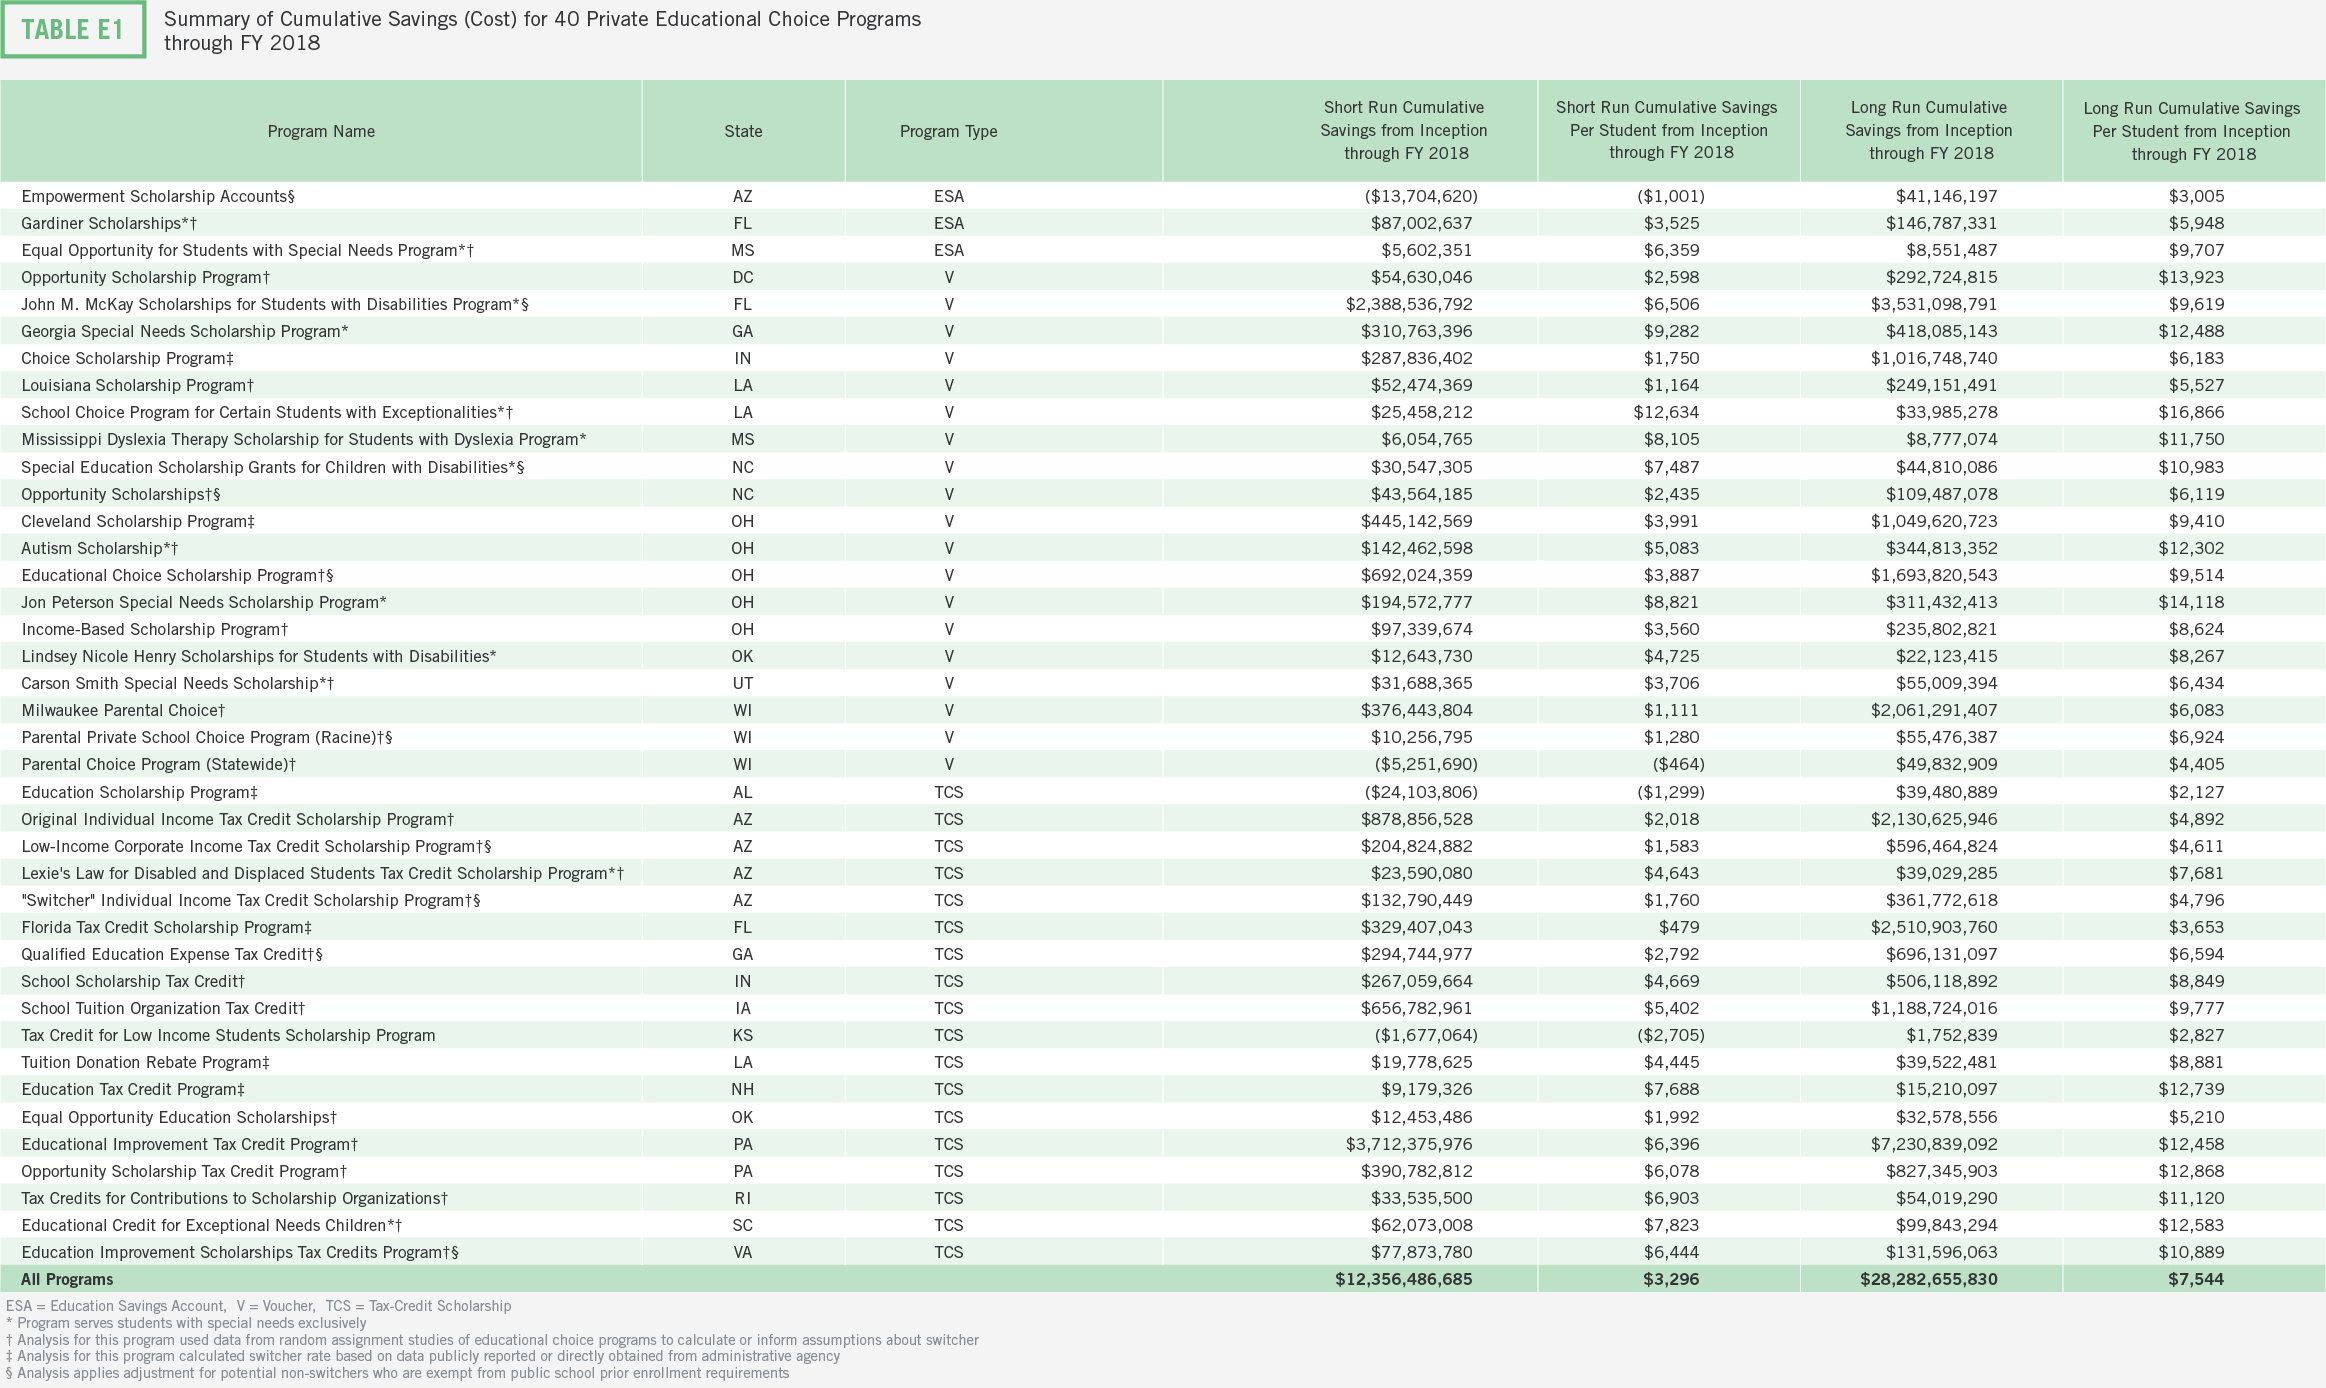
- Through FY 2018, the 40 educational choice programs under study generated an estimated $12.4 billion to $28.3 billion in cumulative net fiscal savings for state and local taxpayers. This range represents $3,300 to $7,500 per student participant. Given that 36 of the 40 programs included in the analysis were in operation for at least five years through FY 2018, the overall cumulative fiscal impact is likely closer to the upper bound estimate of $28.3 billion. (Table ES-1)
- Educational choice programs generated between $1.80 to $2.85 in estimated fiscal savings, on average, for each dollar spent on the programs. These savings result from many of the students who exercised choice who would have been enrolled in a public school if these choice programs did not exist—and enrolled in public schools at a much larger taxpayer cost.
- On average, if at least 50 percent of choice program students switched from public to private schools, these programs saved taxpayer dollars overall. For programs that have been in operation a long time, this break-even rate may be as low as 32 percent. These break-even switcher rates are significantly lower than switcher rates observed in random assignment studies (85 percent to 90 percent, on average) which implies significant savings from choice programs through FY 2018.
Cost Comparisons
Significant public funding disparities exist between public funding for students using educational choice programs and their peers in nearby public school systems.
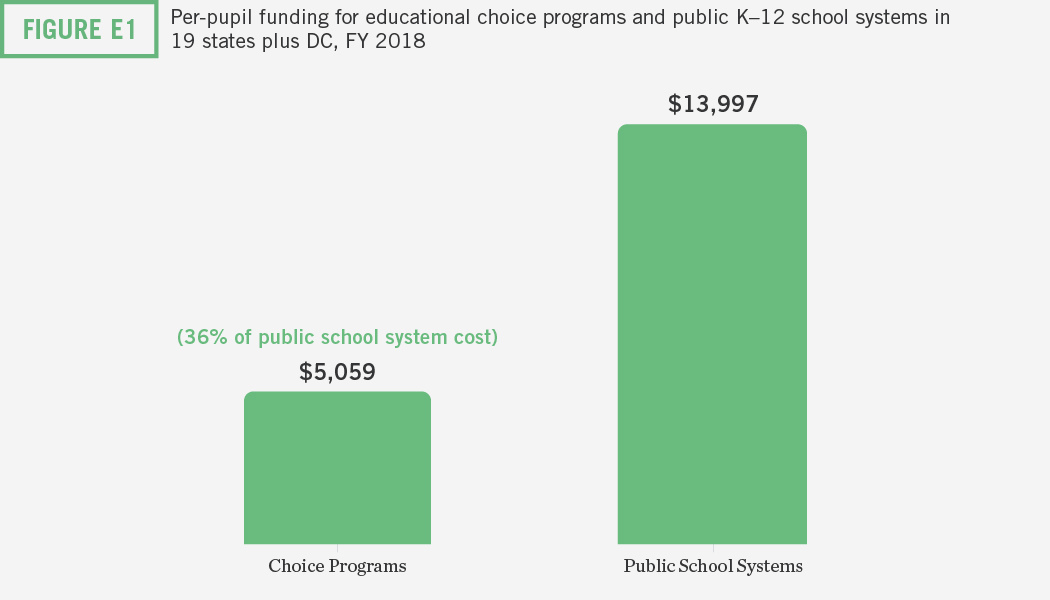
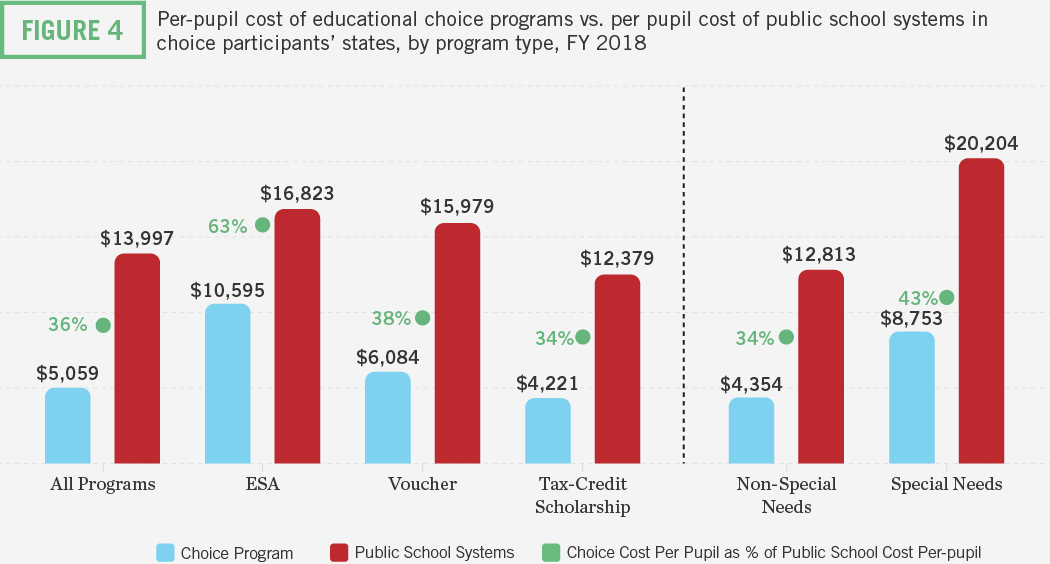
- In FY 2018, the average per-student public cost to support educational choice programs was about $5,000 compared to $14,000 for public K–12 in states where choice programs operate. Thus, students using educational choice programs only received around one-third of the average per-pupil funding amount that their peers received in nearby public school systems in FY 2018. (Figure ES-1)
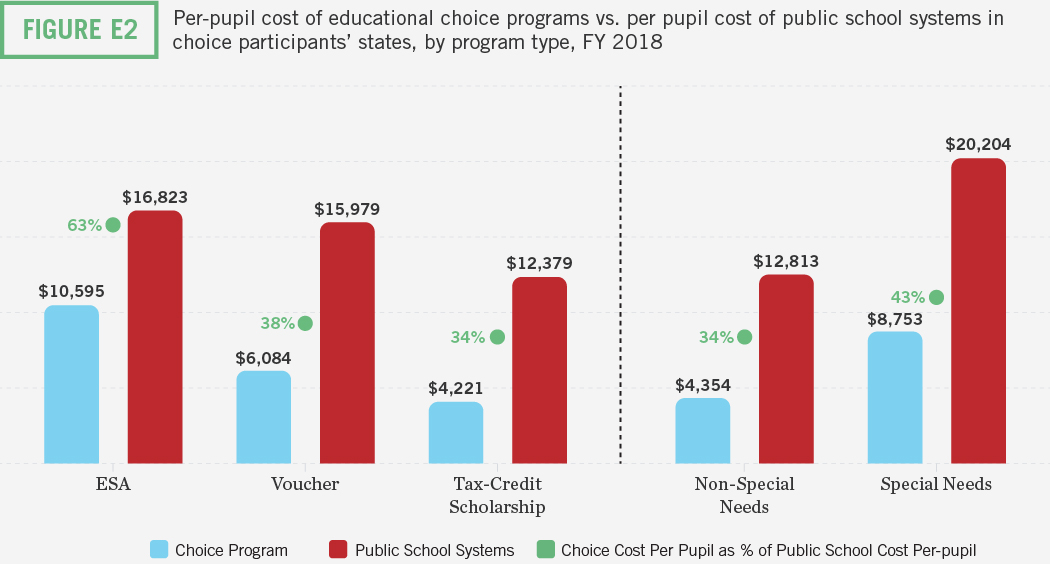
- These funding gaps appear smaller for special needs programs compared to programs for students without special needs. Average per-pupil funding for special needs programs is 57 percent less than average per-pupil funding for public schools while average per-pupil funding for non-special needs programs is 66 percent less than average per-pupil funding for public schools.
- Compared to voucher and tax-credit scholarship programs, these funding gaps are also smaller for ESA programs, which serve mostly students with special needs. (Figure ES-2)
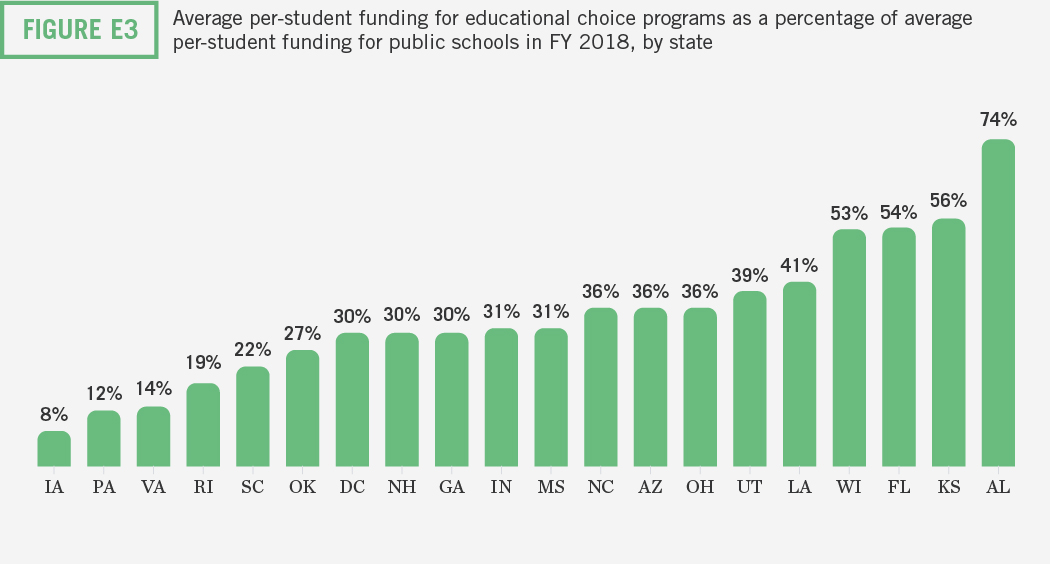
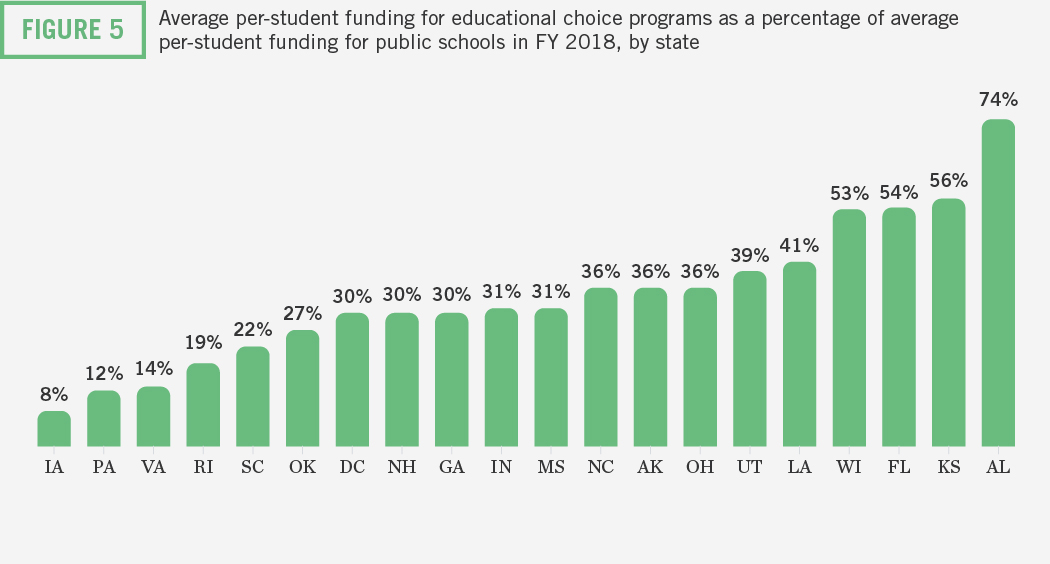
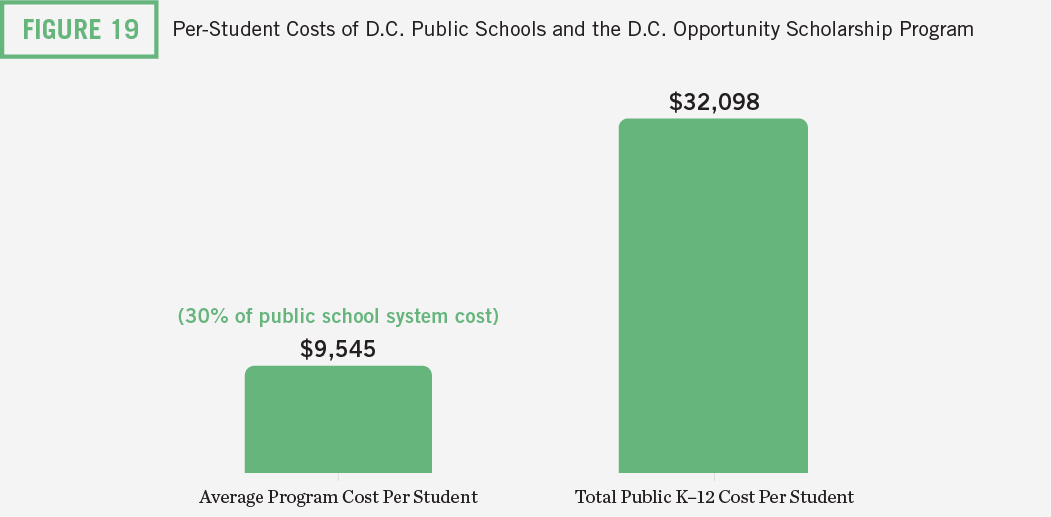
- For 11 of the 19 states plus D.C. in the analysis, students in choice programs received less than one-third of the revenue they would generate for their states’ public schools. For example, students using the D.C. OSP received about 30 percent of the amount that their peers received in nearby public schools.
- For four-fifths of the states plus D.C., students in choice programs received less than half the per-student funding they would generate for public schools. These states enrolled more than 60 percent of students participating in the 40 programs considered during FY 2018. (Figure ES-3)
i National Association of State Budget Officers (2020). 2020 State Expenditure Report: Fiscal Years 2018-2020, retrieved from: https://www.nasbo.org/reports-data/state-expenditure-report
Introduction
School choice critics argue that choice programs drain resources from public schools and therefore harm students who remain in them.1 Because policymakers are tasked with balancing their states’ budgets and ensuring that their public schools meet educational provisions in their states’ constitutions, they are concerned with the fiscal effects of these programs.2
More than two dozen studies have examined educational choice programs’ effects on students enrolling in nearby public schools. Researchers have conducted a handful of systematic reviews of competitive effects research and, more recently, a meta-analysis of this body of research.3 In each of these reviews, researchers conclude that students who remain in district schools after exposure to educational choice programs tend to experience modest educational benefits.4 But the question remains whether educational choice programs lead to higher costs for taxpayers or fewer resources for students who remain in public schools. This report aims to inform conversations about these fiscal issues.
This report summarizes information on the fiscal effects of educational choice programs across the United States. It analyzes 40 educational choice programs in 19 states plus D.C. The programs in the analysis include three education savings accounts programs, 19 school voucher programs, and 18 tax-credit scholarship programs.
- Education savings accounts (ESAs) allow parents to receive a deposit of public funds into government-authorized savings accounts with restricted, but multiple, uses such as private school tuition and fees, online learning programs, private tutoring, community college costs, higher education expenses and other approved customized learning services and materials.
- School vouchers give parents the ability to choose a private school for their children, using all or part of the public funding set aside for their children’s education.
- Tax-credit scholarships allow individual and business taxpayers to receive full or partial tax credits when they donate to nonprofits that provide private school scholarships.5
This study estimates the combined fiscal effects of each educational choice program on state and local taxpayers through FY 2018, including lower bound and upper bound fiscal effects. The information contained in this report is designed to help policymakers and others understand whether educational choice programs have positive, negative, or neutral fiscal effects overall on taxpayers.
The report also presents basic facts about the size and scope of each program, in terms of participation and funding, relative to each state’s public school system. It also presents the facts on public funding disparities between the choice programs and public schools.
Programs Included in Fiscal Analysis
This study uses short-run and long-run variable cost estimates to generate lower bounds and upper bounds on the fiscal effects of educational choice program on taxpayers through FY 2018. The longer a program operates, the closer the savings approach the upper bound estimates. The shorter a program is in place, the closer its fiscal effects to the lower bound. Of the 40 programs in the analysis, four programs in this study were in operation for less than five years while the remaining 36 programs were in operation for at least five years through FY 2018.
Today there are 76 educational choice programs currently operating in 32 states plus Washington, D.C. and Puerto Rico.6 The present analysis examines 40 educational savings account (ESA), school voucher, and tax-credit scholarship programs covering 19 states and D.C from 1990 through 2018. The analysis excludes individual tax-credit and tax deduction programs and town-tuitioning programs. The analysis includes programs with at least three years of data available as the full impact of educational choice programs usually takes time to materialize.7 One-third of programs covered in this report (13) exclusively serve students with special needs. Additionally, more than half of students participating in Arizona’s ESA program are special needs students.
The programs studied include:
1. Alabama’s Education Scholarship Program
2. Arizona’s Empowerment Scholarship Accounts
3. Arizona’s “Switcher” Individual Income Tax Credit Scholarship Program
4. Arizona’s Lexie’s Law for Disabled and Displaced Students Tax Credit Scholarship Program
5. Arizona’s Low-Income Corporate Income Tax Credit Scholarship Program
6. Arizona’s Original Individual Income Tax Credit Scholarship Program
7. D.C.’s Opportunity Scholarship Program
8. Florida Tax Credit Scholarship Program
9. Florida’s Gardiner Scholarships
10. Florida’s John M. McKay Scholarships for Students with Disabilities Program
11. Georgia Special Needs Scholarship Program
12. Georgia’s Qualified Education Expense Tax Credit
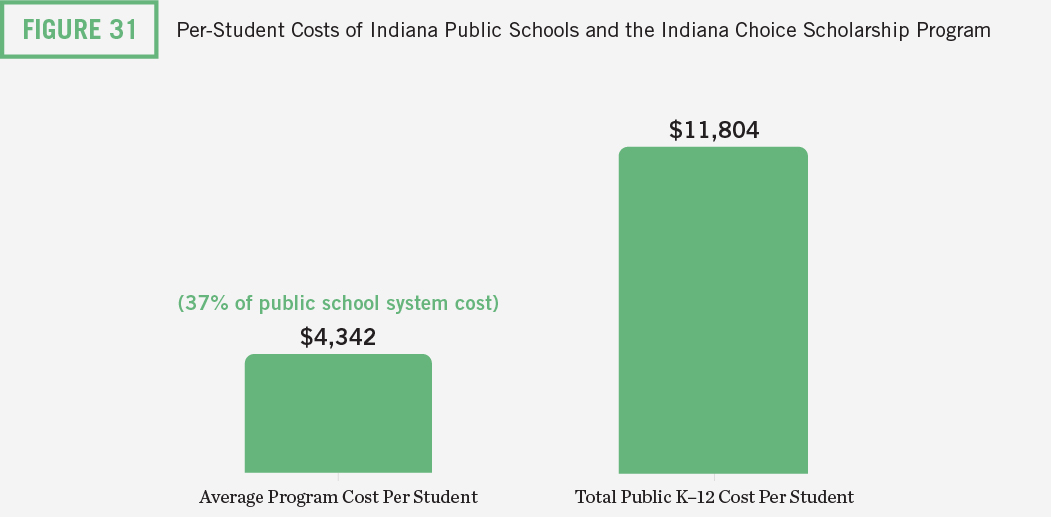
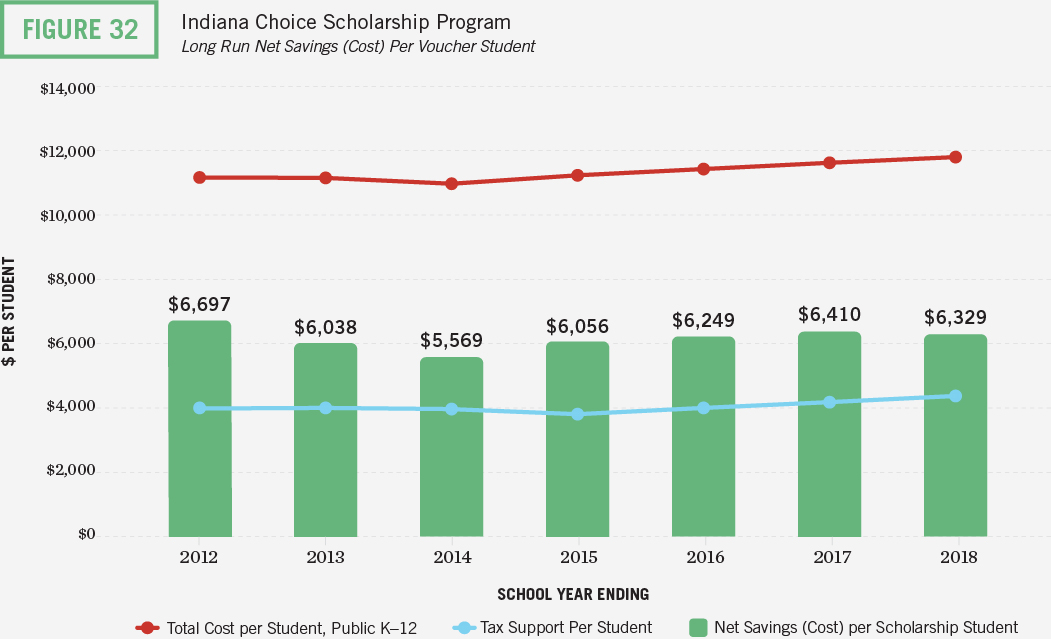
13. Indiana’s Choice Scholarship Program
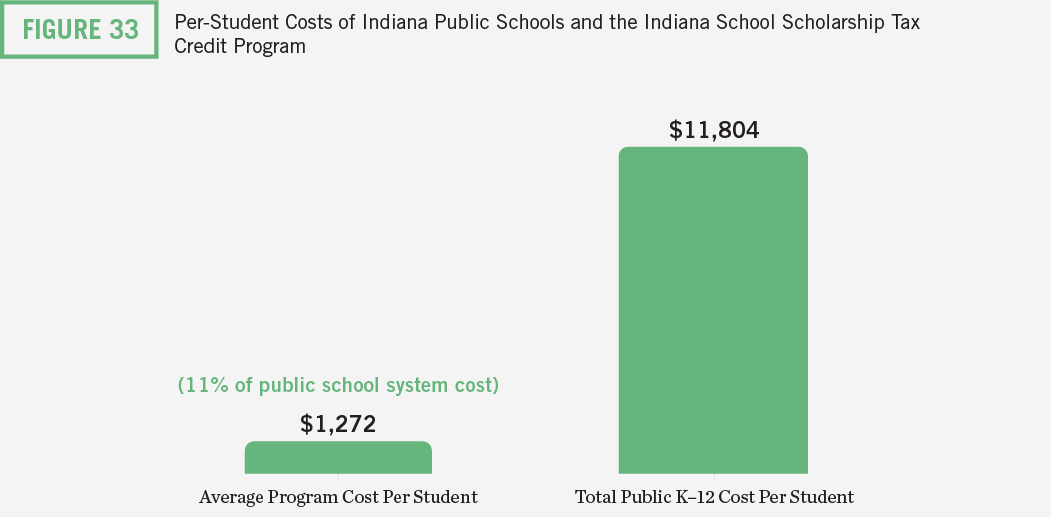
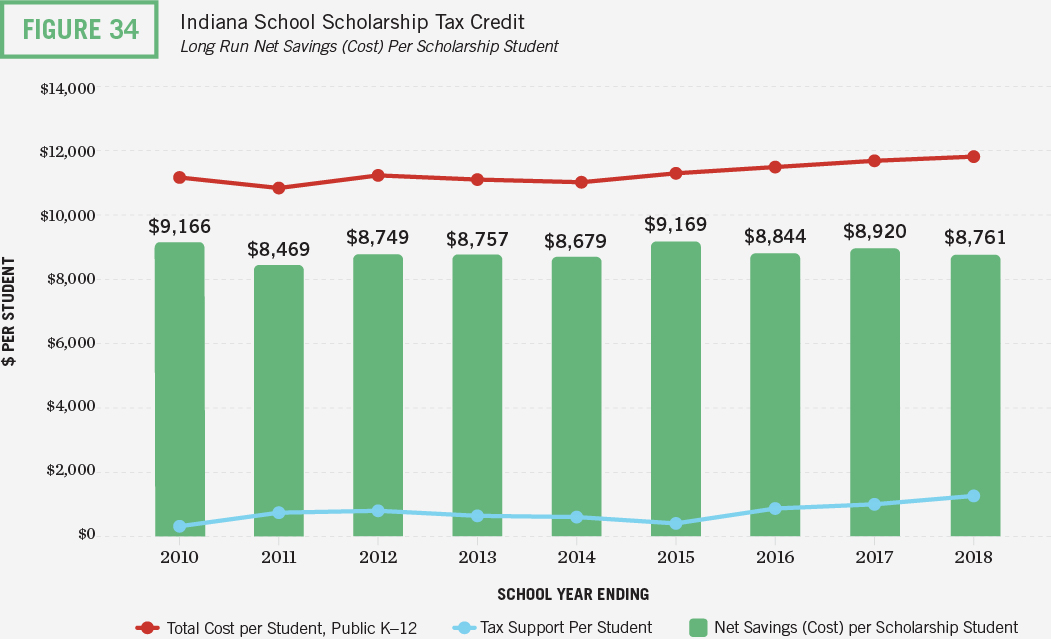
14. Indiana’s School Scholarship Tax Credit
15. Iowa’s School Tuition Organization Tax Credit
16. Kansas’s Tax Credit for Low Income Students Scholarship Program
17. Louisiana Scholarship Program
18. Louisiana’s School Choice Program for Certain Students with Exceptionalities
19. Louisiana’s Tuition Donation Rebate Program
20. Mississippi Dyslexia Therapy Scholarship for Students with Dyslexia Program
21. Mississippi’s Equal Opportunity for Students with Special Needs Program
22. New Hampshire’s Education Tax Credit Program
23. North Carolina’s Opportunity Scholarships
24. North Carolina’s Special Education Scholarship Grants for Children with Disabilities
25. Ohio’s Autism Scholarship
26. Ohio’s Cleveland Scholarship Program
27. Ohio’s Educational Choice Scholarship Program
28. Ohio’s Income-Based Scholarship Program
29. Ohio’s Jon Peterson Special Needs Scholarship Program
30. Oklahoma’s Equal Opportunity Education Scholarships
31. Oklahoma’s Lindsey Nicole Henry Scholarships for Students with Disabilities
32. Pennsylvania’s Educational Improvement Tax Credit Program
33. Pennsylvania’s Opportunity Scholarship Tax Credit Program
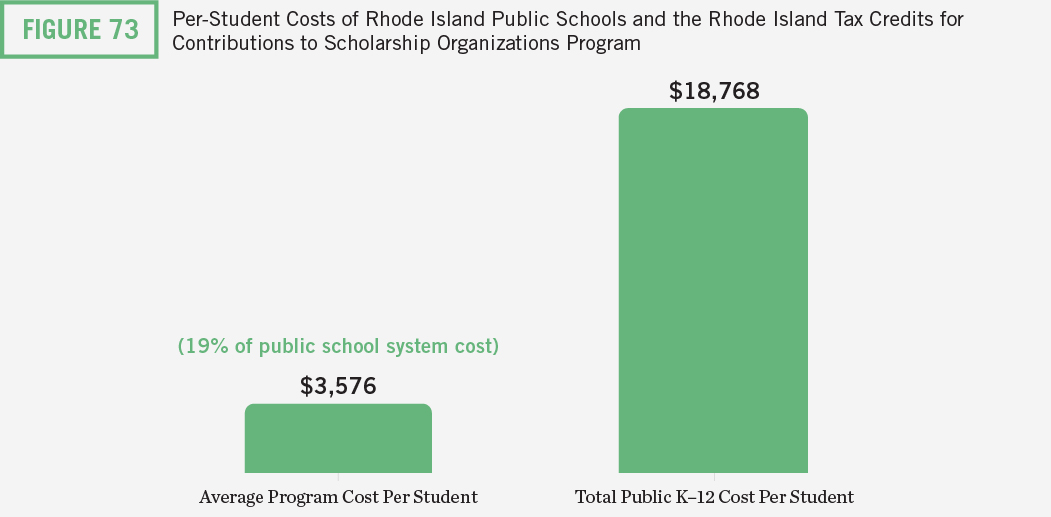
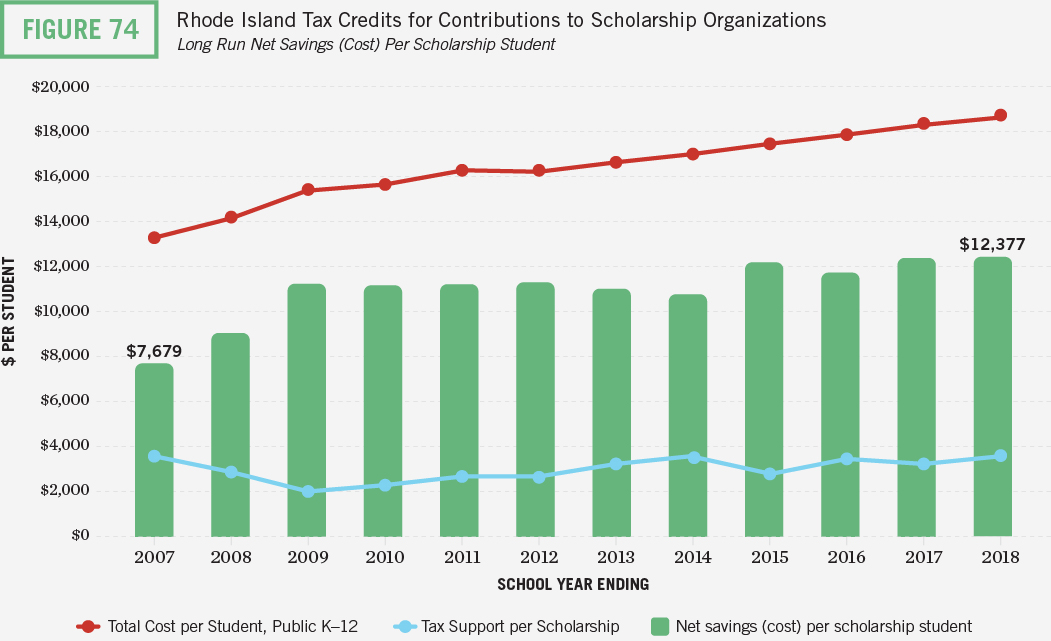
34. Rhode Island’s Tax Credits for Contributions to Scholarship Organizations
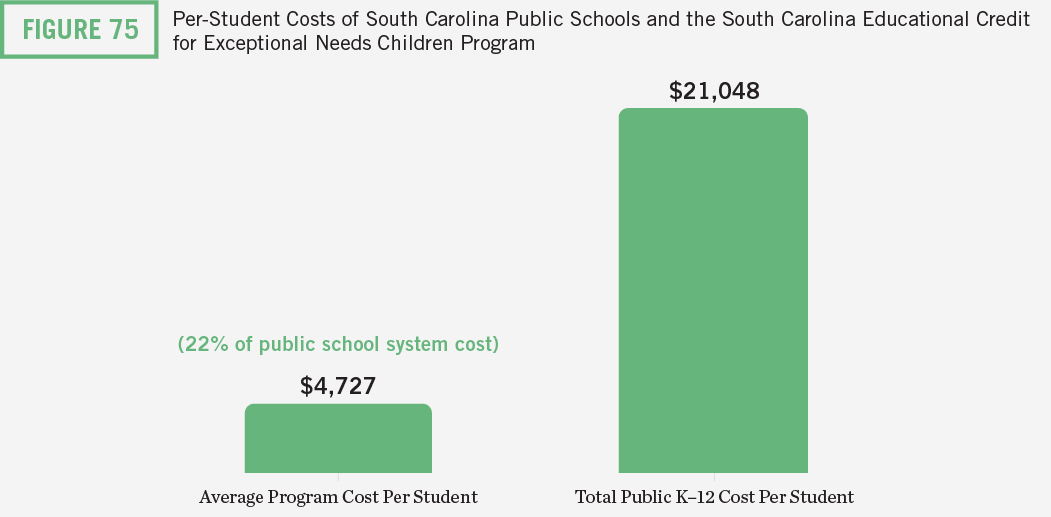
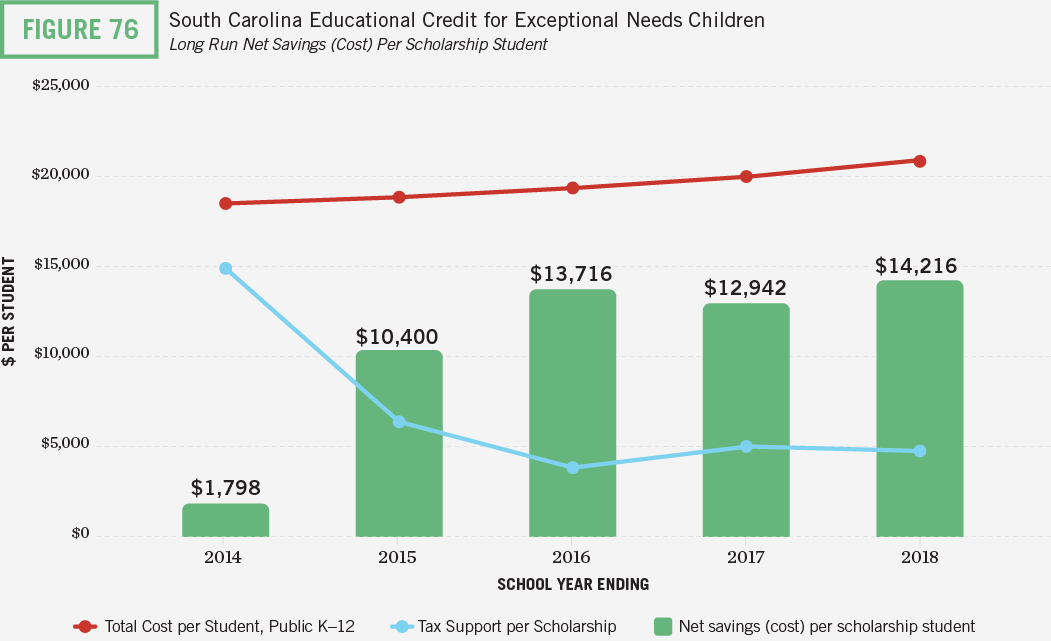
35. South Carolina’s Educational Credit for Exceptional Needs Children
36. Utah’s Carson Smith Special Needs Scholarship
37. Virginia’s Education Improvement Scholarships Tax Credits Program
38. Wisconsin’s Milwaukee Parental Choice
39. Wisconsin’s Parental Choice Program (Statewide)
40. Wisconsin’s Parental Private School Choice Program (Racine)
Funding Context
A chief concern among educational choice opponents is that these programs will lead to a mass exodus of students from public schools, consequently harming public schools fiscally and leaving students who choose to stay in them worse off. Where choice programs currently operate, including states with the largest and oldest programs, it appears these concerns haven’t materialized.
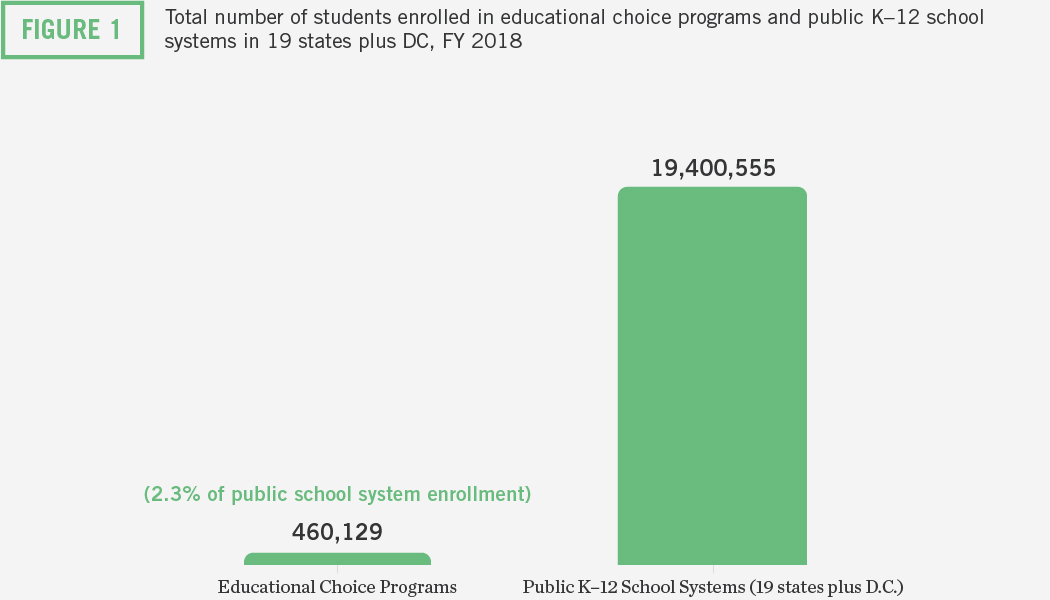
The cumulative number of education savings accounts, school vouchers, and tax-credit scholarships disbursed through FY 2018 for K–12 students to attend non-public school settings and access other educational services exceeded 3.7 million. In FY 2018, the number of students participating in educational choice programs comprised just 2.3 percent of all publicly funded K-12 students in states with choice programs (Figure 1).
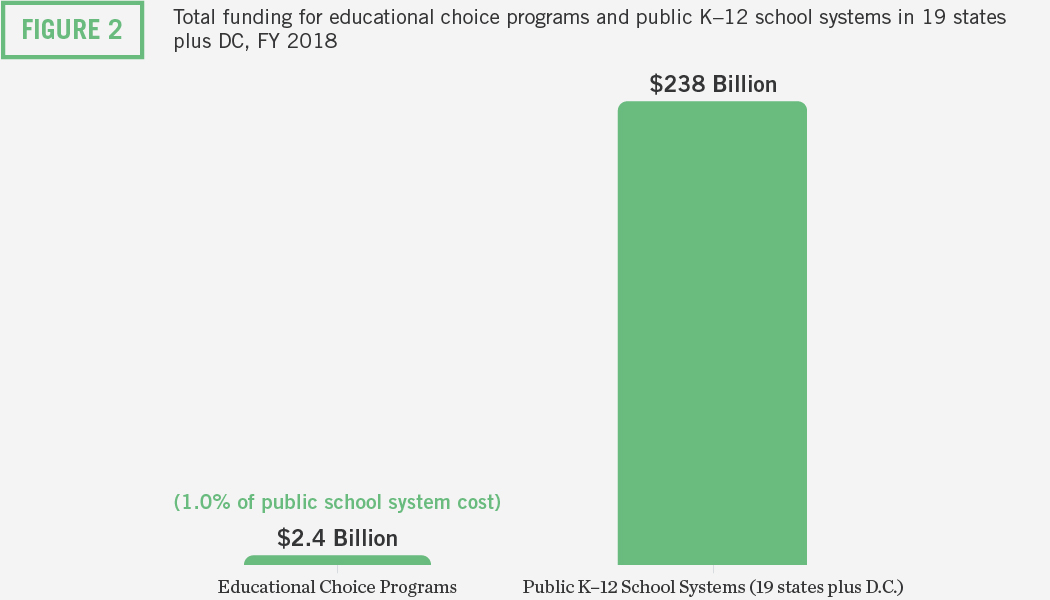
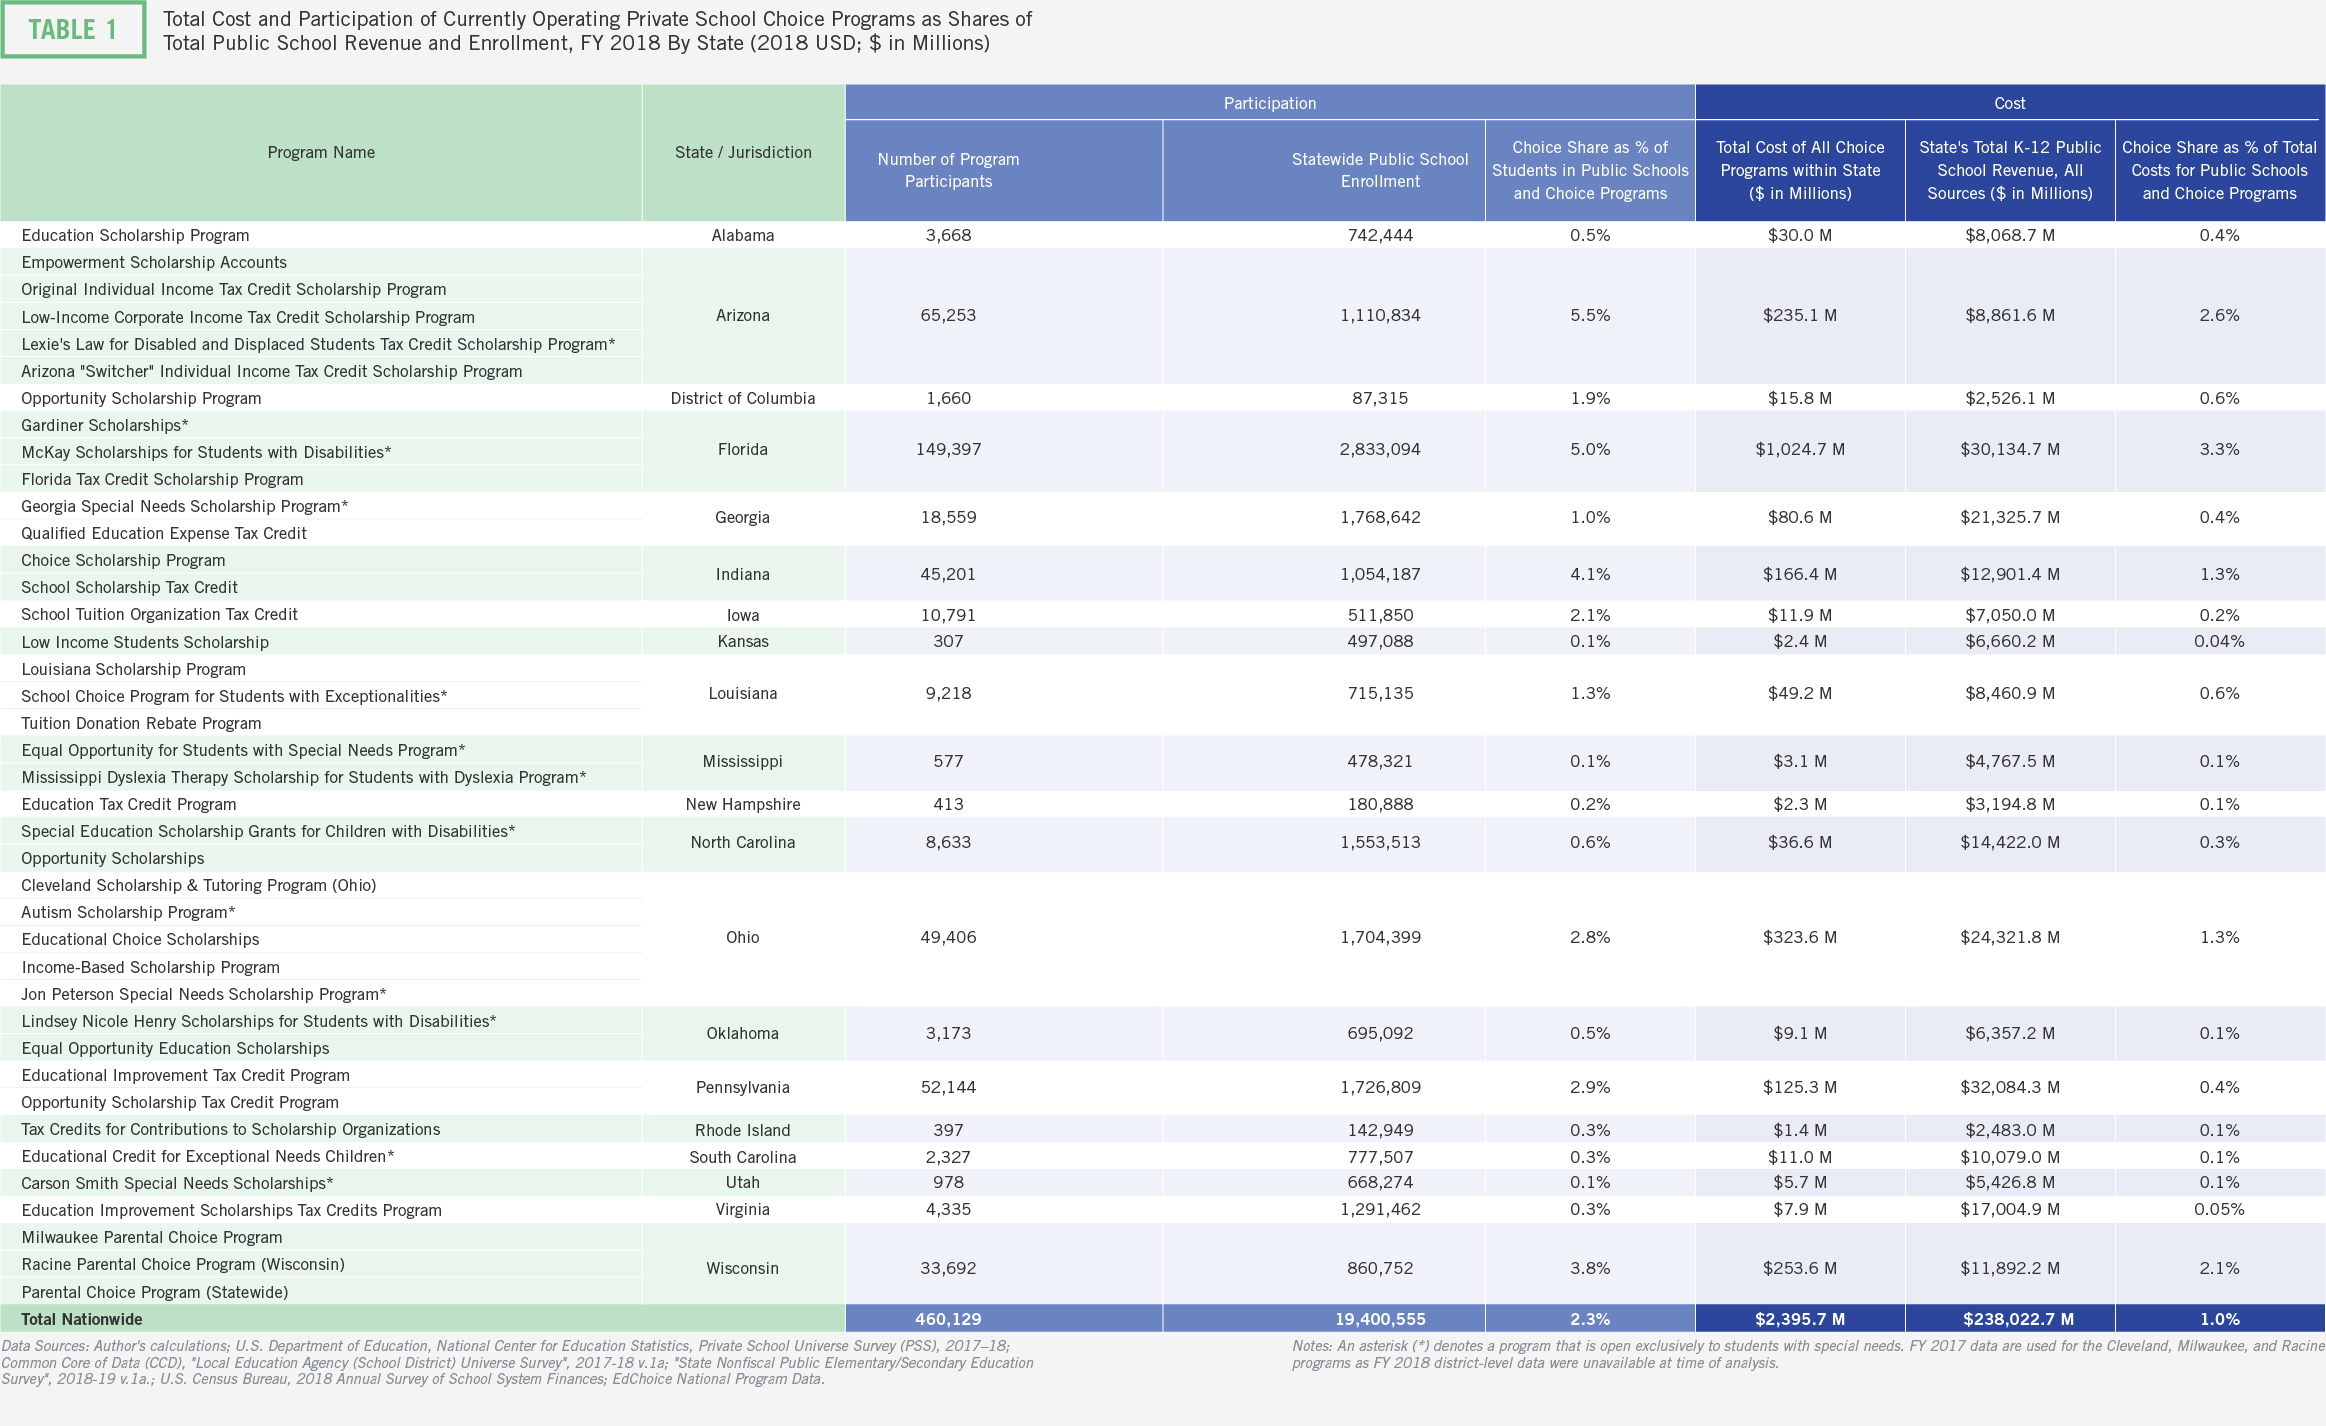
The total cost to taxpayers in FY 2018 to support the educational choice programs under study was 1 percent of taxpayer funding to support the public K–12 school systems in these 19 states plus D.C. (Figure 2). Educational choice programs in Florida received the largest share (3.3 percent) of public school costs while no other state’s share exceeded 3 percent. The share of public school costs is below 1 percent for 15 of the 20 states in the analysis.
Overall, choice programs enroll 2 percent of publicly funded students while receiving 1 percent of public funding for K-12 education. Thus, educational choice programs are funded at lower public expense than public K-12 school systems.
Table 1 shows participation and funding shares for each choice program. The left panel shows the total number of students participating in educational choice programs, each state’s total enrollment in public schools, and choice program participants as a percentage of enrollment in public schools plus choice programs for each state in FY 2018. The right panel shows the total cost to taxpayers to support each state’s educational choice programs; the amount of revenue from local, state, and federal sources that flows to each state’s public K-12 school system; and the choice share for each state in FY 2018 (expressed as a percentage of total costs for public schools plus choice programs).
Let’s look at states with some of the largest and oldest choice programs. Arizona’s five choice programs enrolled 5.5 percent of publicly funded students and received just 2.6 percent of public funding for K-12 in FY 2018. In Florida, choice programs enrolled 5 percent of publicly funded students while receiving 3.3 percent of public funds. In Indiana, the enrollment and funding shares were 4.1 percent and 1.3 percent respectively. In Ohio, choice programs enrolled 2.8 percent of publicly funded students while receiving 1.3 percent of public funding. And in Wisconsin, home of the oldest school voucher program in the country, choice programs enrolled 3.8 percent of publicly funded students and received 2.1 percent of the public funds.
The number of students participating in choice programs in half the states in the analysis (10) represent less than 1 percent of all students enrolled in public and private schools. Even in the states with some of the most vibrant choice ecosystems, the percent of students exercising choice is modest.
For all programs, the percentage of publicly funded students participating in choice programs exceeded the percentage of public funds directed to those programs. This suggests that choice programs generate fiscal benefits for taxpayers.
These basic facts provide important background for evaluating claims that educational choice programs harm students who remain in district schools. In light of this context, it may be difficult to see how expanding educational opportunities for families via educational choice programs might harm public school systems. To be sure, many studies have examined educational choice programs’ effects on students enrolling in nearby public schools. A handful of systematic reviews of competitive effects research and, more recently, one meta-analysis has been conducted by researchers.8 All of these reviews conclude that students who remain in district schools, after exposure to increased competition from choice programs, experience modest and positive gains in learning. Contrary to claims that students in district schools are harmed by increasing educational choice, the evidence suggests otherwise.
Student Funding Gaps
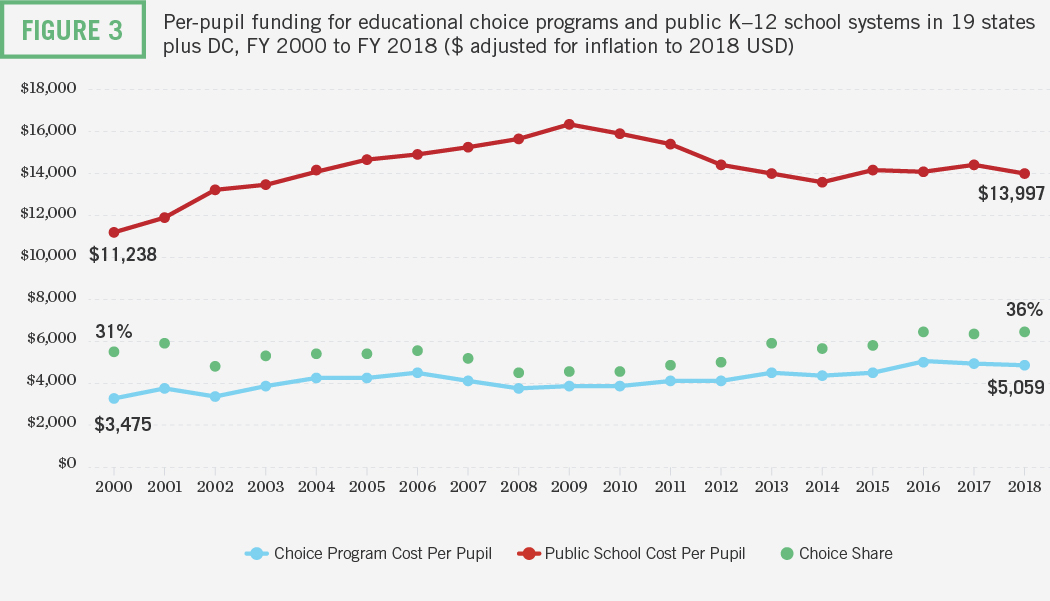
Figure 3 displays the per-pupil funding for choice programs and funding for public K–12 school systems between FY 2000 and FY 2018. The per-pupil cost of choice programs as a percentage of per-pupil public school funding slightly increased from 31 percent to 36 percent. In FY 2018, the average per-pupil funding for educational choice programs was 64 percent less than the average per-pupil funding for public schools ($5,000 vs. $14,000).9
Figure 4 shows funding differences between choice programs and public school systems by program type. The three ESA programs in the study have smaller per-student funding gaps, where the average cost of ESAs per student is 63 percent of the estimated average cost per student of the ESA students enrolling in their respective public school systems. These costs are higher than the overall average cost of all choice programs and public K–12 because Florida and Mississippi ESA programs exclusively serve children with special needs, and more than half of students in Arizona’s ESA program have special needs.
Funding gaps for voucher and tax-credit scholarship programs are much greater, where average per-pupil funding for voucher and tax-credit scholarship programs are 62 and 66 percent less than average per-pupil funding for public schools respectively. Overall funding gaps for special needs programs and non-special needs programs are somewhat different, 43 percent and 34 percent respectively.
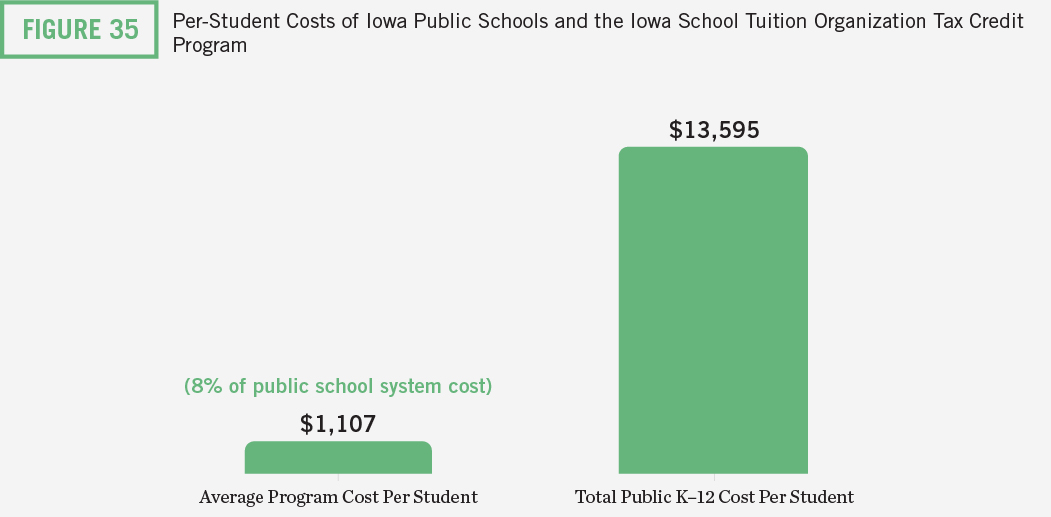
Figure 5 displays the percentage of per-student funding for public schools directed to educational choice programs for each state. Average funding per-student as a percent of per-student funding for public school systems ranges from 8 percent (Iowa’s tax-credit scholarship program) to 74 percent (Alabama’s tax-credit scholarship program).
Students in choice programs located in about half of states in the analysis (11 of 20 states) received less than one-third of revenue they would receive in public schools. For four-fifths of the states, choice programs received less than half the per-student funding they would have generated for public schools. These states enrolled more than 60 percent of students participating in the 40 programs considered during FY 2018.
These gaps indicate significant fiscal benefits for taxpayers and school districts when students are redirected from the public school system via choice programs. Moreover, funding systems for public schools are not completely based on student enrollment. Therefore, districts tend to benefit fiscally because they often keep a significant portion of the per-pupil funding for students who leave. For example, districts in some states such as Georgia and Indiana keep all local revenue—only state revenue is tied directly to enrollment.
Most states also have either declining enrollment provisions or “hold harmless” funding provisions embedded in their funding systems. These provisions guarantee districts all or most of the basic education funding they received for the prior year or some other year in the past, even if enrollment declines. Declining enrollment provisions, to a lesser extent than “hold harmless,” mitigate the fiscal impact of declining enrollment.10
Funding policies tend to produce a happy fiscal byproduct for district schools where public schools end up with more resources on a per-student basis, all else equal. Such arrangements, however, raise questions about funding equity and how governments fund different groups of students. A single student can generate significantly different amounts of revenue for schools in different settings or districts.
Large funding gaps between the public cost of educational choice programs and public school systems indicate substantial fiscal benefits that accrue to taxpayers when students switch from public to private schools as a result of choice programs.
Educational Costs
Concerns about the fiscal impacts of educational choice programs are usually focused on short-run costs facing public school districts. In the short term, some costs vary completely or partially with enrollment while in the long run all costs are variable. Long run may be used as a time-based concept. When a school gains or loses students, its options are somewhat limited in the immediate term. For example, because school budgets are usually set on an annual basis, they may be limited in how they can respond to enrollment changes mid-year. Over time, however, public schools and districts will have more options for them to adapt, such as finding more cost-effective ways to deliver a curriculum or program.
Even over a long period of time, however, options to reduce costs may be limited or unrealistic. In most cases, it doesn’t make sense to hire an additional full-time teacher when one additional student enrolls. Therefore, long run may also relate to the size of changes in student enrollment. The larger an enrollment change, the more opportunities districts will have to adjust costs. For example, a school may open, close, or merge classrooms, or a district may build new buildings or consolidate schools.
One line often used to express concern about the fiscal effects of choice programs is that schools “need to keep the lights on.” That is, because of high fixed costs, educational choice programs will render districts unable to cover their fixed costs without harm to students. If this were true, then it follows that there would be little to no added costs when enrollment increases. Of course, this is not the case. To be sure, some public school officials that levy these arguments against choice programs will also request more funding because they anticipate enrollment growth—thus, they either believe that they have high fixed costs or high variable costs. Both cannot be true, however.
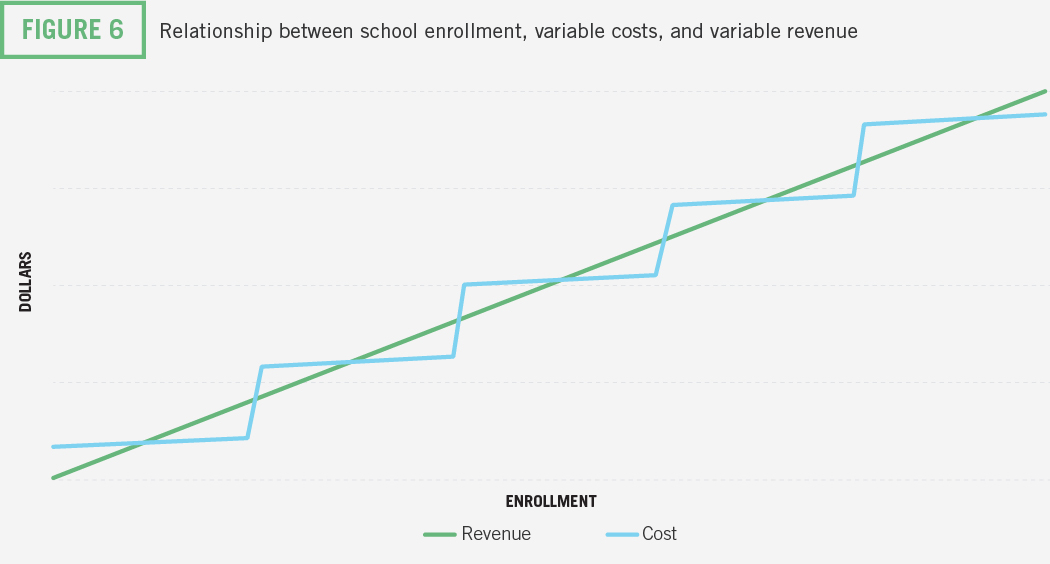
In reality, both revenues and costs change with enrollment, though not in perfect unison. Figure 6 illustrates this reality. Over a broad range of enrollment, costs and revenue correspond to enrollment changes. Over a small range of enrollment change, a school may incur a reduction or increase in revenue while most of its costs remain flat. This corresponds to the horizontal portion of each step. If a school gains or loses a few students, it wouldn’t necessarily be in the best interest of the school to add or remove a teacher based on small fluctuations in student enrollment. Staffing is not easily changed on a per-student basis.
It’s also notable that the change in revenue associated with small changes in enrollment represents a relatively small portion of a large budget. Enrollment fluctuations are a reality that districts have long dealt with, and changes in demand for services is not unique to schools. All kinds of enterprises face this reality (e.g., pre-kindergarten, colleges and universities, hospitals, law firms, and grocery stores).
Financial management is a standard part of the educational landscape that officials handle on a routine basis. Certainly, school officials face real challenges when revenue declines, and those challenges shouldn’t be dismissed. The point here is that the challenges from a decrease in revenue are not a problem uniquely tied to educational choice. It is a natural part of the education landscape that school officials routinely face: families move in and out of districts and schools for all kinds of reasons. And it is not a “choice problem.” The fiscal effect on school districts from students leaving choice programs is the same as the fiscal effects from students who leave for other reasons. If one’s opposition to a choice program stems from effects on finances, then it follows that he/she would also oppose families moving among districts and support policies that prohibit such movement.
This report endeavors to provide policymakers with information about the overall fiscal effects of educational choice programs. To be clear, it does not describe what financial decisions were made by school officials when students left to participate in educational choice programs. The analysis describes what costs can be adjusted in the short run, rather than what costs were adjusted or will be adjusted.11
Methods
Educational choice programs create a direct cost for taxpayers because taxpayers pay for ESAs and vouchers, and tax-credit disbursements reduce the amount of tax revenue received. There also is a direct fiscal benefit from students who choose to not enroll in public schools because of the receipt of a scholarship.
The net fiscal effect of a choice program is the difference between savings from switchers and the program’s costs:
Net Fiscal Effect = [Cost Reduction from Switchers] – [Cost of the Choice Program]
Switchers are students who would enroll in a public school without financial assistance from an educational choice program. Measuring the fiscal effects of educational choice programs represents a complicated exercise. Not only does school funding come from different sources (federal, state, and local governments), but complex school funding formulas determine the allocation of these revenues.
Isolating the fiscal effects of a choice program to a single group of taxpayers would require applying each individual state’s school funding formula. Doing so for just one program would necessitate a significant undertaking. For this reason, this report reports lower bound (short-run) and upper bound (long-run) estimates for the fiscal effects of educational choice programs that accrue to state and local taxpayers combined. This approach is appropriate for a fiscal analysis that is national in scope—and because taxpayers in each state pay both state and local taxes. The analysis that follows provides a fiscal picture for each program that is useful for examining the extent to which these programs generate net fiscal benefits or net costs overall.
Short-run net fiscal effect (NFEs)
The analysis uses estimates of short-run variable costs to evaluate the short-term net fiscal effect (NFES) of educational choice programs. The net fiscal effect by a given program on the state budget is captured by the following equation:
NFES = [RS x E x s] – [C x E] (1)
In equation (1), RS is the average revenue per pupil retained by the state for a student who leaves a public school system via the choice program; E is the total number of students who participate in the choice program; s is the switcher rate (the percent of program participants who are switchers); and C is the average cost per student to provide ESAs, vouchers, or tax credits. The last term (C x E) is the total cost of a choice program. For tax-credit scholarship programs, the analysis uses tax-credit disbursements instead of the amount of scholarships awarded. These amounts can differ if the tax-credit rate is not 100 percent or if a program allows SGOs to use a portion of donations for administrative costs. The term (RS x E x s) signifies savings from student switchers and represents relief from the cost to state taxpayers to support the education of these students in the public school system.
The net fiscal impact on local taxpayers and public schools (NFEL) is:
NFEL = [AVC x E x s] – [RS x E x s] (2)
AVC represents estimated short-run average variable costs per student in public schools. Note that RS is a cost to public school districts and local taxpayers—it represents reduced state revenue from students who leave a public school. RS is determined by a state’s school funding formula and can vary significantly by school district. This term appears in equations (1) and (2) above. When a student leaves a public school, that student concurrently creates savings for the state and a reduction in state revenue for their school district.12
Adding (1) and (2) above yields the combined net fiscal effect on state and local taxpayers (NFE) in the short run:
NFE = NFES + NFEL = [AVC x E x s] – [C x E] (3)
The term [RS x E x s] from equations (1) and (2) drops out in equation (3). It represents savings for the state and a revenue reduction for public schools. Because non-switchers (i.e., students who previously enrolled in private schools absent financial assistance) represent an additional cost to taxpayers, a greater migration of students from public schools into a choice program implies greater savings from the state’s point of view and a greater reduction in state revenue that public schools receive, all else equal.13
Long-run net fiscal effect (NFE*)
A fundamental economic principle maintains that in the long run, all costs are variable. The long-run fiscal effect (NFE*) of choice programs is estimated by comparing the total per-student cost of educating students in the public school system (denoted TC) with the public cost of supporting those students in educational choice programs:
NFE* = [TC x E x s] –– [C x E]
Equation (4) says that NFE* is the difference between the total cost to educate students in the choice program who would have enrolled in the public school system without financial assistance and the total cost of the choice program. This estimate represents an upper bound and estimates from equation (3) represent a lower bound. Several years after the creation of a new school choice program, once enrollment patterns steady and local public school district leaders have time to adjust, savings will approach these long-run estimates.14
Estimating Short-Run Variable Costs
Our approach for estimating short-run variable costs employs school finance data from the National Center for Education Statistics and uses the same accounting methods from Lueken (2018).15 Variable cost estimates comprise three categorical expenditures: Instruction, Instructional Support Services, and Student Support Services. The analysis assumes all other categorical expenditures as fixed including capital, maintenance, debt service, administration, transportation, food service, enterprise operations, and numerous other categorical expenditures. Some of these excluded categories, such as transportation and food service, are likely variable or partially variable in the short run.
This approach is more cautious than methods used by some economists and will generate smaller savings estimates.16 In addition, the analysis below applies an adjustment to variable cost estimates for students with special needs, discussed in more detail below.
Estimating Switcher Rates
A student who switches from a public school, only because they received a scholarship, will generate savings overall if the short-run variable cost exceeds the program cost for that student (AVC > C). Non-switchers are students who would have enrolled in a nonpublic educational setting anyway even without a choice program in place. They represent a fiscal cost equal to the program cost without any savings. Two main factors determine the estimates of the fiscal effects of educational choice programs:
- The number of students who would have attended public schools without the financial assistance from the educational choice program (switchers), and
- The education costs directly associated with the switching student that will no longer be spent by the school district (variable costs).
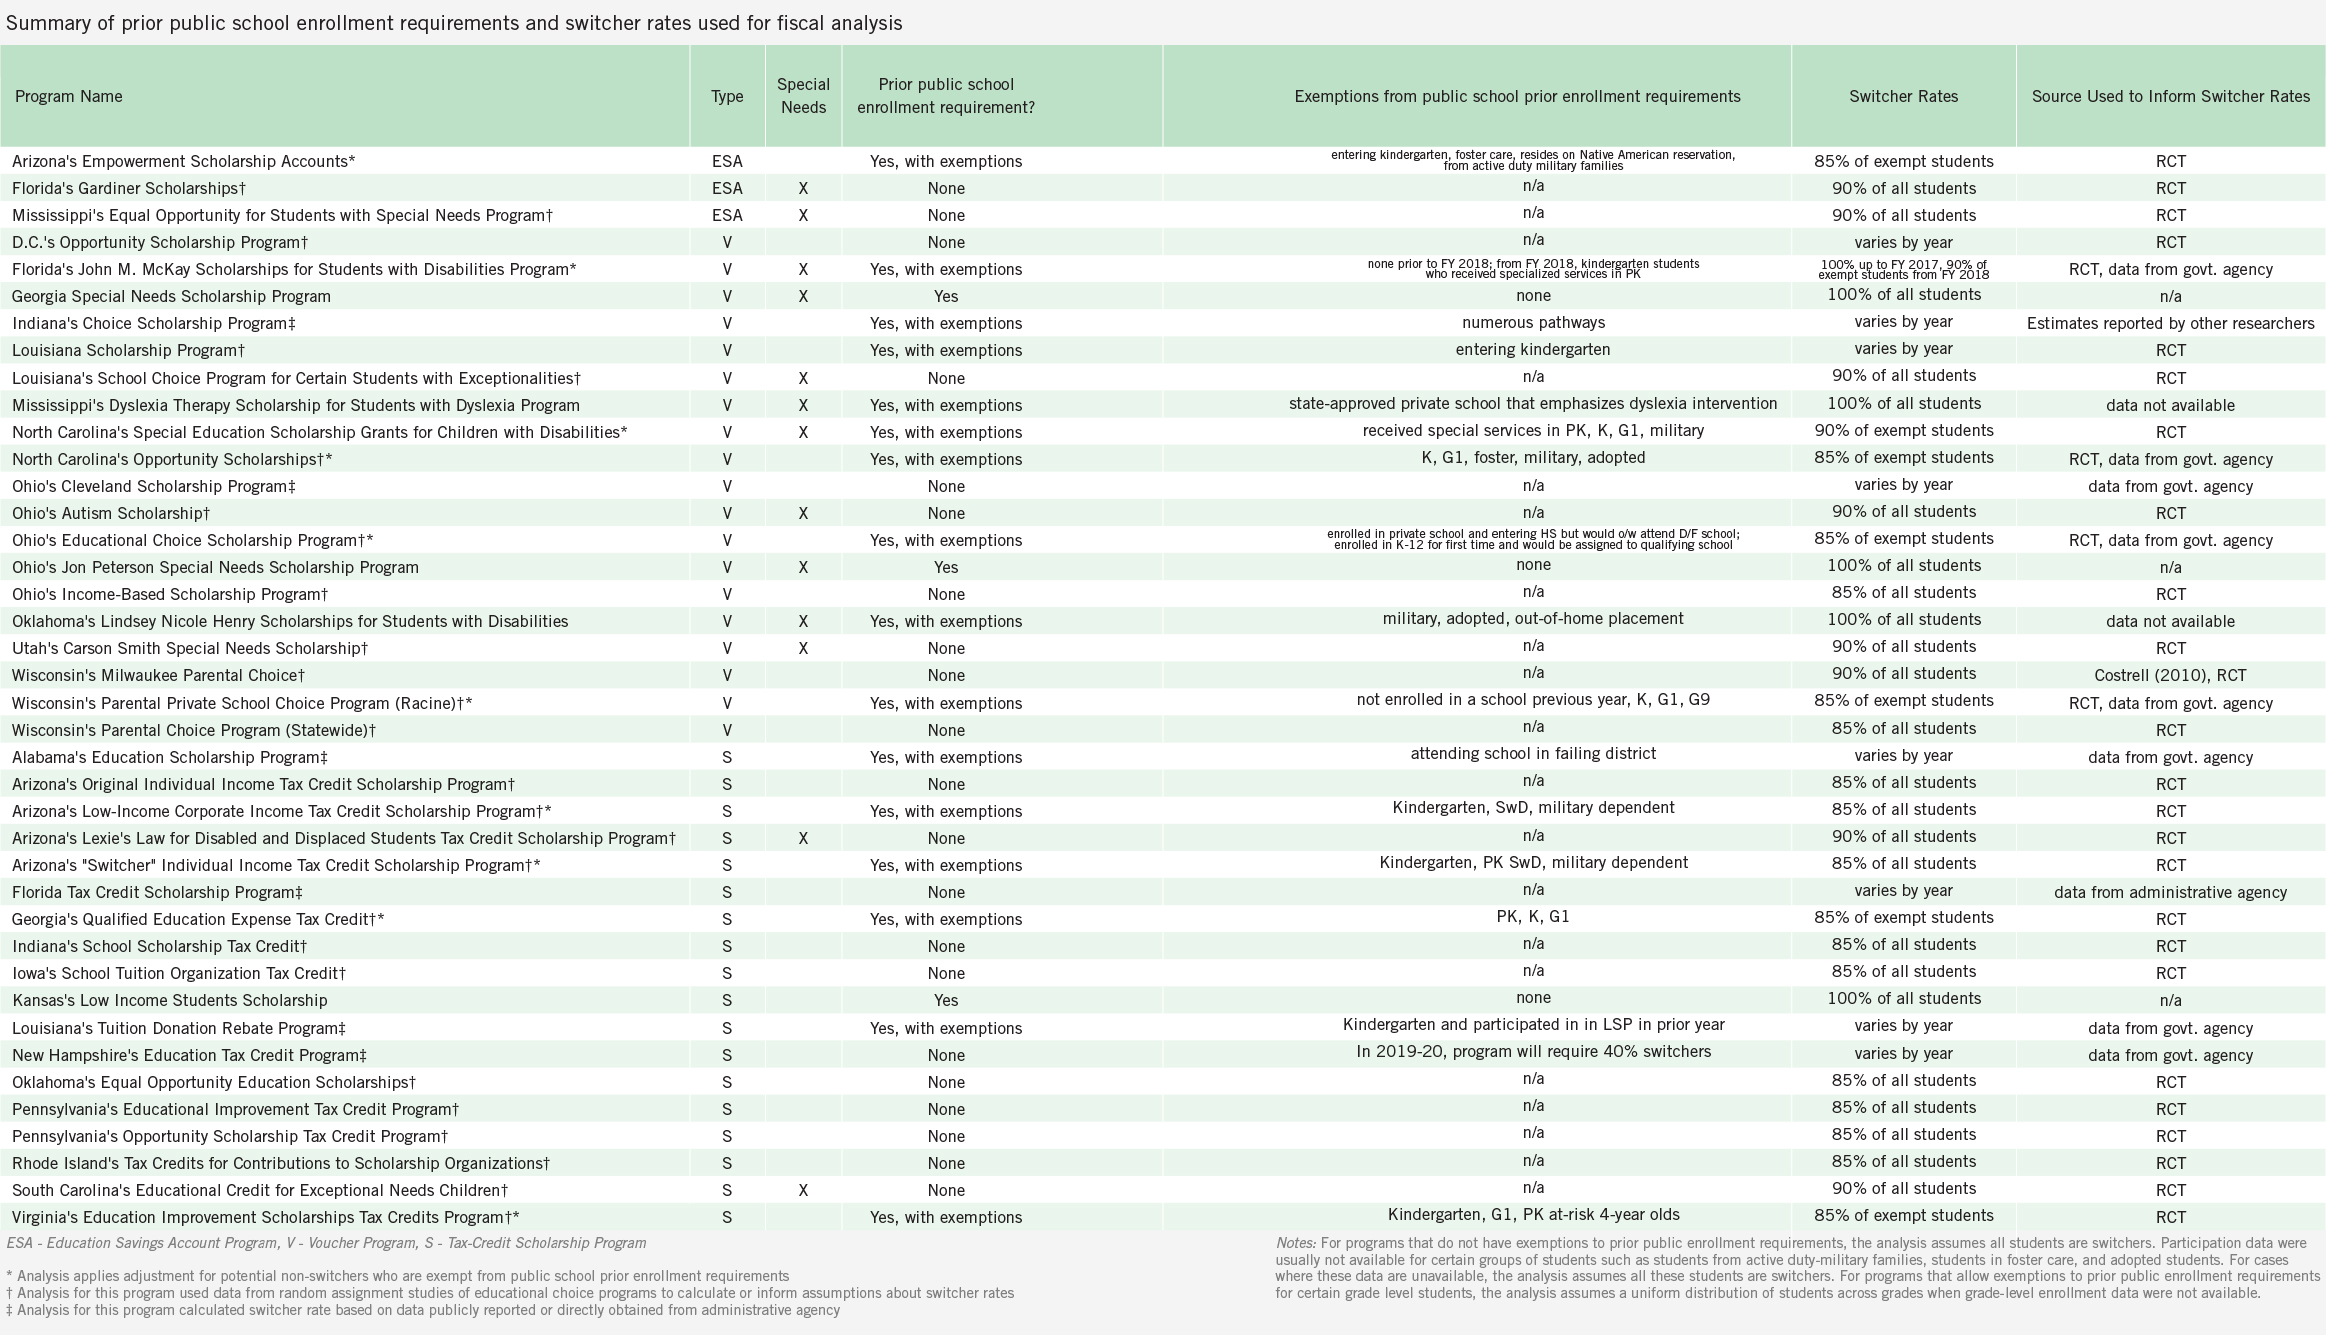
I contacted state government agencies and non-profit organizations involved in the administration of these programs to request information about the types of school settings students were enrolled prior to participating in the program. Many programs require eligible students to have been enrolled in public schools during the previous year, though these requirements vary in the required enrollment duration and groups of students who are exempt from these rules. Examples of students exempt from public school prior-enrollment requirements may include kindergarten, students in foster care, and students from families where parents are active-duty military.
The appendix table includes information about public school prior-enrollment requirements and assumptions for switcher rates used in the analysis. For programs with public school prior-enrollment requirements for eligibility without any exceptions, the analysis assumes all students participating in the program are switchers. For programs with exceptions to these rules, the analysis assumes 85 percent to 90 percent of exempt students are switchers, where the 85 percent adjustment is applied to non-special needs programs and 90 percent is used for special needs programs.17
If a program has no prior enrollment requirements or exemptions to these requirements and prior enrollment data were not available, the analysis cautiously assumes an 85 percent switcher rate. This assumption is based on a survey of random assignment studies which analyzed information from random assignment studies of private school voucher programs to infer switcher rates.18
Break-even Switcher Rate
The overall break-even switcher rate (BER) gives the percentage of students participating in an educational choice program who must be switchers for the program to be fiscally neutral. It is the rate that balances the program’s costs with savings.19 By setting NFE equal to zero in (3), the break-even switcher rate is simply the ratio of the average cost of the program to the average variable cost per student:
BER = C / AVC
A program generates net savings in the short run if the switcher rate is greater than BER. If the switcher rate is less than BER, then the program results in net costs. Here’s an example. If the average voucher amount is $10,000 and the average variable cost to educate a student in public schools is $15,000, the break-even switcher rate is 67 percent (=$10,000/$15,000). Thus, as long as more than two-thirds of students using the program are switchers, then the program saves taxpayers money.
Students with Special Needs
Thirteen educational choice programs included in the analysis are open exclusively to students with special needs. For the programs that do not have prior public school enrollment requirements, the present analysis assumes that 90 percent of students participating in educational choice programs for students with special needs are switchers. Given the disadvantaged background and higher education costs of students with special needs, it’s likely that a high proportion of are switchers. The 90 percent assumed switcher rate is lower than that used in previous analyses, where all students participating in special needs choice programs were assumed switchers.20 This assumed rate lies within the range of switcher rates observed in lottery-based studies of programs serving non-special needs student populations, this assumption is likely cautious.
Relative to the general student body, the costs for serving students with special needs can vary dramatically depending on the severity of their disabilities. This creates a unique challenge to estimating fiscal effects for programs that serve special needs students.21
To estimate average total per-pupil costs for students with special needs, the analysis applies a factor of 1.91 to the per-pupil current expenditures for all students in the public K–12 school system.22 The analysis assumes that educational costs for children with autism or multiple disabilities is 3.00 times the state’s average per-pupil current expenditures.23
Variable costs are also higher for special needs students than variable costs for students without special needs. Information on staffing for special education suggests that the variable cost rate for students with special needs is likely higher than the variable cost rate for students without special needs.
Data on the number of children that receive special education services and personnel that provide special education services under Part B of the Individuals with Disabilities Education Act (IDEA) were obtained from the U.S. Department of Education. The child-to-staff ratio for students with special needs in school year 2017–18 was 6.0. This ratio is lower than the 7.7 ratio of overall number of pupils per public school employee.24 This difference is indicative of the resources required to provide an adequate education for the population of special needs children and suggests that students with special needs have 30 percent more personnel than the typical student in the public school system. The analysis adjusts the overall variable cost rate upwards by 30 percent to generate variable cost estimates for students with special needs.
Students enrolled in in choice programs represent a diverse group of children with significantly varying needs for educational services. Thus, one limitation of the analysis is its reliance on state-level data to estimate educational costs. It follows that if the group of students using special needs vouchers are, on average, less disabled than the statewide distribution, then savings may be overestimated. Conversely, if the distribution of disabilities of students with special needs participating in an educational choice program skews toward more severe disabilities, then savings may be underestimated.
Overall Results
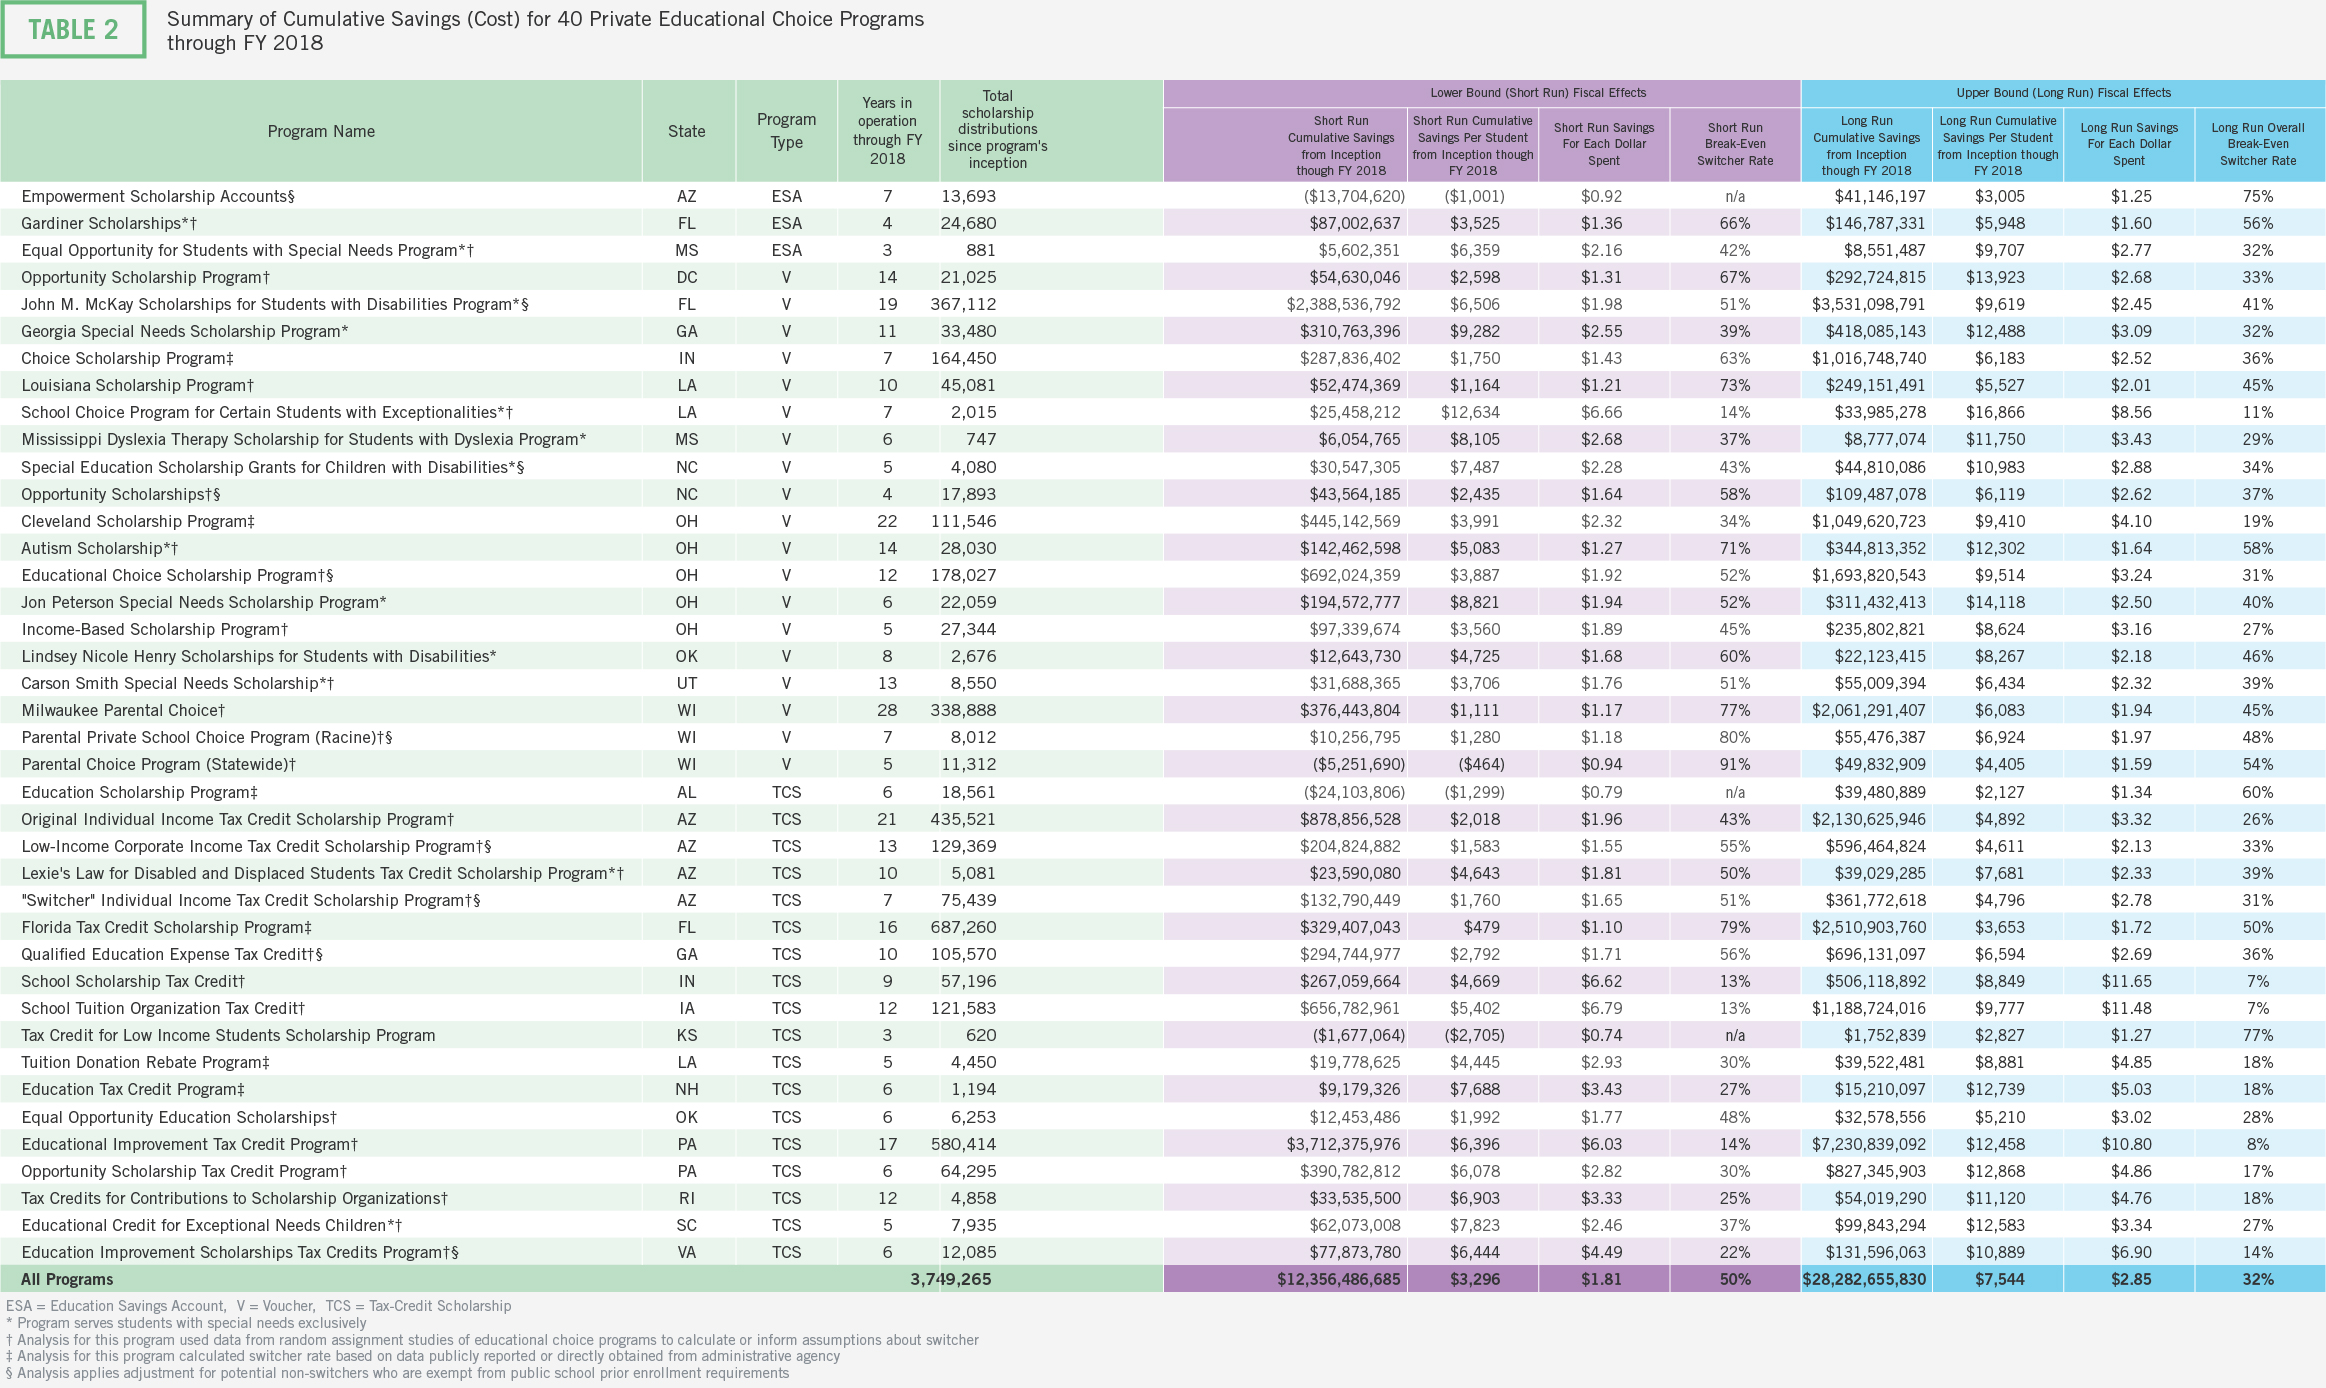
Table 2 shows the lower bound (short-run) and upper bound (long-run) estimates of the fiscal effects of the 40 educational choice programs studied. Based on lower bound estimates, most programs saved money. Based on upper bound estimates, all educational choice programs save taxpayers money. While the fiscal effects likely lie somewhere between the lower and upper estimates, results show that choice programs operating today produce substantial fiscal benefits for state and local taxpayers.
Lower bound estimates indicate that through FY 2018, educational choice generated at least $12.4 billion ($3,300 per student) in short-run cumulative net fiscal benefits for state and local taxpayers. For each dollar spent, programs generated at least $1.81 in net fiscal benefits. On average, for programs to produce net fiscal savings, at least 50 percent of students would need to be switchers.
Upper bound estimates indicate that programs generated up to $28.3 billion in cumulative net fiscal benefits for state and local taxpayers through FY 2018 (or up to $7,500 per student). Each dollar spent on choice programs generated up to $2.85 in net fiscal benefits for state and local taxpayers. On average, for programs to produce net fiscal savings, at least 32 percent of students would need to be switchers.
While most educational choice programs produce net fiscal savings in the short run, these fiscal effects differ across programs and across states. Lower bound estimates for four programs suggest estimated net cumulative costs in the short run. Three of these programs (Alabama’s program, Arizona’s ESA program, and Wisconsin’s statewide voucher program), however, have also been in operation for at least five years, respectively, suggesting that the actual fiscal effects are closer to the upper bound estimates.25
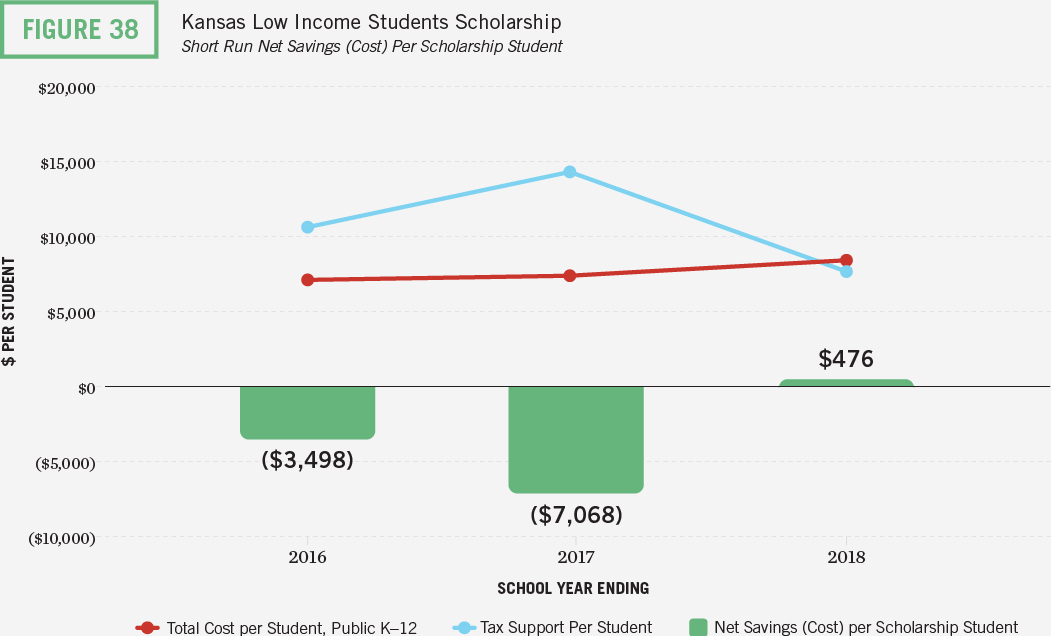
While Kansas’s tax-credit scholarship program generated an estimated small net cost for taxpayers during the program’s first three years, upper bound estimates suggest that the program will generate savings for Kansas taxpayers the longer the program operates.26 Another analysis of this program suggests that some programs may need more than three years to generate positive returns.27 Based on short-run fiscal effects estimates from that analysis, the program broke even by Year 4 and generated cumulative net fiscal savings by Year 5 estimated at $1.7 million, or $1,150 per scholarship student.28
Although Arizona’s ESA program and Wisconsin’s statewide voucher program also indicate net short-run costs, these states operate multiple educational choice programs (the analysis includes five programs in Arizona and three in Wisconsin). For these two states, lower bound estimates indicate that the net cumulative fiscal effects of their choice programs combined are positive, suggesting that educational choice overall is generating net savings for taxpayers even in the short run.
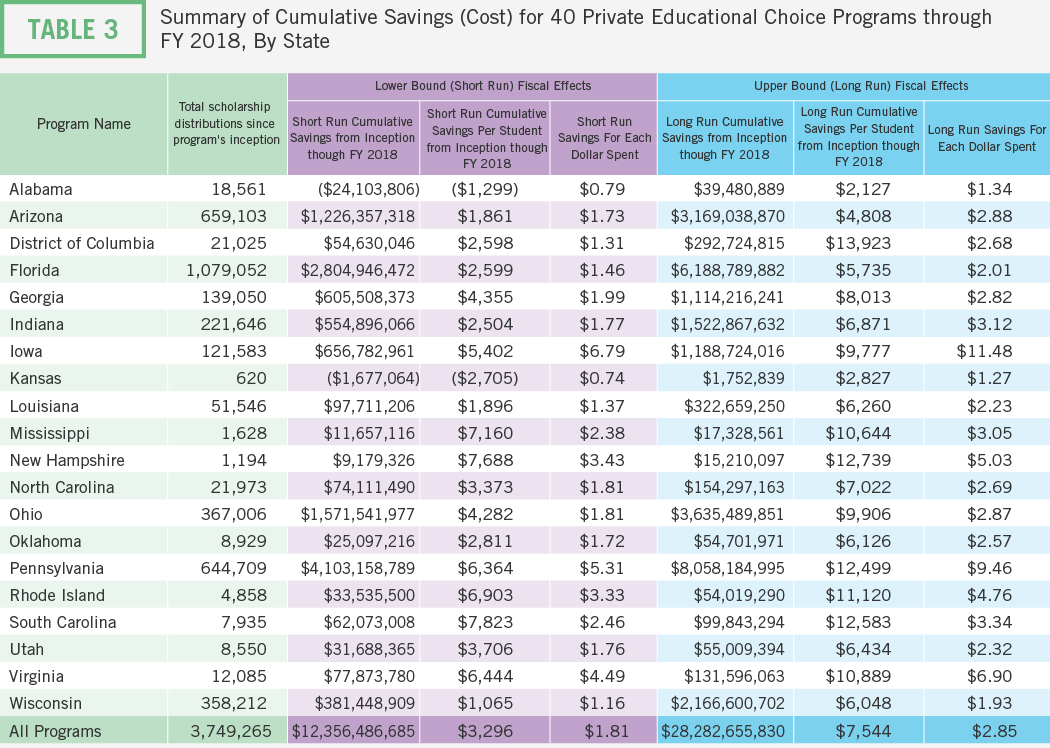
Table 3 aggregates fiscal effects estimates by state. Eleven of the 20 states in the study operate multiple educational choice programs. Overall, programs generated cumulative net fiscal benefits for 18 of the 20 states in the study. Alabama and Kansas, each with one tax-credit scholarship program, incurred small cumulative net costs overall in the short run from their programs through FY 2018.
Appendix Table 2 and Appendix Table 3 aggregates the fiscal effects by program years in operation and by program type.
Discussion
The distribution of fiscal effects across different taxpayers and school districts represents a complex question beyond the scope of this analysis.29 Under a system of fair school funding, where every public dollar follows a child to an educational setting of their family’s choosing, a choice program will be fiscally neutral for public schools and taxpayers in the long run overall. Most public school systems, however, allow districts to retain a portion of the per-student funding for students they no longer educate, and all students in choice programs receive less funding than they would have generated for their residentially assigned public school. Because the per-student cost of educational choice programs is significantly below the per-student cost of public school systems, choice programs generate net fiscal benefits overall when students choose to switch from public schools into the program.
Although this report focuses on the direct fiscal effects of choice program on taxpayers, programs provide potential indirect fiscal effects as well. For example, some research suggests that choice programs reduce crime, teen pregnancy, adolescent suicide rates, and mental health issues as adults.30 In light of these social benefits, this report’s fiscal effects estimates likely understate the total fiscal savings for taxpayers. Moreover, choice programs may keep some private schools open. If any private schools would close without choice programs in place, then many displaced students who are mostly private pay would likely migrate to the public schools and create a significant fiscal burden for taxpayers. Students participating in choice programs and students who remain in public schools also accrue benefits such as improvements in academic achievement, gains in learning, and improved civic outcomes.31 These benefits likely yield economic benefits for society, though the present analysis would not capture these benefits for taxpayers.
Conclusion
This report provides contextual information to help understand the fiscal effects of educational choice programs on taxpayers. As taxpayers pay both state and local taxes, the analysis estimates the fiscal effects of state and local taxpayers combined.
The report generates lower bound and upper bound estimates of the fiscal effects of educational choice programs on taxpayers through FY 2018. Programs generated net fiscal savings for taxpayers estimated between $12.4 billion and $28.3 billion (or between $3,300 and $7,500 per student participant). Taxpayers experienced between $1.80 and $2.85 in fiscal benefits for each dollar spent on choice programs.
The results from this fiscal analysis should not be surprising given that educational choice programs are funded at a significantly lower public expense than public school systems. While educational choice programs enroll just 2.3 percent of publicly funded K-12 students overall, these programs receive just 1.0 percent of total public spending. These basic facts provide important context for evaluating arguments that private educational choice programs harm students who remain in district schools.
Given this context, it is difficult to see how expanding educational opportunities for families via educational choice programs could harm public school systems fiscally. To be sure, many studies have examined educational choice programs’ effects on students enrolling in nearby public schools. Nearly all find that students who remain in district schools experience modest and positive gains in learning. Contrary to claims that students in district schools are harmed by increasing educational choice, the evidence suggests otherwise.
Fiscal Effects By Program
Alabama
PROGRAMS INCLUDED IN ANALYSIS
1. Alabama Education Scholarship Program
FISCAL EFFECTS SINCE INCEPTION OF PROGRAMS THROUGH FY 2018
Short Run Cumulative Net Savings (Cost): ($24.1 million)
Short Run Cumulative Net Savings (Cost) Per Student: ($1,299)
Short Run Savings for Each Dollar of Program Expenditure: $0.79
Long Run Cumulative Net Savings (Cost): $39.4 million
Long Run Cumulative Net Savings (Cost) Per Student: $2,127
Long Run Savings for Each Dollar of Program Expenditure: $1.34
EDUCATION SCHOLARSHIP PROGRAM
Plan parameters described below were in effect during FY 2018, the latest year in the analysis, and may not reflect provisions currently in place.
The Alabama Education Scholarship Program is a tax-credit scholarship program that disburses tax credits to taxpayers for donations to nonprofit scholarship-granting organizations (SGOs). SGOs determine the amount for scholarships. Scholarship awards may not exceed the lesser of private school tuition or $6,000 for grades K-5, $8,000 for grades 5-8, and $10,000 for grades 9-12.
Students are eligible to receive scholarships if they are below age 19 and qualify for the federal free and reduced-price lunch (FRL) program. Students may continue to participate in the program as long as their family’s income does not exceed 275 percent of the federal poverty level.
The program gives first priority to public and private school students assigned to failing schools. The state defines failing public schools if it is designated as failing by the state Superintendent of Education or if the school does not exclusively serve a special population of students and falls in the bottom 6 percent of public K–12 schools on the state’s standardized reading and math assessments.
If an SGO has scholarship funds unaccounted for on July 31 of each year, scholarships may be made available to eligible students in public school, regardless of whether their assigned public school is considered failing.
No more than 25 percent of first-time scholarship recipients to have already been enrolled in a private school the previous year. This rule implies a minimum switcher rate of 75 percent for the program each year. To estimate switcher rates, the analysis uses publicly reported information on the number of first-time scholarship recipients who were continuously enrolled in private school before entering the program.
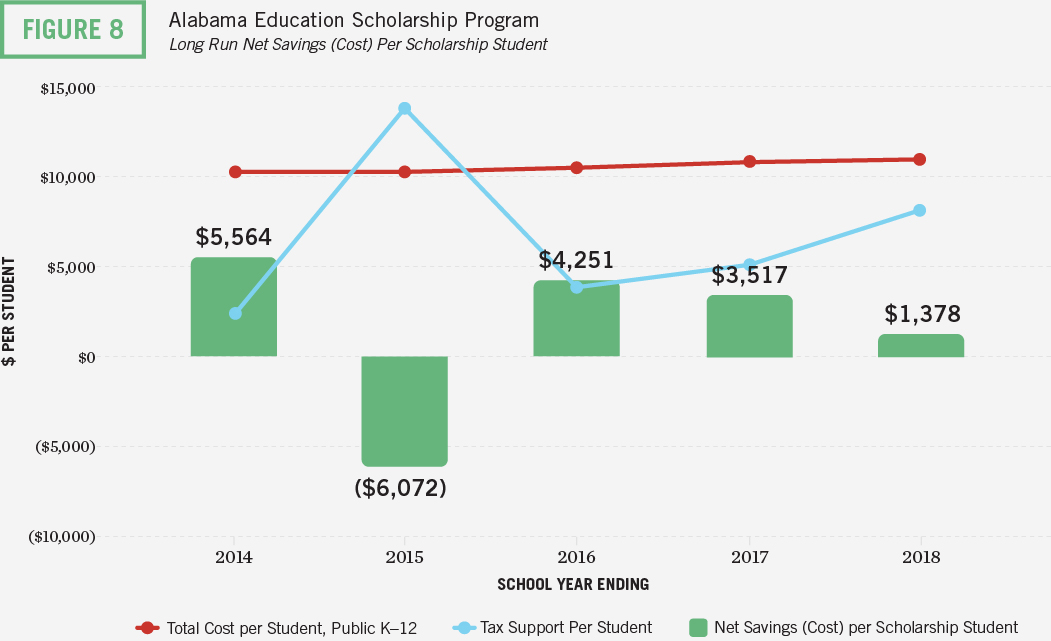
The program’s first year was unusual given the disparity between the large amount of tax credits disbursed for donatiosns and the small number of students participating in the program. This large imbalance differs from what we observe in tax-credit programs operating in other states. As a result, the program is one of just a few programs where the analysis estimated net fiscal costs in the short run.
Fiscal Disparity for Education Scholarship Program
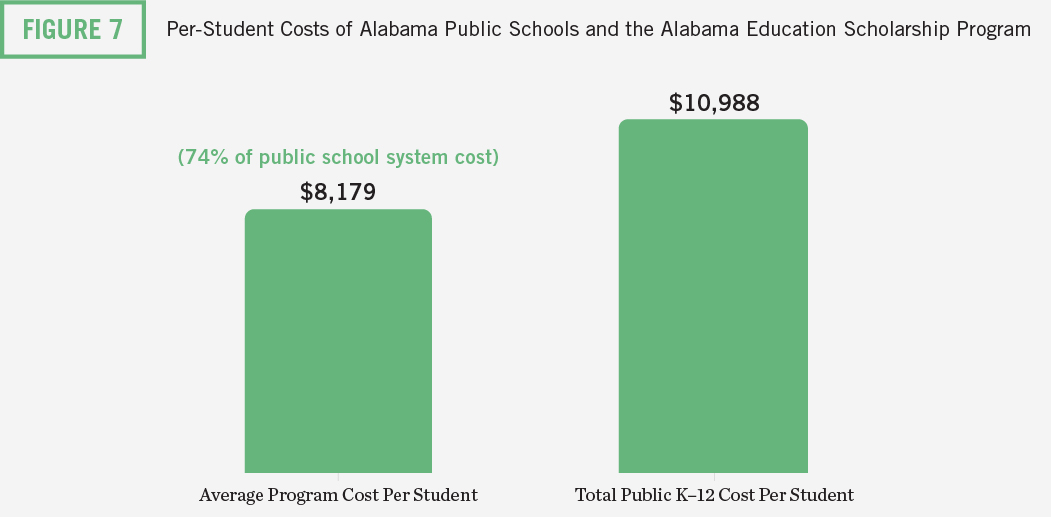
In Alabama, the estimated total cost of public schools per student in FY 2018 was $10,988 and the estimated average variable cost per student was $6,545. The average amount of tax credit disbursements was $8,179, or 74 percent of the total per-student cost for the public school system. The average per-student cost of the program is greater than the average per-student variable cost and indicates that that the program is generating a cost for taxpayers and school districts when students leave the public school system.
Fiscal Impact
Because the program has been in operation for six years, fiscal effects are likely closer to the upper bound estimates.
Lower bound estimates: Lower bound estimates suggest that in the short run, the Education Scholarship Program generated a cumulative net fiscal cost for Alabama taxpayers of $24 million, or $1,300 for each scholarship student through FY 2018. Put another way, for each dollar spent on the program, state and local taxpayers experienced $0.79 in cumulative savings. To save taxpayer dollars in the short run, over 90 percent of students would have to be switchers from public schools.
Upper bound estimates: Upper bound estimates suggest that in the long run, the Education Scholarship Program’s existence through FY 2018 saved Alabama taxpayers $39 million, or about $2,100 for each scholarship student. Put another way, for each dollar spent on the program, state and local taxpayers would experience $1.34 in cumulative savings. To save taxpayer dollars in the long run, over 60 percent of students would have to be switchers from public schools.
Arizona
PROGRAMS INCLUDED IN ANALYSIS:
1. Arizona Empowerment Scholarship Accounts
2. Arizona Original Individual Income Tax Credit Scholarship Program
3. Arizona Low-Income Corporate Income Tax Credit Scholarship Program
4. Arizona Lexie’s Law for Disabled and Displaced Students Tax Credit Scholarship Program
5. Arizona “Switcher” Individual Income Tax Credit Scholarship Program
FISCAL EFFECTS SINCE INCEPTION OF PROGRAMS THROUGH FY 2018
Short Run Cumulative Net Savings (Cost): $1.2 billion
Short Run Cumulative Net Savings (Cost) Per Student: $1,861
Short Run Savings for Each Dollar of Program Expenditure: $1.73
Long Run Cumulative Net Savings (Cost): $3.2 billion
Long Run Cumulative Net Savings (Cost) Per Student: $4,808
Long Run Savings for Each Dollar of Program Expenditure: $2.88
EMPOWERMENT SCHOLARSHIP ACCOUNTS
Plan parameters described below were in effect during FY 2018, the latest year in the analysis, and may not reflect provisions currently in place.
Launched in 2011, Arizona’s Empowerment Scholarship Accounts (ESA) program is the first education savings account program started in the United States. It allows parents to withdraw their children from district or charter schools and receive a portion of their public funding deposited into an account with defined, but multiple, uses, including private school tuition, online education, private tutoring or future educational expenses.
To be eligible for the program, students must have previously attended a public school for at least 100 days or are eligible to enroll in kindergarten. They must also meet one of the following criteria:
• received a scholarship from a school tuition organization (STO) under Lexie’s Law,
• attended a “D” or “F” letter-grade school or school district,
• been adopted from the state’s foster care system,
• is already an ESA recipient, or
• live on a Native American reservation.
Children of parents who are legally blind, deaf or hard of hearing, and siblings of current or previous ESA recipients are also eligible for the program provided they meet the public school prior enrollment requirement. Children of active-duty military members or whose parents were killed in the line of duty, and preschool children with special needs are exempt from the public school prior enrollment requirement.
Students in households that earn up to 250 percent of poverty will receive ESAs funded at 100 percent of the base for whichever school type the student previously attended (charter or district). All other students in the program receive ESAs funded at 90 percent of the same per-student base funding. Students with special needs receive additional funding depending on the services the student’s disability requires.
In its first year, the ESA program was open solely to students with special needs. In 2015, the program opened up to students in kindergarten, D/F districts, active duty military families, and foster care. The analysis assumes that all students participating in the ESA program are switchers through FY 2014. For 2015 and after, it applies an 85 percent switcher rate to the proportion of students in categories exempt from the public school requirement.
School choice programs that serve students with special needs present a unique challenge for estimating their fiscal effects. Not only are educational costs for students with special higher than the education costs for students without special needs, but the costs for students with special needs vary significantly depending on the severity of students’ disabilities. Therefore, the average variable cost for any group of students using ESAs will be unique to that group and determined by the types/severity of disabilities in that group. Compared to the statewide average variable cost for all students with special needs, the average variable cost for students using ESAs may differ by a little or a lot. The ESA program is designed so that the ESA amounts and the per-student variable costs vary together. Students with severe disabilities can receive larger ESA amounts. As the ESA cost increases, the cost burden relieved from the public school system rises proportionally.
Nearly 60 percent of students participating in the program in FY 2018 were students with special needs. The analysis accounts for the higher cost of serving this group (see the methods section in the main report for details). Within the group of students with disabilities in the ESA program, almost two-thirds either had multiple disabilities or had autism. The analysis also accounts for the higher cost of these groups relative to students with other special needs. We have information about the distribution of students by disability for FY 2016 and FY 2018.i This information allows us to generate more precise estimates for the educational costs for this group of students. The analysis applies the same weights to prior years, although it’s likely the case that the shares of students with and without disabilities, and the distribution of students by disability, were different in earlier years.
The program is open to other students from disadvantaged circumstances who do not have disabilities. While the educational costs for these students will be higher than students without those characteristics due to their disadvantaged circumstances, there is insufficient information to account for these differential costs. As such, the analysis takes a cautious approach by not adjusting estimated educational costs upwards for ESA students without special needs who have other disadvantaged circumstances.
Fiscal Disparity for Empowerment Scholarship Accounts
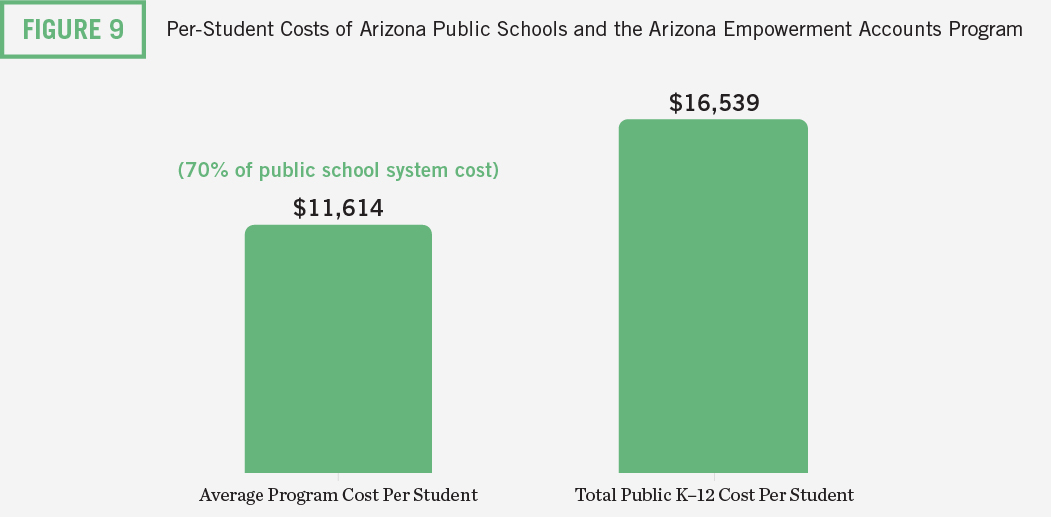
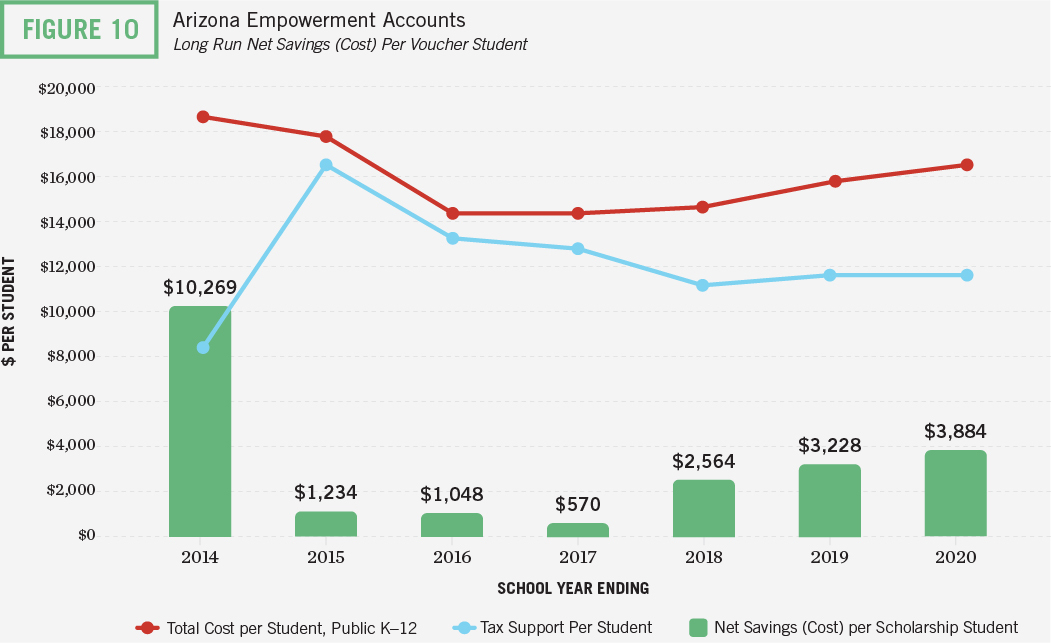
In Arizona, the estimated average total cost of public schools per student for students in the ESA program in FY 2018 was $16,539 and the estimated average variable cost per student for students in the ESA program was $12,078. The average ESA amount was $11,614, or 70 percent of the total per-student cost to educate these students in the public school system. The average per-student cost of the program is lower than the estimated average per-student variable cost and indicates that that the program generates fiscal benefits for taxpayers and school districts when students leave the public school system.
Fiscal Impact
Because the program has been in operation for seven years, fiscal effects are likely closer to the upper bound estimates.
Lower bound estimates: Lower bound estimates suggest that in the short run, the Empowerment Scholarship Accounts generated net costs for Arizona taxpayers of about $13.7 million, or about $1,000 for each ESA recipient through FY 2018. Put another way, for each dollar spent on the program, state and local taxpayers experienced $0.92 in cumulative savings. A break-even point does not emerge in the short run.
Upper bound estimates: Upper bound estimates suggest that in the long run, the Empowerment Scholarship Accounts program’s existence through FY 2018 saved taxpayers $41 million, or about $3,000 for each ESA recipient. Put another way, for each dollar spent on the program, taxpayers would experience $1.25 in cumulative savings. To save taxpayer dollars in the long run, over 75 percent of students would have to be switchers from public schools.
ORIGINAL INDIVIDUAL INCOME TAX CREDIT SCHOLARSHIP PROGRAM
Plan parameters described below were in effect during FY 2018, the latest year in the analysis, and may not reflect provisions currently in place.
Arizona has four tax-credit scholarship programs. The Original Individual Income Tax Credit Scholarship Program is the oldest in the United States and universal in terms of eligibility. Students in grades K–12 or prekindergarten students identified with a disability under the Individuals with Disabilities Education Act or Section 504 of the Rehabilitation Act are eligible for the program. That means all Arizona K–12 students are eligible, regardless of where they enrolled prior to participating in the program and makes the program the most accessible tax-credit scholarship program in the country.
Individuals may make donations to School Tuition Organizations (STOs) and receive a dollar-for-dollar tax credit. For tax year 2017, single filers could claim up to $546, while married couples filing jointly could claim up to $1,092. The maximum amount of credits claimable increases each year per the Consumer Price Index. There is also no limit to the amount of credits granted by state governments. Scholarship amounts are determined by the STOs and are not limited.
Growth in the nation’s oldest tax-credit scholarship program was substantial in the early years of its existence and steady in recent years. It can take a few years before a positive fiscal impact is realized—especially when existing private school students are eligible. In the first two years, the amount of donations to the program were substantially disproportionate to the number of scholarships awarded. Subsequently, the average tax support was quite high in those years, leading to net negative fiscal impacts during those two years. Average tax support normalized by the third year.
To account for the possibility that some students would have enrolled in non-public schools without the program in place, the analysis uses information from lottery-based studies of voucher programs to inform switcher rates.ii Lower bound and upper bound median and weighted average switcher rate estimates were about 85 percent and 90 percent, respectively. The analysis for the Low-Income program cautiously assumes 85 percent for the switcher rate in the program.
Government agencies that report data on the state’s tax-credit scholarship programs disclose the number of scholarships awarded but do not track the number of students participating in the program. These numbers can differ because students may receive more than one scholarship from different SGOs or participate in more than one program. For these reasons, the analysis makes adjustments to account for multi-scholarship students.iii Without these adjustments, the estimated total number of scholarships awarded to students in these programs combined would exceed the total number of students enrolled in private schools.iv
Fiscal Disparity for Original Individual Income Tax Credit Scholarship Program
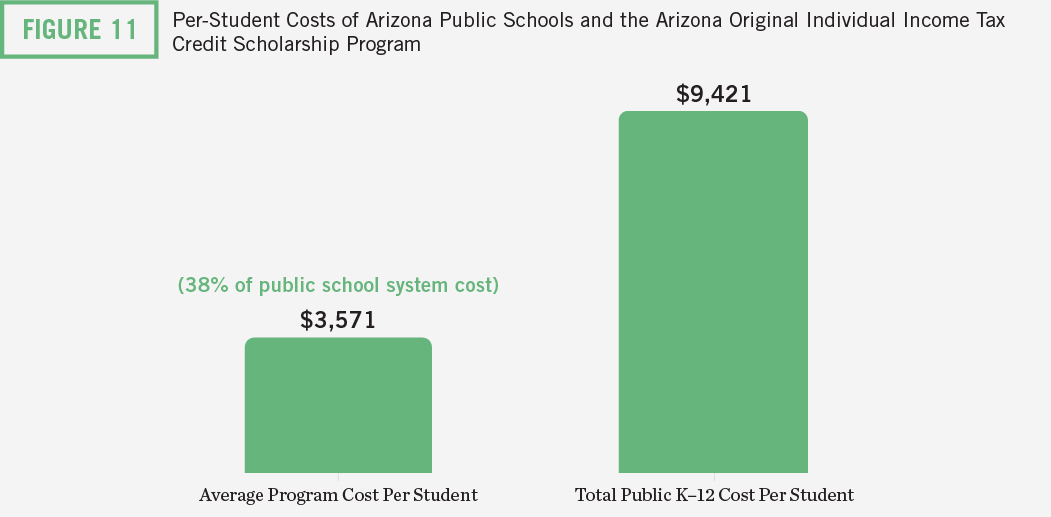
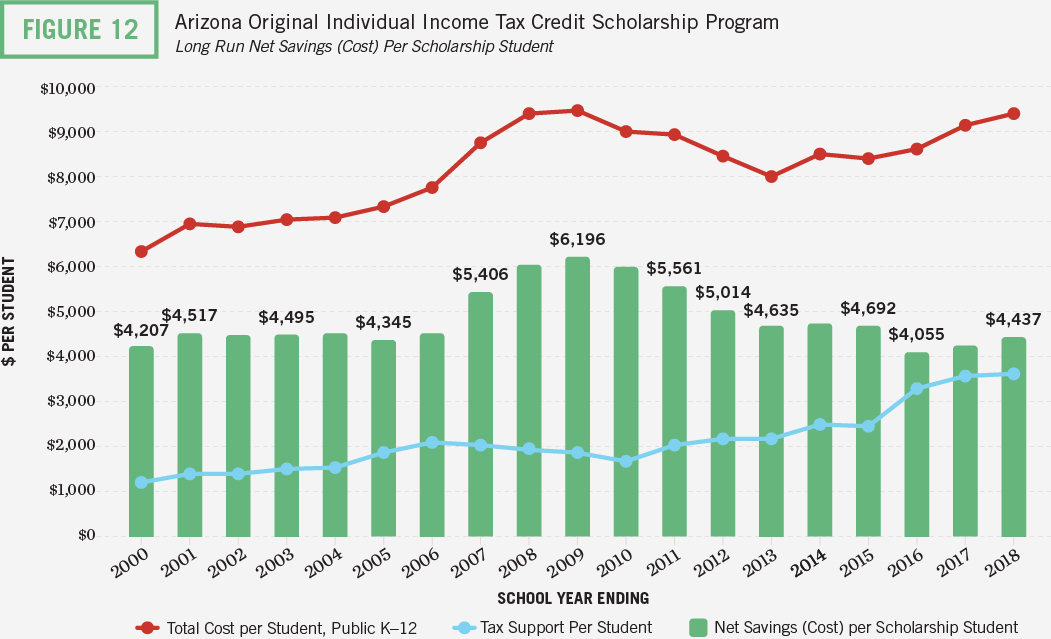
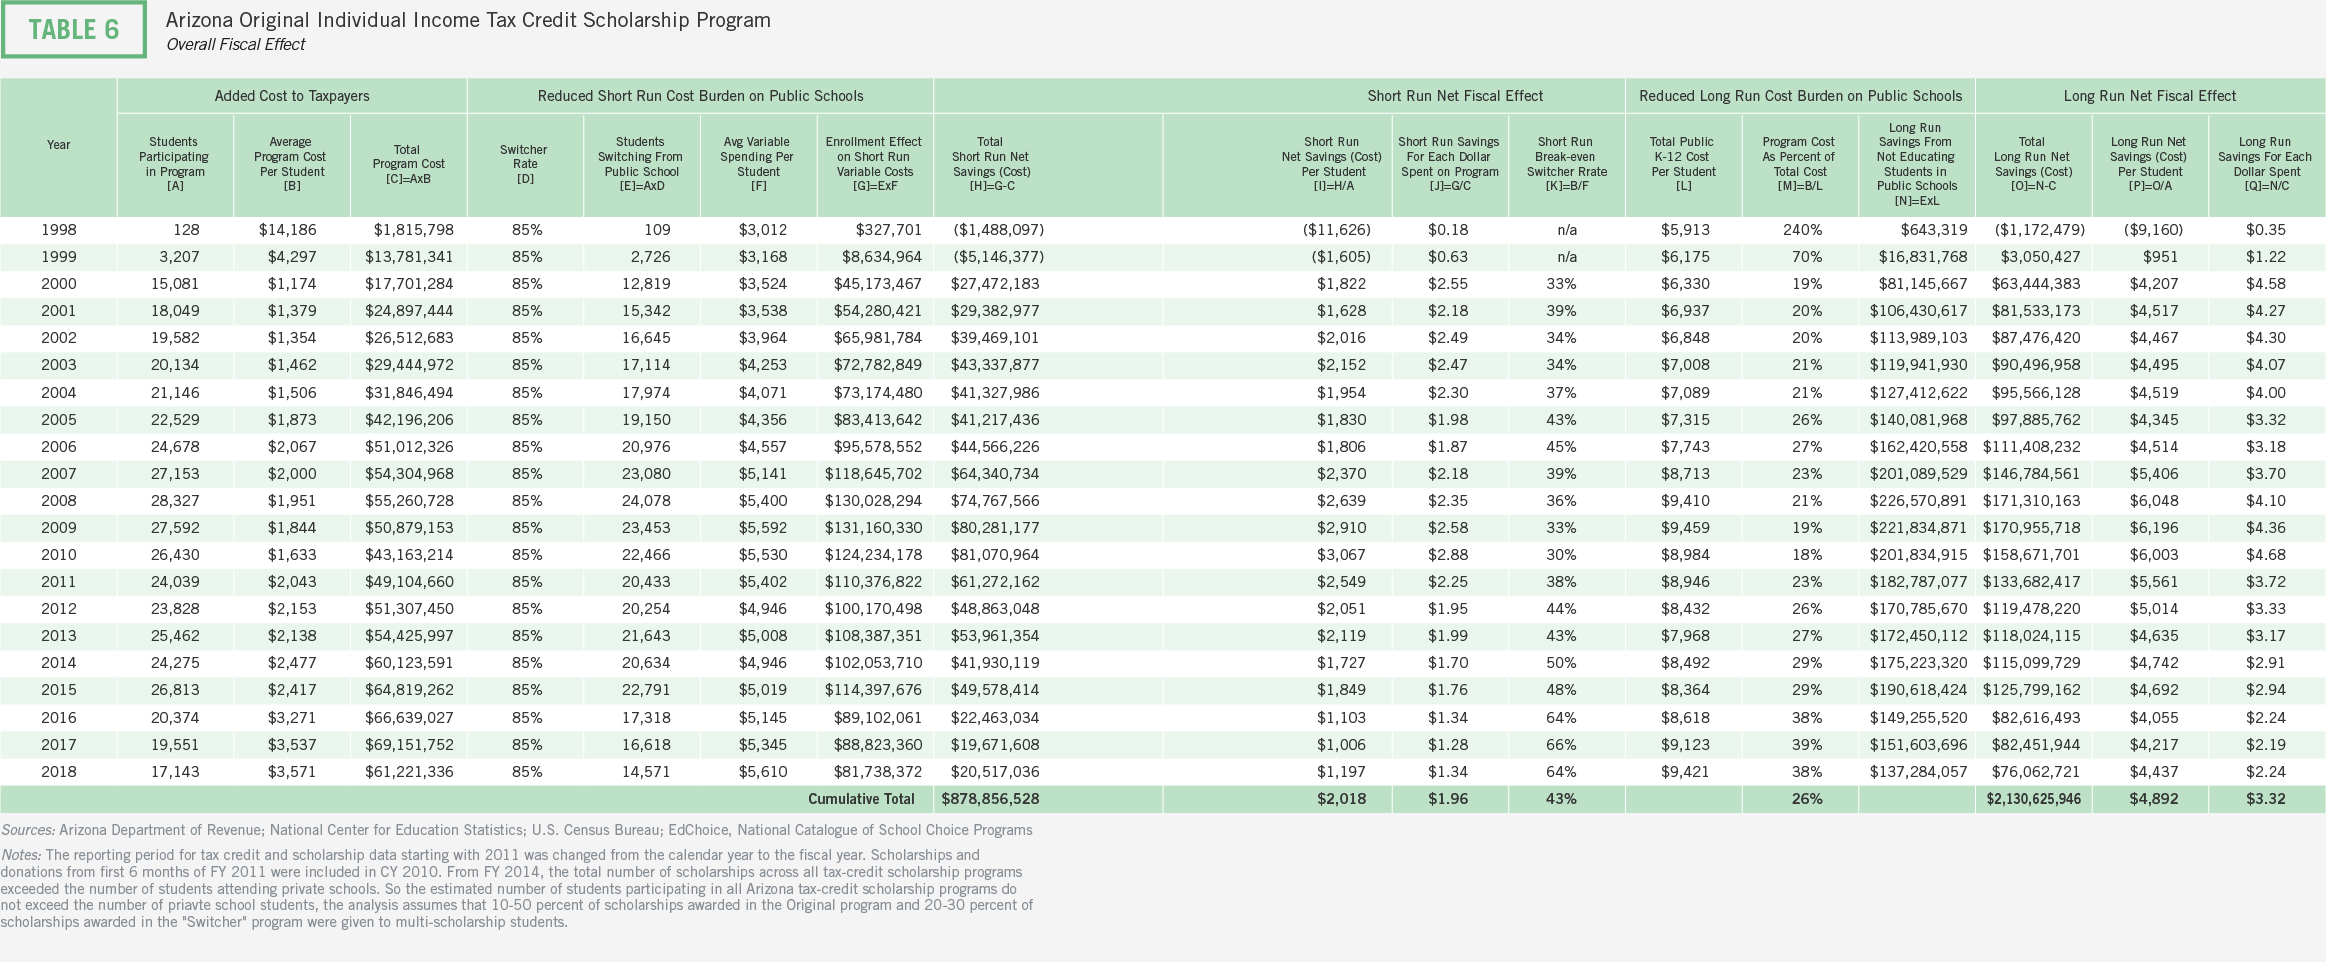
In Arizona, the estimated total cost of public schools per student in FY 2018 was $9,421 and the estimated average variable cost per student was $5,610. The average amount of tax credit disbursements was $3,571, or just 38 percent of the total per-student cost for the public school system. The average per-student cost of the program is significantly less than the average per-student variable cost and indicates that that the program is generating cost savings for taxpayers and school districts when students leave the public school system.
Fiscal Impact
Because the program has been in operation for 21 years, fiscal effects are likely closer to the upper bound estimates.
Lower bound estimates: Lower bound estimates suggest that in the short run, the Original Individual Income Tax Credit Scholarship Program generated $879 million in cumulative net fiscal benefits for Arizona taxpayers, or about $2,000 for each scholarship student through FY 2018. Put another way, for each dollar spent on the program, state and local taxpayers experienced $1.96 in cumulative savings. To save taxpayer dollars in the short run, over 43 percent of students would have to be switchers from public schools.
Upper bound estimates: Upper bound estimates suggest that in the long run, the Original Individual Income Tax Credit Scholarship Program’s existence through FY 2018 saved Arizona taxpayers $2.1 billion, or about $4,900 for each scholarship student. Put another way, for each dollar spent on the program, state and local taxpayers would experience $3.32 in cumulative savings. To save taxpayer dollars in the long run, over 26 percent of students would have to be switchers from public schools.
LOW-INCOME CORPORATE INCOME TAX CREDIT SCHOLARSHIP PROGRAM
Plan parameters described below were in effect during FY 2018, the latest year in the analysis, and may not reflect provisions currently in place.
The Corporate Income Tax Credit Scholarship Program allows STOs to receive donations earmarked for granting scholarships to students from low-income families—up to 185 percent of eligibility for the federal free and reduced-price lunch program. Students must also meet one of the following criteria:
• is enrolled in kindergarten
• is enrolled in a program for students with disabilities
• was previously enrolled in a public school for at least 90 days during the previous year or a full semester during the current school year
• is a dependent of an active-duty member of the military stationed in Arizona
• is a prior recipient of this program or the Individual Tax Credit Program
State governments give tax credits on a dollar-for-dollar basis to corporations making donations to STOs. While there is no limit to how much a corporation may donate to an STO, the maximum tax credits the state could grant in 2018 was $102.5 million. This cap increases annually until 2022-23. The scholarship amount was also capped at $5,300 for grades K–8 and $6,600 for grades 9–12.
Students with special needs are also eligible for this scholarship. To be overly cautious, we assume that no students with disabilities leave public schools to participate in this program. To the extent that some switchers have disabilities, estimated savings will be understated given the higher cost associated with this group.
While prior enrollment in a public school is a requirement for program eligibility, there are notable exceptions to this requirement including kindergarten students, students enrolled in a private school program for students with disabilities, and students who previously participated in the Individual Tax Credit Program. Given these exceptions to the public school prior enrollment requirement, it is possible that some scholarship recipients would enroll in private school even without the program’s financial assistance. It is impossible to know exactly how many students in the program would be switchers, however, and data on prior enrollment are not available.
To account for the possibility that some students would have enrolled in non-public schools without the program in place, the analysis uses information from lottery-based studies of voucher programs to inform switcher rates.v Lower bound and upper bound median and weighted average switcher rate estimates were about 85 percent and 90 percent, respectively. The present analysis cautiously assumes 85 percent for the switcher rate in the program.
Fiscal Disparity for Low-Income Corporate Income Tax Credit Scholarship Program
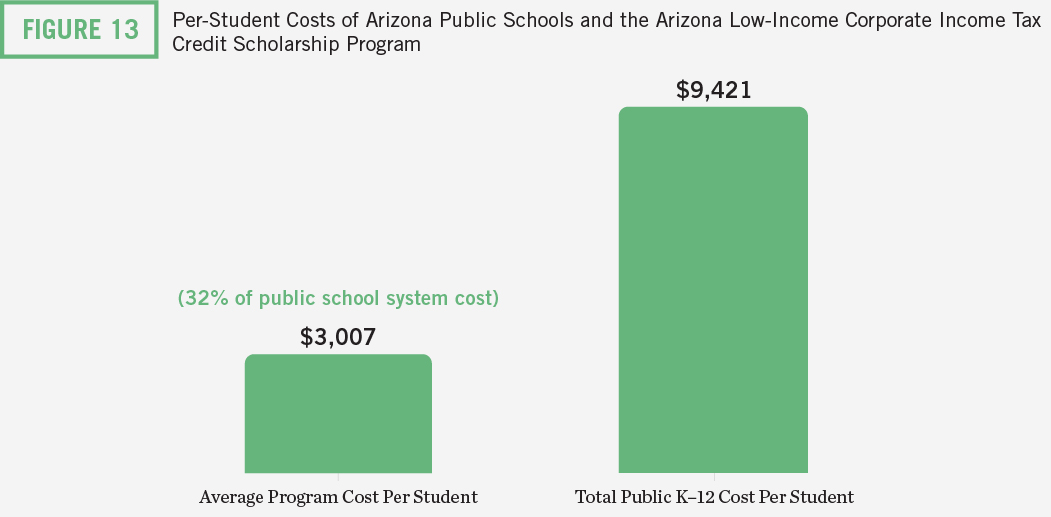
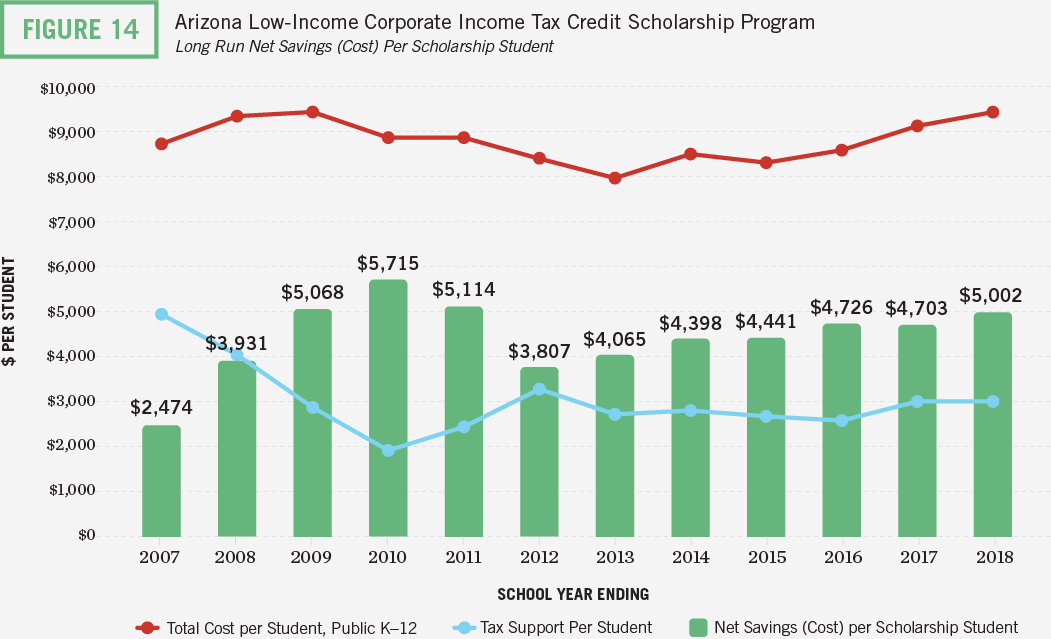
In Arizona, the estimated total cost of public schools per student in FY 2018 was $9,421 and the estimated average variable cost per student was $5,610. The average amount of tax credit disbursements was $3,007, or just 32 percent of the total per-student cost for the public school system. The average per-student cost of the program is less than the average per-student variable cost and indicates that that the program is generating cost savings for taxpayers and school districts when students leave the public school system.
Fiscal Impact
Because the program has been in operation for 13 years, fiscal effects are likely closer to the upper bound estimates.
Lower bound estimates: Lower bound estimates suggest that in the short run, the Low-Income Corporate Income Tax Credit Scholarship Program generated $205 million in cumulative net fiscal benefits for Arizona taxpayers, or about $1,600 for each scholarship student through FY 2018. Put another way, for each dollar spent on the program, state and local taxpayers experienced $1.55 in cumulative savings. To save taxpayer dollars in the short run, over 55 percent of students would have to be switchers from public schools.
Upper bound estimates: Upper bound estimates suggest that in the long run, the Low-Income Corporate Income Tax Credit Scholarship Program’s existence through FY 2018 saved Arizona taxpayers $596 million, or about $4,600 for each scholarship student. Put another way, for each dollar spent on the program, state and local taxpayers experienced $2.13 in cumulative savings. To save taxpayer dollars in the long run, over 33 percent of students would have to be switchers from public schools.
LEXIE’S LAW FOR DISABLED AND DISPLACED STUDENTS TAX CREDIT SCHOLARSHIP PROGRAM
Plan parameters described below were in effect during FY 2018, the latest year in the analysis, and may not reflect provisions currently in place.
Lexie’s Law was enacted to help Arizona children in foster care and children with disabilities receive educational services in a private school. To be eligible, students must have a Multidisciplinary Evaluation Team (MET) or Individualized Education Plan from an Arizona public school district, a 504 plan from an Arizona public school district, or have ever been in the Arizona foster care system.
Scholarships in the Lexie’s Law program are completely funded by donations from corporations. Donors receive a dollar tax credit for each dollar donated to an STO. Though there is no limit on the amount of donations that may be made, the budget for the program is capped at $5 million dollars per year. Scholarship amounts are capped at the lesser of private school tuition or 90 percent of the state funding for a student’s residentially assigned public school.
Although it is possible that some students participating in the program would have enrolled in a non-public school setting without financial assistance from the program, this number is likely to be very small given their disadvantaged background and higher education costs. The analysis takes a very cautious approach by assuming that 90 percent students in the program are switchers. The analysis also accounts for the differential cost of providing services to students with special needs. The methods section in the main report discusses further details.
Fiscal Disparity for Lexie’s Law
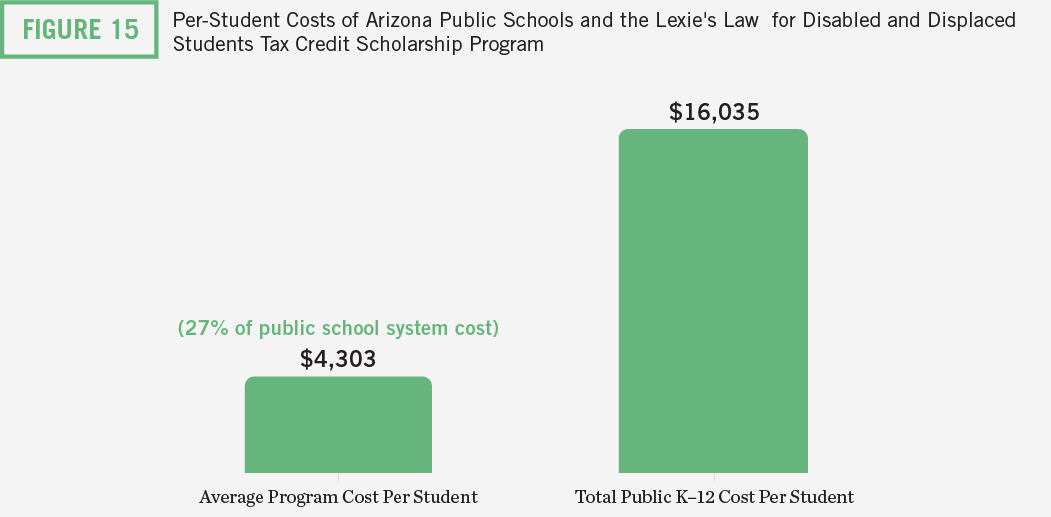
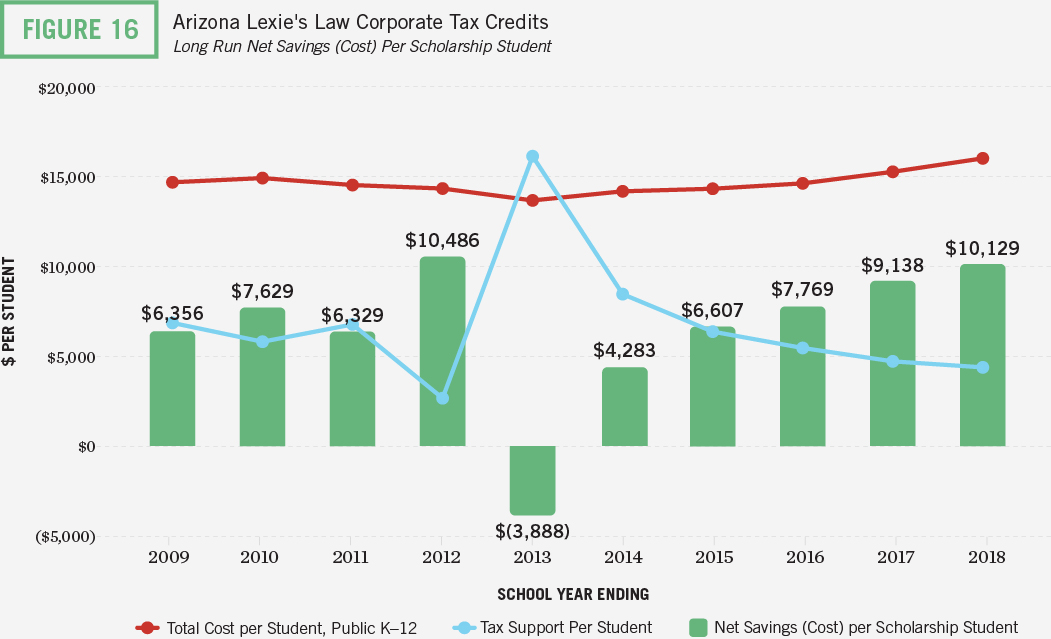
In Arizona, the estimated total cost of public schools per student for students with special needs in FY 2018 was $16,035 and the estimated average variable cost per student for students with special needs was $12,411. The average amount of tax credit disbursements was $4,303, or just 27 percent of the total per-student cost for the public school system. The average per-student cost of the program is significantly less than the average per-student variable cost and indicates that that the program is generating cost savings for taxpayers and the district.
Fiscal Impact
Because the program has been in operation for 10 years, fiscal effects are likely closer to the upper bound estimates.
Lower bound estimates: Lower bound estimates suggest that in the short run, Lexie’s Law generated $24 million in cumulative net fiscal benefits for Arizona taxpayers, or about $4,600 for each scholarship student through FY 2018. Put another way, for each dollar spent on the program, state and local taxpayers experienced $1.81 in cumulative savings. To save taxpayer dollars in the short run, over 50 percent of students would have to be switchers from public schools.
Upper bound estimates: Upper bound estimates suggest that in the long run, Lexie’s Law’s existence through FY 2018 saved Arizona taxpayers $39 million, or about $7,700 for each scholarship student. Put another way, for each dollar spent on the program, state and local taxpayers would experience $2.33 in cumulative savings. To save taxpayer dollars in the long run, over 39 percent of students would have to be switchers from public schools.
“SWITCHER” INDIVIDUAL INCOME TAX CREDIT SCHOLARSHIP PROGRAM
Plan parameters described below were in effect during FY 2018, the latest year in the analysis, and may not reflect provisions currently in place.
The “Switcher” program is the newest of Arizona’s four tax-credit scholarship programs. To be eligible for the program, students must meet one of the following criteria:
• has previously attended a public school for at least a full semester or at least 90 days
• has enrolled in preschool and identified by the school district as having a disability under the Individuals with Disabilities Education Act or Section 504 of the Rehabilitation Act
• enrolled in kindergarten
• has a parent who is an active-duty military member stationed in Arizona
• is a previous recipient of a Low-Income Corporate Income Tax Credit Scholarship or “Switcher” Individual Income Tax Credit Scholarship who have remained in private school
Although the program is not means-tested, STOs must consider financial need when awarding scholarships. Program rules prevent STOs from making decisions based on donor recommendations and individual donors from making contributions earmarked for their own dependents. Moreover, donors may not “trade” donations for their respective dependents.
The “Switcher” program was created as a supplement to the Original Individual Income Tax Credit Scholarship Program for individual taxpayers who claim the maximum credit amount from the Original program. These individuals may subsequently make donations to STOs in the “Switcher” program in return for a dollar-for-dollar tax credit worth up to $546 for single filers and $1,092 for married couples filing jointly in 2018.
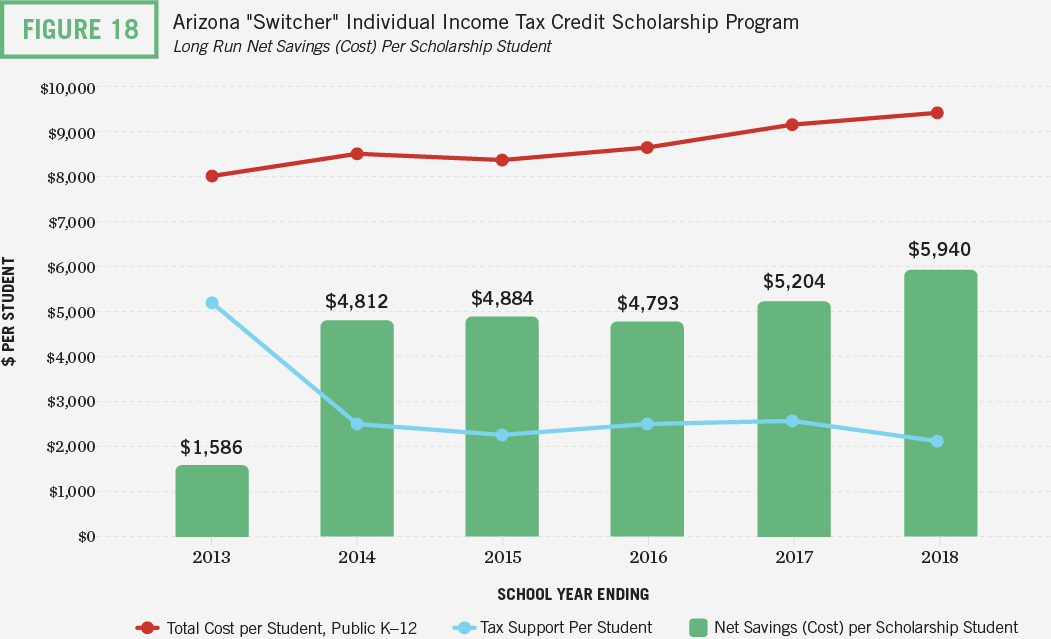
Generally, STOs receive donations from the “Switcher” program late in a calendar year, so they distribute scholarships from those funds in the following year. This lag in receipt versus payout is common. Because of this lag, the amount of donations to the program in the first year was highly disproportionate to the number of scholarships awarded. Subsequently, the average tax support was quite high in these years, leading to net negative fiscal impacts during the first year and a small fiscal benefit in the second year. Average tax support smoothed out from the third year.
While prior enrollment in a public school is a requirement for program eligibility, there are notable exceptions to this requirement including kindergarten students and students who previously participated in the Individual Tax Credit Program. Given these exceptions to the public school prior enrollment requirement, it is possible that some scholarship recipients would enroll in private school even without the program’s financial assistance. It is impossible to know exactly how many students in the program would be switchers, however, and data on prior enrollment are not available.
To account for the possibility that some students would have enrolled in non-public schools without the program in place, the analysis uses information from lottery-based studies of voucher programs to inform switcher rates.vi Lower bound and upper bound median and weighted average switcher rate estimates were about 85 percent and 90 percent, respectively. The analysis for the “Switcher” program cautiously assumes 85 percent for the switcher rate in the program.
Government agencies that report data on the state’s tax-credit scholarship programs disclose the number of scholarships awarded. They do not track the number of students participating in the program. These numbers can differ because students may receive more than one scholarship from different SGOs or participate in more than one program. For these reasons, the analysis makes adjustments to account for multi-scholarship students. These adjustments are necessary to ensure that the estimated total number of scholarship students participating in these programs combined do not exceed the total number of students enrolled in private schools.vii
Fiscal Disparity for “Switcher” Program
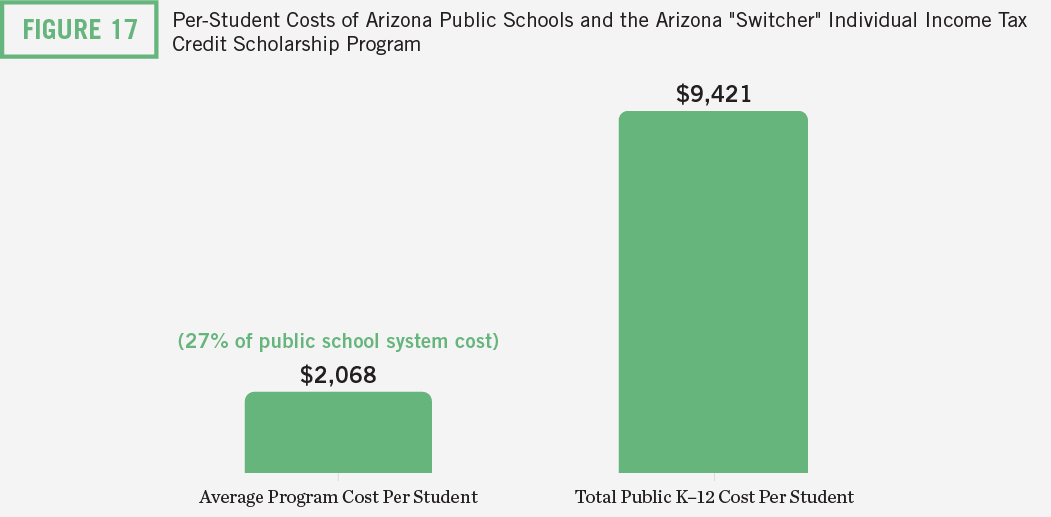
In Arizona, the estimated total cost of public schools per student in FY 2018 was $9,421 and the estimated average variable cost per student was $5,610. The average amount of tax credit disbursements was $2,068, or just 22 percent of the total per-student cost for the public school system. The average per-student cost of the program is less than the average per-student variable cost and indicates that that the program is generating cost savings for taxpayers and school districts when students leave the public school system.
Fiscal Impact
Because the program has been in operation for seven years, fiscal effects are likely closer to the upper bound estimates.
Lower bound estimates: Lower bound estimates suggest that in the short run, the “Switcher” Individual Income Tax Credit Scholarship Program generated $133 million in cumulative net fiscal benefits for Arizona taxpayers, or about $1,800 for each scholarship student through FY 2018. Put another way, for each dollar spent on the program, state and local taxpayers experienced $1.65 in cumulative savings. To save taxpayer dollars in the short run, over 51 percent of students would have to be switchers from public schools.
Upper bound estimates: Upper bound estimates suggest that in the long run, the “Switcher” Individual Income Tax Credit Scholarship Program’s existence through FY 2018 saved Arizona taxpayers $362 million, or about $4,800 for each scholarship student. Put another way, for each dollar spent on the program, state and local taxpayers would experience $2.78 in cumulative savings. To save taxpayer dollars in the long run, over 31 percent of students would have to be switchers from public schools.
i The Goldwater Institute provided these data, which they originally received from the Arizona Department of Education.
ii For a summary, please see: Martin F. Lueken (2020), The Fiscal Impact of K-12 Educational Choice: Using Random Assignment Studies of Private School Choice Programs to Infer Student Switcher Rates, Journal of School Choice, published online 3/4/2020 at https://doi.org/10.1080/15582159.2020.1735863
iii From FY 2014 for each year, the analysis assumes that 10-50 percent of scholarships awarded in the Original program and 20-30 percent of scholarships awarded in the “Switcher” program were given to multi-scholarship students. For fiscal years 2016-2018, estimates for the number of scholarship students are close to 100 percent of the state’s private school enrollment.
iv For instance, in FY 2018 the total combined number of scholarships granted to students participating in any of the 4 programs was 85,175 and nearly doubled the 48,039 total students enrolled in private schools.
v For a summary, please see: Martin F. Lueken (2020), The Fiscal Impact of K-12 Educational Choice: Using Random Assignment Studies of Private School Choice Programs to Infer Student Switcher Rates, Journal of School Choice, published online 3/4/2020 at https://doi.org/10.1080/15582159.2020.1735863
vi For a summary, please see: Martin F. Lueken (2020), The Fiscal Impact of K-12 Educational Choice: Using Random Assignment Studies of Private School Choice Programs to Infer Student Switcher Rates, Journal of School Choice, published online 3/4/2020 at https://doi.org/10.1080/15582159.2020.1735863
vii From FY 2014 for each year, the analysis assumes that 10-50 percent of scholarships awarded in the Original program and 20-30 percent of scholarships awarded in the “Switcher” program were given to multi-scholarship students. For fiscal years 2016-2018, estimates for the number of scholarship students are close to 100 percent of the state’s private school enrollment.
District of Columbia
PROGRAMS INCLUDED IN ANALYSIS:
1. D.C. Opportunity Scholarship Program
FISCAL EFFECTS SINCE INCEPTION OF PROGRAMS THROUGH FY 2018
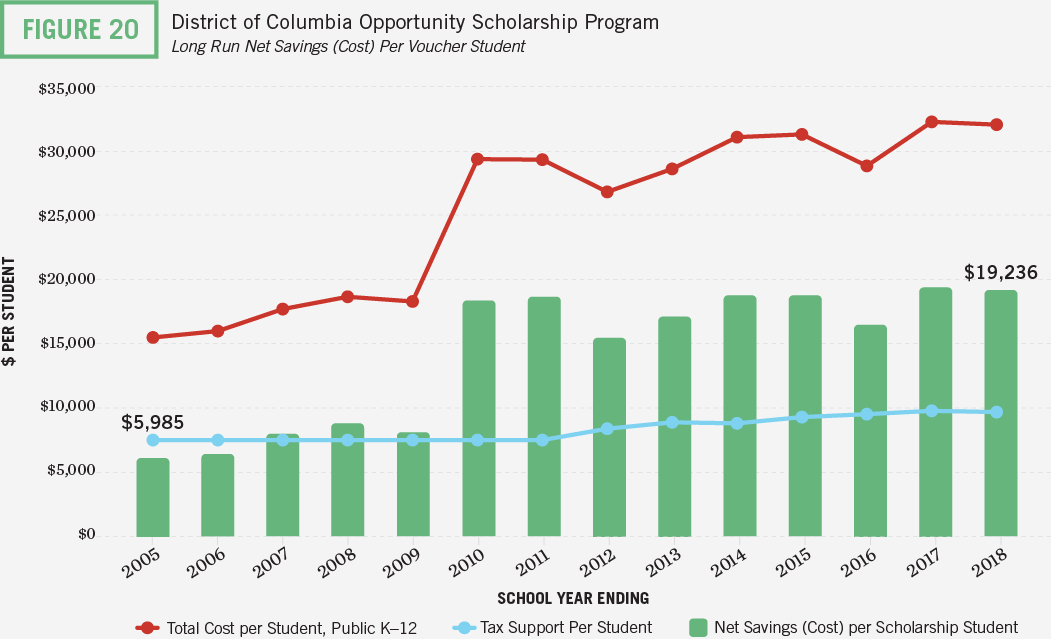
Short Run Cumulative Net Savings (Cost): $54.6 million
Short Run Cumulative Net Savings (Cost) Per Student: $2,598
Short Run Savings For Each Dollar of Program Expenditure: $1.31
Long Run Cumulative Net Savings (Cost): $292.7 million
Long Run Cumulative Net Savings (Cost) Per Student: $13,923
Long Run Savings For Each Dollar of Program Expenditure: $2.68
OPPORTUNITY SCHOLARSHIPS PROGRAM
Plan parameters described below were in effect during FY 2018, the latest year in the analysis, and may not reflect provisions currently in place.
The District of Columbia Opportunity Scholarships Program (DCOSP), authorized by the U.S. Congress in 2004, provides vouchers to low-income students to attend a private school of choice. It is the only federally funded program and is overseen by the U.S. Department of Education. To be eligible for the program, families must be current residents of D.C. and either receive benefits under the Supplemental Nutrition Assistance Program (SNAP) or earn no more than 185 percent of the federal poverty level prior to entering the program. Students may continue to receive vouchers in later years provided their household income does not rise above 300 percent of the poverty level. Students receive priority if they previously attended public schools identified as one of the lowest-performing under the District of Columbia’s accountability system or if they or their siblings already are participating in the program
Through 2011, vouchers were fixed at $7,500 per student. Today, voucher amounts depend on grade level. In 2017–18, students in K–8 may received a voucher worth up to $8,653 while students in grades 9–12 may receive vouchers worth up to $12,981. These amounts are adjusted for inflation each year. The program is authorized at $20 million in available funding, meaning that about 2,000 students would be able to participate in the program, depending on students’ grade levels.
Since its launch, participation in the program has been limited by the amount authorized by Congress. The number of vouchers awarded to students has remained below 2,000 every year.
The analysis accounts for the likelihood that students would enroll in private schools without financial assistance from the program (the switcher rate). While the administrative agency does not collect data on where students were enrolled prior to the program, researchers who evaluated the program reported where children who participated in the program were enrolled prior to receiving a voucher.i A body of lottery-based studies on school voucher programs reports information on switchers specific to the DCOSP.ii Researchers directly observed between 86 percent and 90 percent of students in the control groups, i.e., students who were not awarded a voucher via a lottery, enrolled in public schools during the year they were “lotteried out.”
Fiscal Disparity for Opportunity Scholarships Program
In D.C., the total cost of public schools per student in FY 2018 was $32,098 and the estimated average variable cost per student was $16,504. The average voucher amount was $9,545, or just 30 percent of the total per-student cost for the public school system. The average per-student cost of the program is significantly less than the average per-student variable cost and indicates that that the program is generating cost savings for taxpayers and school districts when students leave the public school system.
Fiscal Impact
Because the program has been in operation for 14 years, fiscal effects are likely closer to the upper bound estimates.
Lower bound estimates: Lower bound estimates suggest that in the short run, the DCOSP generated $55 million in cumulative net fiscal benefits for taxpayers, or almost $2,600 for each voucher recipient through FY 2018. Put another way, for each dollar spent on the program, state and local taxpayers experienced $1.31 in cumulative savings. To save taxpayer dollars in the short run, over 67 percent of students would have to be switchers from public schools.
Upper bound estimates: Upper bound estimates suggest that in the long run, the DCOSP’s existence through FY 2018 saved taxpayers $293 million, or almost $13,900 for each voucher recipient. Put another way, for each dollar spent on the program, taxpayers would experience $2.68 in cumulative savings. To save taxpayer dollars in the long run, over 33 percent of students would have to be switchers from public schools.
i Patrick Wolf, Babette Gutmann, Michael Puma, Brian Kisida, Lou Rizzo, Nada Eissa, and Matthew Carr (2010), Evaluation of the DC Opportunity Scholarship Program: Final Report (NCEE 2010-4018), National Center for Education Evaluation and Regional Assistance, Institute of Education Sciences, U.S. Department of Education, retrieved from https://ies.ed.gov/ncee/pubs/20104018/pdf/20104018.pdf
Ann Webber, Ning Rui, Roberta Garrison-Mogren, Robert B. Olsen, and Babette Gutmann (2019), Evaluation of the DC Opportunity Scholarship Program: Impacts Three Years After Students Applied (NCEE 2019-4006), retrieved from Institute of Education Sciences website: https://ies.ed.gov/ncee/pubs/20194006/pdf/20194006.pdf
ii For a summary, please see: Martin F. Lueken (2020), The Fiscal Impact of K-12 Educational Choice: Using Random Assignment Studies of Private School Choice Programs to Infer Student Switcher Rates, Journal of School Choice, published online 3/4/2020 at https://doi.org/10.1080/15582159.2020.1735863
Florida
PROGRAMS INCLUDED IN ANALYSIS:
1. Florida Gardiner Scholarships
2. Florida John M. McKay Scholarships for Students with Disabilities Program
3. Florida Tax Credit Scholarship Program
FISCAL EFFECTS SINCE INCEPTION OF PROGRAMS THROUGH FY 2018
Short Run Cumulative Net Savings (Cost): $2.8 billion
Short Run Cumulative Net Savings (Cost) Per Student: $2,600
Short Run Savings For Each Dollar of Program Expenditure: $1.46
Long Run Cumulative Net Savings (Cost): $6.2 billion
Long Run Cumulative Net Savings (Cost) Per Student: $5,737
Long Run Savings For Each Dollar of Program Expenditure: $2.01
GARDINER SCHOLARSHIP PROGRAM
Plan parameters described below were in effect during FY 2018, the latest year in the analysis, and may not reflect provisions currently in place.
Florida’s Gardiner Scholarship Program was launched in 2014 and allows students with special needs an opportunity to receive an education savings account (ESA) funded by the state and administered by an approved scholarship funding organization. Parents can use the funds to pay for a variety of educational services, including private school tuition, tutoring, online education, home education, curriculum, therapy, postsecondary educational institutions in Florida and other defined educational services.
Students must have an Individualized Education Plan or have been diagnosed with a qualified disability. Students are also eligible if they are identified as deaf or visually impaired, have had a traumatic brain injury defined by the state board of education, are hospitalized or homebound with a medically diagnosed physical or psychiatric condition for more than six months or are students aged 3, 4 or 5 who are considered “high-risk” due to developmental delay.
Annual funding for the program is specified by the General Appropriations Act ($107.4 million in 2017–18). The ESA amount is a function of grade, county of residence and public school spending for students with disabilities, and ESAs are prorated based on the academic quarter in which the student is deemed eligible for the ESA by a scholarship-funding organization.
Although it is possible that some students participating in the program would have enrolled in a non-public school setting without financial assistance from the program, this number is likely to be very small given their disadvantaged background and higher education costs. The analysis takes a very cautious approach by assuming that 90 percent students in the program are switchers. The analysis also accounts for the differential cost of providing services to students with special needs. The methods section in the main report discusses further details.
Fiscal Disparity for Gardiner Scholarship Program
In Florida, the estimated total cost of public schools per student for students with special needs in FY 2018 was $18,239 and the estimated average variable cost per student for students with special needs was $15,097. The average ESA amount was $10,268, or just 56 percent of the total per-student cost for the public school system. The average per-student cost of the program is significantly less than the average per-student variable cost and indicates that that the program is generating cost savings for taxpayers and school districts when students leave the public school system.
Fiscal Impact
Because the program has been in operation for four years, fiscal effects are likely closer to the lower bound estimates.
Lower bound estimates: Lower bound estimates suggest that in the short run, the Gardiner Scholarship Program generated $87 million in cumulative net fiscal benefits for Florida taxpayers, or about $3,500 for each ESA recipient through FY 2018. Put another way, for each dollar spent on the program, state and local taxpayers experienced $1.36 in cumulative savings. To save taxpayer dollars in the short run, over 66 percent of students would have to be switchers from public schools.
Upper bound estimates: Upper bound estimates suggest that in the long run, the Gardiner Scholarship Program’s existence through FY 2018 saved taxpayers $147 million, or about $6,000 for each ESA recipient. Put another way, for each dollar spent on the program, taxpayers would experience $1.60 in cumulative savings. To save taxpayer dollars in the long run, over 56 percent of students would have to be switchers from public schools.
MCKAY SCHOLARSHIPS FOR STUDENTS WITH DISABILITIES
Plan parameters described below were in effect during FY 2018, the latest year in the analysis, and may not reflect provisions currently in place.
Launched in 1999 and expanded in 2000, Florida’s John M. McKay Scholarships for Students with Disabilities Program allows public school students with disabilities to receive vouchers to attend private schools or other public schools. Vouchers are worth up to the same amount of state funds that public schools would have spent on a participating child, but the amount may not exceed the cost of the private school’s tuition and fees. Parents may supplement vouchers with their own money.
Students who have an IEP or a 504 plan may be eligible for the program provided they enrolled in public school for at least one year or are entering kindergarten. With nearly 30,000 students participating in FY 2020, the McKay program is the second-largest private school choice program and largest special needs program in the nation in terms of the number of students participating.
The program is designed so there is no fiscal impact on the state government. Students participating in the McKay program continue to be counted in their resident public school district’s membership. Thus, the district receives funding for that student according to the state’s funding formula. The district then pays the student’s private school the voucher amount. The fiscal effect is isolated entirely to the public school district. The voucher amount is restricted to the lesser of funding the student generates per the funding formula and tuition and fees at the chosen private school. Districts incur a net benefit if this amount is less than the reduced variable costs.
In FY 2018, the program expanded eligibility to all kindergarten students. Thus, it’s possible that some of these students would have enrolled in a non-public school setting without financial assistance from the program. Although this number is likely to be very small given their disadvantaged background and higher education costs, the analysis makes an adjustment to account for potential non-switchers by cautiously assuming that 85 percent of kindergarten students in FY 2018 were switchers. The analysis also accounts for the differential cost of providing services to students with special needs. The methods section in the main report discusses further details.
Fiscal Disparity for McKay program
In Florida, the estimated total cost of public schools per student for students with special needs in FY 2018 was $18,239 and the estimated average variable cost per student for students with special needs was $15,097. The average voucher amount was $7,104, or just 39 percent of the total per-student cost for the public school system. The average per-student cost of the program is significantly less than the average per-student variable cost and indicates that that the program is generating cost savings for taxpayers and school districts when students leave the public school system.
Fiscal Impact
Because the program has been in operation for 19 years, fiscal effects are likely closer to the upper bound estimates.
Lower bound estimates: Lower bound estimates suggest that in the short run, the McKay program generated $2.4 billion in cumulative net fiscal benefits for Florida taxpayers, or about $6,500 for each voucher recipient through FY 2018. Put another way, for each dollar spent on the program, state and local taxpayers experienced $1.98 in cumulative savings. To save taxpayer dollars in the short run, over 41 percent of students would have to be switchers from public schools.
Upper bound estimates: Upper bound estimates suggest that in the long run, the McKay program’s existence through FY 2018 saved Florida taxpayers an estimated $3.5 billion, or about $9,600 for each voucher recipient. Put another way, for each dollar spent on the program, taxpayers would experience $2.45 in cumulative savings. To save taxpayer dollars in the long run, over 41 percent of students would have to be switchers from public schools.
TAX CREDIT SCHOLARSHIP PROGRAM
Plan parameters described below were in effect during FY 2018, the latest year in the analysis, and may not reflect provisions currently in place.
The Florida legislature enacted and launched the Florida Tax Credit Scholarship Program in 2001. The state government provides tax credits on corporate income taxes and insurance premium taxes for donations made to Scholarship Funding Organizations (SFOs). In turn, SFOs provide scholarships for low-income students and children in foster care. They also provide transportation grants worth up to $500 in FY 2018 for students attending public schools outside of a child’s school district.i
The state gives a dollar-for-dollar tax credit to corporations that make donations to SFOs. In 2017–18, the state limited total credits granted to donors at $699.8 million. Unused credits may be carried forward to the next fiscal year.
Students eligible for participating in the program include those in households earning up to 260 percent of the federal poverty level. Eligible students also include students placed in foster care or out-of-home care and dependents of active-duty military.
Scholarships can be worth up to 96 percent of the state’s unweighted Fulltime Equivalency funding and may not exceed private school tuition and fees. Students who qualify under 200 percent of poverty are eligible for full scholarships worth up to $8,525. Partial scholarships are available with scholarship values reduced by 12 percent to 50 percent if the student comes from a household with an income between 200 percent and 260 percent of the federal poverty level. First priority is given to renewal students and to new students eligible for the federal free and reduced-price lunch program.
Up to 2012, the program required all scholarship recipients be previously enrolled in public school except those in kindergarten and first grade. This rule changed in 2013 so any students in kindergarten up to fifth grade could enroll in the program regardless of prior school enrollment. In 2014, the pre-public school enrollment requirement was removed entirely. Prior program participants from households whose income rises above the income limit can continue to participate in the program under certain circumstances. Eligibility recently opened to siblings of current scholarship recipients, and the income limit for previous scholarship recipients was removed.
To estimate switcher rates for each year, we use data from Step Up for Students on first-year scholarship recipients who were enrolled in private schools and homeschool settings before entering the program. As data were available from 2012, the analysis backfills prior years with the same rate estimated for 2012.
Fiscal Disparity for Florida Tax Credit Scholarship Program
In Florida, the estimated total cost of public schools per student in FY 2018 was $10,610 and the estimated average variable cost per student was $6,755. The average amount of tax credit disbursements was $6,465, or 61 percent of the total per-student cost for the public school system. The average per-student cost of the program is less than the average per-student variable cost and indicates that that the program is generating cost savings for taxpayers and school districts when students leave the public school system.
Fiscal Impact
Because the program has been in operation for 16 years, fiscal effects are likely closer to the upper bound estimates.
Lower bound estimates: Lower bound estimates suggest that in the short run, the Florida Tax Credit Scholarship Program generated $330 million in cumulative net fiscal benefits for Florida taxpayers, or about $500 for each scholarship student through FY 2018. Put another way, for each dollar spent on the program, state and local taxpayers experienced $1.10 in cumulative savings. To save taxpayer dollars in the short run, over 79 percent of students would have to be switchers from public schools.
Upper bound estimates: Upper bound estimates suggest that in the long run, the Florida Tax Credit Scholarship Program’s existence through FY 2018 saved Florida taxpayers almost $2.5 billion, or about $3,700 for each scholarship student. Put another way, for each dollar spent on the program, state and local taxpayers would experience $1.72 in cumulative savings. To save taxpayer dollars in the long run, over 50 percent of students would have to be switchers from public schools.
Georgia
PROGRAMS INCLUDED IN ANALYSIS
1. Georgia Special Needs Scholarship Program
2. Georgia Qualified Education Expense Tax Credit
FISCAL EFFECTS SINCE INCEPTION OF PROGRAMS THROUGH FY 2018
Short Run Cumulative Net Savings (Cost): $605.5 million
Short Run Cumulative Net Savings (Cost) Per Student: $4,355
Short Run Savings For Each Dollar of Program Expenditure: $1.99
Long Run Cumulative Net Savings (Cost): $1.1 billion
Long Run Cumulative Net Savings (Cost) Per Student: $8,013
Long Run Savings For Each Dollar of Program Expenditure: $2.82
SPECIAL NEEDS SCHOLARSHIPS PROGRAM
Plan parameters described below were in effect during FY 2018, the latest year in the analysis, and may not reflect provisions currently in place.
The Georgia Special Needs Scholarship Program allows any student with a disability whose parents are not satisfied with their assigned public school to receive a voucher to attend private school. To qualify, a student must have been enrolled in a Georgia public school for the entire prior school year and must have also received special education services under an Individualized Education Plan (IEP) at any point in that year. Kindergarten students are effectively ineligible for this program. There are no family income limits on eligibility.
Vouchers are worth up to the state cost of the educational program a student would have received in district schools, as calculated by existing state funding formulas. A voucher may not exceed the private school’s tuition and fees.
Given the program’s public school prior enrollment requirements, the analysis assumes all students are switchers. The analysis also accounts for the differential cost of providing services to students with special needs. The methods section in the main report discusses further details.
Fiscal Disparity for Georgia Special Needs Scholarships Program
In Georgia, the estimated total cost of public schools per student for students with special needs in FY 2018 was $20,699 and the estimated average variable cost per student for students with special needs was $17,150. The average voucher amount was $6,223, or just 36 percent of the total per-student cost for the public school system. The average per-student cost of the program is significantly less than the average per-student variable cost and indicates that that the program is generating cost savings for taxpayers and school districts when students leave the public school system.
Fiscal Impact
Because the program has been in operation for 11 years, fiscal effects are likely closer to the upper bound estimates.
Lower bound estimates: Lower bound estimates suggest that in the short run, the Special Needs Scholarships Program generated $311 million in cumulative net fiscal benefits for Georgia taxpayers, or about $9,200 for each voucher recipient through FY 2018. Put another way, for each dollar spent on the program, state and local taxpayers experienced $2.55 in cumulative savings. To save taxpayer dollars in the short run, over 39 percent of students would have to be switchers from public schools.
Upper bound estimates: Upper bound estimates suggest that in the long run, the Special Needs Scholarships Program’s existence through FY 2018 saved Georgia taxpayers an estimated $418 million for each voucher recipient, or about $12,500 for each voucher recipient. Put another way, for each dollar spent on the program, state and local taxpayers would experience $3.09 in cumulative savings. To save taxpayer dollars in the long run, over 32 percent of students would have to be switchers from public schools.
QUALIFIED EDUCATION EXPENSE TAX CREDIT
Plan parameters described below were in effect during FY 2018, the latest year in the analysis, and may not reflect provisions currently in place.
The Georgia Qualified Education Expense Tax Credit is open to students who attended a public school for at least six weeks immediately prior to receiving a scholarship and students enrolling in prekindergarten, kindergarten, or first grade. Although most private school students are not eligible for the program, nearly all (88 percent) of K–12 Georgia students were eligible in 2018.
The program provides individuals and corporations a dollar-for-dollar tax credit for donations to a Student Scholarship Organization (SSO). It limits the amount of claimable tax credits for individuals and corporations. The program also currently caps tax credits disbursed in 2018 at $58 million. Scholarship amounts are capped at the average state and local per-pupil K–12 expenditures ($9,817 for 2018).
Prior to 2011, SSO data reporting requirements were very limited. SSOs reported only the value of tax credits approved and list of donors. In 2011, the law was amended to require information related to scholarships, such as the number of scholarships and total amount awarded. Because these data are the minimum needed to generate an impact estimate, the analysis omits the years 2008–2010.
It is possible that some scholarship recipients in prekindergarten, kindergarten, or first grade would enroll in private school even without financial assistance from the scholarship program. It is impossible to know exactly how many students in the program would be switchers, however, and data on prior enrollment are not available. The analysis makes an adjustment to account for potential non-switchers by cautiously assuming that 85 percent of students from these groups were switchers.i The methods section in the main report discusses further details.
Fiscal Disparity for Qualified Education Expense Tax Credit
In Georgia, the estimated total cost of public schools per student in FY 2018 was $12,109 and the estimated average variable cost per student was $7,718. The average amount of tax credit disbursements was $3,713, or just 31 percent of the total per-student cost for the public school system. The average per-student cost of the program is less than the average per-student variable cost and indicates that that the program is generating cost savings for taxpayers and school districts when students leave the public school system.
Fiscal Impact
Because the program has been in operation for 10 years, fiscal effects are likely closer to the upper bound estimates.
Lower bound estimates: Lower bound estimates suggest that in the short run, the Qualified Education Expense Tax Credit Program generated $295 million in cumulative net fiscal benefits for Georgia taxpayers, or about $2,800 for each scholarship student through FY 2018. Put another way, for each dollar spent on the program, state and local taxpayers experienced $1.71 in cumulative savings. To save taxpayer dollars in the short run, over 56 percent of students would have to be switchers from public schools.
Upper bound estimates: Upper bound estimates suggest that in the long run, the Qualified Education Expense Tax Credit Program’s existence through FY 2018 saved Georgia taxpayers $700 million, or about $6,600 for each scholarship student. Put another way, for each dollar spent on the program, state and local taxpayers would experience $2.69 in cumulative savings. To save taxpayer dollars in the long run, over 36 percent of students would have to be switchers from public schools.
i To estimate the number of prekindergarten, kindergarten and first grade students in the program, the analysis assumes a uniform distribution of students across grades.
Indiana
PROGRAMS INCLUDED IN ANALYSIS
1. Indiana Choice Scholarship Program
2. Indiana School Scholarship Tax Credit
FISCAL EFFECTS SINCE INCEPTION OF PROGRAMS THROUGH FY 2018
Short Run Cumulative Net Savings (Cost): $554.9 million
Short Run Cumulative Net Savings (Cost) Per Student: $2,504
Short Run Savings For Each Dollar of Program Expenditure: $1.77
Long Run Cumulative Net Savings (Cost): $1.5 billion
Long Run Cumulative Net Savings (Cost) Per Student: $6,871
Long Run Savings For Each Dollar of Program Expenditure: $3.12
INDIANA CHOICE SCHOLARSHIP PROGRAM
Plan parameters described below were in effect during FY 2018, the latest year in the analysis, and may not reflect provisions currently in place.
The Indiana Choice Scholarship Program (ICSP) allows low- and middle-income families to receive vouchers for their children to attend private schools of their choice. To participate in the program, students must satisfy any of the following requirements:
• Must have attended a public school in the preceding two semesters and are from families with income up to 150 percent of FRL;
• Have an Individualized Education Plan (IEP) and are from families with incomes up to 200 percent of FRL;
• Attended or would attend a public school designated F and are from families with income up to 150 percent of FRL;
• Are students or siblings of students who previously received a voucher or tax-credit scholarship;
• Students who participated in the voucher program during the previous year and are from families with incomes up to 200 percent of FRL;
Students from families with incomes that qualify them for the FRL program can receive vouchers worth up to 90 percent of the state funding allocation for the sending district. Students from families that earn between 125–150 percent of FRL can receive a voucher worth up to 50 percent of the state funding allocation for the sending district. Students receive vouchers equal to the lesser of the percentage amounts or their private school tuition.
The present fiscal analysis reflects the full cost associated with students who would have paid tuition for a private school with or without a voucher. Not doing so would overstate our estimates for variable cost savings. The Indiana Dept. of Education (IDOE) annually reports the percentage of students in the ICSP without any record of attending an Indiana public school. Spalding (2014) and Scafidi (forthcoming) argued that this estimate overstates the share of students who would have paid tuition for private school with or without a voucher.i Scafidi estimated switcher rates using IDOE data for all years of the program. The analysis employs Scafidi’s estimates.
Fiscal Disparity for Choice Scholarship Program
In Indiana, the estimated total cost of public schools per student in FY 2018 was $11,804 and the estimated average variable cost per student was $6,884. The average voucher amount was $4,342, or just 37 percent of the total per-student cost for the public school system. The average per-student cost of the program is significantly less than the average per-student variable cost and indicates that that the program is generating cost savings for taxpayers and school districts when students leave the public school system.
Fiscal Impact
Because the program has been in operation for seven years, fiscal effects are likely closer to the upper bound estimates.
Lower bound estimates: Lower bound estimates suggest that in the short run, the Choice Scholarship Program generated $288 million in cumulative net fiscal benefits for Indiana taxpayers, or $1,750 for each voucher recipient through FY 2018. Put another way, for each dollar spent on the program, state and local taxpayers experienced $1.43 in cumulative savings. To save taxpayer dollars in the short run, over 63 percent of students would have to be switchers from public schools.
Upper bound estimates: Upper bound estimates suggest that in the long run, the Choice Scholarship Program’s existence through FY 2018 saved Indiana taxpayers $1.0 billion, or about $6,200 for each voucher recipient. Put another way, for each dollar spent on the program, state and local taxpayers would experience $2.52 in cumulative savings. To save taxpayer dollars in the long run, over 36 percent of students would have to be switchers from public schools.
INDIANA SCHOOL SCHOLARSHIP TAX CREDIT
Plan parameters described below were in effect during FY 2018, the latest year in the analysis, and may not reflect provisions currently in place.
The Indiana School Scholarship Tax Credit is open to students with household incomes up to 200 percent of the limit to qualify for the federal free and reduced-price lunch program. The program is open to current private school students.
The state may provide individuals and corporations 50 cents in tax credits for each dollar donated to Scholarship Granting Organizations (SGOs). The total number of tax credits the state may give out was capped at $12.5 million in 2017–18. There is no limit, however, on the amount of tax credits that donors can claim.
Because the program is open to current private school students, it is possible that some scholarship recipients would enroll in private school even without financial assistance. It is impossible to know exactly how many students in the program would be switchers, however, and data on prior enrollment are not available. To account for the possibility that some students would have enrolled in non-public schools without the program in place, the analysis uses information from lottery-based studies of voucher programs to inform switcher rates.ii Lower bound and upper bound median and weighted average switcher rate estimates were about 85 percent and 90 percent, respectively. The present analysis cautiously assumes 85 percent for the switcher rate in the program.
Fiscal Disparity for School Scholarship Tax Credit
In Indiana, the estimated total cost of public schools per student in FY 2018 was $11,804 and the estimated average variable cost per student was $6,884. The average amount of tax credit disbursements was $1,272, or just 11 percent of the total per-student cost for the public school system. The average per-student cost of the program is less than the average per-student variable cost and indicates that that the program is generating cost savings for taxpayers and school districts when students leave the public school system.
Fiscal Impact
Because the program has been in operation for nine years, fiscal effects are likely closer to the upper bound estimates.
Lower bound estimates: Lower bound estimates suggest that in the short run, the School Scholarship Tax Credit program generated $267 million in cumulative net fiscal benefits for Indiana taxpayers, or about $4,700 for each scholarship student through FY 2018. Put another way, for each dollar spent on the program, state and local taxpayers experienced $6.62 in cumulative savings. To save taxpayer dollars in the short run, over 13 percent of students would have to be switchers from public schools.
Upper bound estimates: Upper bound estimates suggest that in the long run, the School Scholarship Tax Credit program’s existence through FY 2018 saved Indiana taxpayers $506 million, or about $8,800 for each scholarship student. Put another way, for each dollar spent on the program, state and local taxpayers would experience $11.65 in cumulative savings. To save taxpayer dollars in the long run, over 7 percent of students would have to be switchers from public schools.
i Jeffrey Spalding, “Properly Counting Indiana’s Voucher Students, Step By Step,” published January 31, 2014, Friedman Foundation for Educational Choice, retrieved from https://www.edchoice.org/engage/properly-counting-indianas-voucher-students-step-by-step/
ii For a summary, please see: Martin F. Lueken (2020), The Fiscal Impact of K-12 Educational Choice: Using Random Assignment Studies of Private School Choice Programs to Infer Student Switcher Rates, Journal of School Choice, published online 3/4/2020 at https://doi.org/10.1080/15582159.2020.1735863
Iowa
PROGRAMS INCLUDED IN ANALYSIS
1. Iowa School Tuition Organization Tax Credit
FISCAL EFFECTS SINCE INCEPTION OF PROGRAMS THROUGH FY 2018
Short Run Cumulative Net Savings (Cost): $656.8 million
Short Run Cumulative Net Savings (Cost) Per Student: $5,402
Short Run Savings For Each Dollar of Program Expenditure: $6.79
Long Run Cumulative Net Savings (Cost): $1.2 billion
Long Run Cumulative Net Savings (Cost) Per Student: $9,777
Long Run Savings For Each Dollar of Program Expenditure: $11.48
SCHOOL TUITION ORGANIZATION TAX CREDIT
Plan parameters described below were in effect during FY 2018, the latest year in the analysis, and may not reflect provisions currently in place.
The Iowa School Tuition Organization Tax Credit program provides scholarships to students from families with incomes up to 300 percent of the federal poverty level. Individuals can claim tax credits worth 65 cents for every dollar donated to a School Tuition Organization (STO). Each STO is limited in the amount of tax credits it grants—each STO’s share is determined by enrollment. Corporate donors can receive tax credits worth up to 25 percent of the program’s $12 million cap. This cap is fixed and does not have an escalator.
Prior enrollment in a public school is not a requirement for program eligibility. Thus, it is possible that some scholarship recipients would enroll in private school even without this financial assistance. It is impossible to know exactly how many students in the program would be switchers, however, and data on prior enrollment are not available.
To account for the possibility that some students would have enrolled in non-public schools without the program in place, the analysis uses information from lottery-based studies of voucher programs to inform switcher rates.i Lower bound and upper bound median and weighted average switcher rate estimates were about 85 percent and 90 percent, respectively. The present analysis cautiously assumes 85 percent for the switcher rate in the program.
Fiscal Disparity for School Tuition Organization Tax Credit
In Iowa, the estimated total cost of public schools per student in FY 2018 was $13,595 and the estimated average variable cost per student was $8,521. The average amount of tax credit disbursements was $1,107, or just 8 percent of the total per-student cost for the public school system. The average per-student cost of the program is less than the average per-student variable cost and indicates that that the program is generating cost savings for taxpayers and school districts when students leave the public school system.
Fiscal Impact
Because the program has been in operation for 12 years, fiscal effects are likely closer to the upper bound estimates.
Lower bound estimates: Lower bound estimates suggest that in the short run, the School Tuition Organization Tax Credit program generated $657 million in cumulative net fiscal benefits for Iowa taxpayers, or about $5,400 for each scholarship student through FY 2018. Put another way, for each dollar spent on the program, state and local taxpayers experienced $6.79 in cumulative savings. To save taxpayer dollars in the short run, over 13 percent of students would have to be switchers from public schools.
Upper bound estimates: Upper bound estimates suggest that in the long run, the School Tuition Organization Tax Credit program’s existence through FY 2018 saved Iowa taxpayers $1.2 billion, or about $9,800 for each scholarship student. Put another way, for each dollar spent on the program, state and local taxpayers would experience $11.48 in cumulative savings. To save taxpayer dollars in the long run, over 7 percent of students would have to be switchers from public schools.
i For a summary, please see: Martin F. Lueken (2020), The Fiscal Impact of K-12 Educational Choice: Using Random Assignment Studies of Private School Choice Programs to Infer Student Switcher Rates, Journal of School Choice, published online 3/4/2020 at https://doi.org/10.1080/15582159.2020.173586359.2020.1735863
Kansas
PROGRAMS INCLUDED IN ANALYSIS
1. Kansas Low Income Students Scholarship
FISCAL EFFECTS SINCE INCEPTION OF PROGRAMS THROUGH FY 2018
Short Run Cumulative Net Savings (Cost): ($1.7 million)
Short Run Cumulative Net Savings (Cost) Per Student: ($2,705)
Short Run Savings For Each Dollar of Program Expenditure: $0.74
Long Run Cumulative Net Savings (Cost): $1.8 million
Long Run Cumulative Net Savings (Cost) Per Student: $2,827
Long Run Savings For Each Dollar of Program Expenditure: $1.27
LOW INCOME STUDENTS SCHOLARSHIP
Plan parameters described below were in effect during FY 2018, the latest year in the analysis, and may not reflect provisions currently in place.
The Kansas Low Income Students Scholarship program serves low-income and at-risk students. The program allows individual and corporate taxpayers to make donations to scholarship granting organizations (SGOs) in return for tax credits worth 70 percent of their donations. The program caps the total amount of tax credits that may be disbursed at $10 million each year. SGOs determine scholarship amounts. Scholarships cannot exceed the lesser of $8,000 or the cost of tuition, fees, expenses, and transportation by a qualified school.
Eligible children may receive scholarships if they come from a family whose household income does not exceed 100 percent of the guidelines needed to qualify for the federal free lunch program. They must also be assigned to a Title I Focus School or a Title I Priority School (“Failing Schools”). Eligible students must be enrolled in any public school in the previous school year prior to receiving the scholarship or be enrolled in any public school in the school year in which an educational scholarship is first sought for the child, unless the child is under six years of age.
It is possible that some scholarship recipients under age 6 would enroll in private school even without financial assistance from the scholarship program. It is impossible to know exactly how many students in the program would be switchers, however, and data on prior enrollment are not available. The analysis makes an adjustment to account for potential non-switchers by cautiously assuming that 85 percent of students from this group were switchers.i The methods section in the main report discusses further details.
In the first three years of the program (through 2018), almost $2.2 million in scholarships were awarded to 620 students while the state disbursed $6.4 million in tax credits for $9.2 million in taxpayer donations to SGOs. Thus, participation in the program during this period has been low relative to many other programs while scholarship donations were frontloaded, leading to the program generating a cumulative net fiscal cost for taxpayers over this period. Each of the first three years generated short-run net fiscal costs while the program’s third year registered a net fiscal benefit. In the long run, however, the program will generate net savings overall given the gap between the costs of the scholarship program and public K–12 school system.
These factors suggest that the short-run fiscal effects of the program need more time to smooth out and reach a steady state compared to other states’ experiences with tax-credit scholarship programs. Given the program’s eligibility requirements plus the fiscal disparity between the per-pupil cost of the program and short-run variable costs of the public school system, the cumulative net fiscal effect will likely become positive as demand to join the program catches up with available funding for scholarships.
Fiscal Disparity for Low Income Students Scholarship
In Kansas, the estimated total cost of public schools per student in FY 2018 was $13,904 and the estimated average variable cost per student was $8,338. The average amount of tax credit disbursements was $7,753, or just 56 percent of the total per-student cost for the public school system. The average per-student cost of the program in FY 2018 was less than the average per-student variable cost and generated a net fiscal benefit that particular year.
Fiscal Impact
Because the program has been in operation for three years, fiscal effects are likely closer to the lower bound estimates.
Lower bound estimates: Lower bound estimates suggest that in the short run, the Low Income Students Scholarship program generated a cumulative net fiscal cost for Kansas taxpayers of $1.7 million, or about $2,700 for each scholarship student through FY 2018. Put another way, for each dollar spent on the program, state and local taxpayers experienced $0.74 in cumulative savings. No break-even switcher rate emerged during the period.
Upper bound estimates: Upper bound estimates suggest that in the long run, the Low Income Students Scholarship program’s existence through FY 2018 saved Kansas taxpayers of $1.8 million, or about $2,800 for each scholarship student. Put another way, for each dollar spent on the program, state and local taxpayers would experience $1.27 in cumulative savings. To save taxpayer dollars in the long run, over 77 percent of students would have to be switchers from public schools.
i To estimate the number of prekindergarten, kindergarten and first grade students in the program, the analysis assumes a uniform distribution of students across grades.59.2020.173586359.2020.1735863
Louisiana
PROGRAMS INCLUDED IN ANALYSIS
1. Louisiana Scholarship Program
2. Louisiana School Choice Program for Certain Students with Exceptionalities
3. Louisiana Tuition Donation Rebate Program
FISCAL EFFECTS SINCE INCEPTION OF PROGRAMS THROUGH FY 2018
Short Run Cumulative Net Savings (Cost): $97.7 million
Short Run Cumulative Net Savings (Cost) Per Student: $1,896
Short Run Savings For Each Dollar of Program Expenditure: $1.37
Long Run Cumulative Net Savings (Cost): $322.7 million
Long Run Cumulative Net Savings (Cost) Per Student: $6,260
Long Run Savings For Each Dollar of Program Expenditure: $2.23
LOUISIANA SCHOLARSHIP PROGRAM
Louisiana Scholarship Program (LSP, formerly known as the Student Scholarships for Education Excellence Program) is available to low-income students in low-performing public schools statewide. Students are eligible if their family income is no more than 250 percent of the federal poverty line and they either (1) attended a public school designated as C, D, F or T (turnaround school) in the previous year, (2) are entering kindergarten or (3) were enrolled at a public school in the Recovery School District.
Prior to 2012-13, the program was limited to only Jefferson Parish and Orleans Parish. If the number of applicants exceeds the program’s participation limit or if a private school is oversubscribed under the program, then participation is determined by random lottery.
The voucher is equal to the lesser of a) 90 percent of the minimum foundation program (MFP) formula, which is inclusive of state and local per pupil allocation in the student’s home school district; or b) the tuition and fees charged by the private school. Schools may not charge the difference between these two amounts if tuition and fees exceed the district’s MFP amount. In addition, funding amounts depend upon legislative approval. For FY 2018, the state’s legislature approved $39.9 million.i
To account for the likelihood that some students using vouchers would enroll in non-public schools without the program’s financial assistance, the present fiscal analysis uses information from random assignment studies of the LSP where researchers observed the type of schools where students in the control group enrolled after those students lost a lottery.ii
Fiscal Disparity for Louisiana Scholarship Program
In Louisiana, the estimated total cost of public schools per student in FY 2018 was $12,526 and the estimated average variable cost per student was $7,744. The average voucher amount was $6,007, or just 48 percent of the total per-student cost for the public school system. The average per-student cost of the program is significantly less than the average per-student variable cost and indicates that that the program is generating cost savings for taxpayers and school districts when students leave the public school system.
Fiscal Impact
Because the program has been in operation for 10 years, fiscal effects are likely closer to the upper bound estimates.
Lower bound estimates: Lower bound estimates suggest that in the short run, the LSP generated $52 million in cumulative net fiscal benefits for Louisiana taxpayers, or about $1,200 for each voucher recipient through FY 2018. Put another way, for each dollar spent on the program, state and local taxpayers experienced $1.21 in cumulative savings. To save taxpayer dollars in the short run, over 73 percent of students would have to be switchers from public schools.
Upper bound estimates: Upper bound estimates suggest that in the long run, the LSP’s existence through FY 2018 saved Louisiana taxpayers an estimated $249 million, or about $5,500 for each voucher recipient. Put another way, for each dollar spent on the program, state and local taxpayers would experience $2.00 in cumulative savings. To save taxpayer dollars in the long run, over 45 percent of students would have to be switchers from public schools.
SCHOOL CHOICE PROGRAM FOR STUDENTS WITH EXCEPTIONALITIES
Plan parameters described below were in effect during FY 2018, the latest year in the analysis, and may not reflect provisions currently in place.
The Louisiana School Choice Program for Students with Exceptionalities was launched in 2011 to allow students with certain exceptionalities who live in eligible parishes (i.e. parishes with more than 190,000 residents) to attend schools of their parents’ choice. Students are eligible for the program if they have one of seven categories of learning exceptionalities or have an Individualized Education Plan. Students deemed gifted or talented are not eligible for this program.
The voucher is worth the lesser of 50 percent of the state’s cost to educate the child in his or her public school or the cost of private school tuition. Families are responsible for any additional tuition charged by the school. Participation in this program is very limited, with just 394 students receiving vouchers in FY 2018.
Although it is possible that some students participating in the program would have enrolled in a non-public school setting without financial assistance from the program, this number is likely to be very small given their disadvantaged background and higher education costs. The analysis takes a very cautious approach by assuming that 90 percent students in the program are switchers. The analysis also accounts for the differential cost of providing services to students with special needs. The methods section in the main report discusses further details.
Fiscal Disparity for School Choice Program for Students with Exceptionalities
In Louisiana, the estimated total cost of public schools per student for students with special needs in FY 2018 was $21,913 and the estimated average variable cost per student for students with special needs was $17,612. The average voucher amount was $2,190, or just 10 percent of the total per-student cost for the public school system. The average per-student cost of the program is significantly less than the average per-student variable cost and indicates that that the program is generating cost savings for taxpayers and school districts when students leave the public school system.
Fiscal Impact
Because the program has been in operation for seven years, fiscal effects are likely closer to the upper bound estimates.
Lower bound estimates: Lower bound estimates suggest that in the short run, the School Choice Program for Students with Exceptionalities generated $25 million in cumulative net fiscal benefits for Louisiana taxpayers, or $12,600 for each voucher recipient through FY 2018. Put another way, for each dollar spent on the program, state and local taxpayers experienced $6.66 in cumulative savings. To save taxpayer dollars in the short run, over 14 percent of students would have to be switchers from public schools.
Upper bound estimates: Upper bound estimates suggest that in the long run, the School Choice Program for Students with Exceptionalities program’s existence through FY 2018 saved Louisiana taxpayers $34 million, or $16,900 for each voucher recipient. Put another way, for each dollar spent on the program, state and local taxpayers would experience $8.56 in cumulative savings. To save taxpayer dollars in the long run, over 11 percent of students would have to be switchers from public schools.
TUITION DONATION CREDIT PROGRAM (FORMERLY TUITION DONATION REBATE PROGRAM)
Plan parameters described below were in effect during FY 2018, the latest year in the analysis, and may not reflect provisions currently in place.
Louisiana’s Tuition Donation Credit Program provides tax credits for donations that taxpayers make to school tuition organizations (STOs). Tax credits are worth 100 percent of donations. There is no limit to the total amount of tax credit available to taxpayers.
To be eligible for the program, students must come from families with household income below 250 percent of the federal poverty level. Students must also have attended a public school in both semesters of the previous school year or have previously received a scholarship. Students are also eligible for the program if they are in kindergarten or if they received a voucher via the Louisiana Scholarship Program the previous year.
The program places limits on the value of scholarships that STOs may award to students. For K-8 students, the maximum scholarship amount is 80 percent of the state average per-pupil Minimum Foundation Program (MFP) funding during the previous year. For students in grades 9-12, the maximum scholarship amount is 90 percent of the per-pupil MFP.
While prior enrollment in a public school is a requirement for program eligibility, there are two exceptions to this requirement: kindergarten students and students who received a voucher via the Louisiana Scholarship Program. Given these exceptions to the public school prior enrollment requirement, it is possible that some scholarship recipients would enroll in private school even without the program’s financial assistance. To account for the possibility that some students would have enrolled in non-public schools without the program in place, the analysis estimates switcher rates based on data obtained directly from the Louisiana Department of Education on the number of students who were enrolled in public school prior to entering the program.
Fiscal Disparity for Tuition Donation Credit Program
In Louisiana, the estimated total cost of public schools per student in FY 2018 was $12,526 and the estimated average variable cost per student was $7,744. The average amount of tax credit disbursements was $3,558, or just 28 percent of the total per-student cost for the public school system. The average per-student cost of the program is less than the average per-student variable cost and indicates that that the program is generating cost savings for taxpayers and school districts when students leave the public school system.
Fiscal Impact
Because the program has been in operation for five years, fiscal effects are likely closer to the upper bound estimates.
Lower bound estimates: Lower bound estimates suggest that in the short run, the School Tuition Organization Tax Credit program generated $20 million in cumulative net fiscal benefits for Louisiana taxpayers, or about $4,400 for each scholarship student through FY 2018. Put another way, for each dollar spent on the program, state and local taxpayers experienced $2.93 in cumulative savings. To save taxpayer dollars in the short run, over 30 percent of students would have to be switchers from public schools.
Upper bound estimates: Upper bound estimates suggest that in the long run, the School Tuition Organization Tax Credit program’s existence through FY 2018 saved Louisiana taxpayers $40 million, or about $8,900 for each scholarship student. Put another way, for each dollar spent on the program, state and local taxpayers would experience $4.85 in cumulative savings. To save taxpayer dollars in the long run, over 18 percent of students would have to be switchers from public schools.
i John Bel Edwards and Jay Dardenne (2017). State Budget: Fiscal Year 2017–2018, retrieved from Louisiana Division of Administration: https://www.doa.la.gov/media/jo3b3cjq/statebudgetfy18.pdf
ii For years not studied in Mills and Wolf (2019), For years not studied in this evaluation, the present analysis applies the first observed year’s switcher rate to years preceding the study period. For subsequent years not observed, the analysis applies a weighted average switcher rate observed from the years studied, weighted by students participating in the program. Because switcher rates during the early period were likely higher given that the program operated as a pilot and was available to students in failing school districts only (New Orleans and Jefferson Parish at that time), estimates are likely cautious.
Jonathan N. Mills and Patrick J. Wolf (2019). The effects of the Louisiana scholarship program on student achievement after four years (Louisiana Scholarship Program Evaluation Report 10). University of Arkansas. EDRE Working Paper No. 2019-10. doi:10.2139/ssrn.3376230
Mississippi
PROGRAMS INCLUDED IN ANALYSIS
1. Mississippi Equal Opportunity for Students with Special Needs Program
2. Mississippi Dyslexia Therapy Scholarship for Students with Dyslexia Program
FISCAL EFFECTS SINCE INCEPTION OF PROGRAMS THROUGH FY 2018
Short Run Cumulative Net Savings (Cost): $11.7 million
Short Run Cumulative Net Savings (Cost) Per Student: $7,160
Short Run Savings For Each Dollar of Program Expenditure: $2.38
Long Run Cumulative Net Savings (Cost): $17.3 million
Long Run Cumulative Net Savings (Cost) Per Student: $10,644
Long Run Savings For Each Dollar of Program Expenditure: $3.05
EQUAL OPPORTUNITY FOR STUDENTS WITH SPECIAL NEEDS PROGRAM
Plan parameters described below were in effect during FY 2018, the latest year in the analysis, and may not reflect provisions currently in place.
The Mississippi Equal Opportunity for Students with Special Needs Program launched in 2015 and allows students with special needs an opportunity to receive a portion of their public funding in an education savings account (ESA). The annual ESA amount was $6,500 in 2017–18 and may increase or decrease proportionally to the annual change of the Mississippi Adequate Education Program (MAEP) base student cost.
Eligible students must have had an Individualized Education Plan (IEP) within the past five years. The program currently places a cap on the number of students participating, and it also restricts program growth to 500 new students each year. The program is small and has not been funded up to the enrollment cap since its second year. In FY 2018, 367 students participated in the program.
Although it is possible that some students participating in the program would have enrolled in a non-public school setting without financial assistance from the program, this number is likely to be very small given their disadvantaged background and higher education costs. The analysis takes a very cautious approach by assuming that 90 percent students in the program are switchers. The analysis also accounts for the differential cost of providing services to students with special needs. The methods section in the main report discusses further details.
Fiscal Disparity for Equal Opportunity for Students with Special Needs Program
In Mississippi, the estimated total cost of public schools per student for students with special needs in FY 2018 was $17,128 and the estimated average variable cost per student for students with special needs was $13,165. The average ESA amount was $5,607, or just 33 percent of the total per-student cost for the public school system. The average per-student cost of the program is significantly less than the average per-student variable cost and indicates that that the program is generating cost savings for taxpayers and school districts when students leave the public school system.
Fiscal Impact
Because the program has been in operation for three years, fiscal effects are likely closer to the lower bound estimates.
Lower bound estimates: Lower bound estimates suggest that in the short run, the Equal Opportunity for Students with Special Needs Program generated $6 million in cumulative net fiscal benefits for Mississippi taxpayers, or about $6,400 for each ESA recipient through FY 2018. Put another way, for each dollar spent on the program, state and local taxpayers experienced $2.16 in cumulative fiscal benefits. To save taxpayer dollars in the short run, over 42 percent of students would have to be switchers from public schools.
Upper bound estimates: Upper bound estimates suggest that in the long run, the Equal Opportunity for Students with Special Needs Program’s existence saved taxpayers $9 million, or about $9,700 for each ESA recipient. Put another way, for each dollar spent on the program, taxpayers would experience $2.77 in cumulative savings. To save taxpayer dollars in the long run, over just 32 percent of students would have to be switchers from public schools.
DYSLEXIA THERAPY SCHOLARSHIP FOR STUDENTS WITH DYSLEXIA PROGRAM
Plan parameters described below were in effect during FY 2018, the latest year in the analysis, and may not reflect provisions currently in place.
The Mississippi Dyslexia Therapy Scholarship for Students with Dyslexia Program provides vouchers to children with dyslexia that allow them to attend accredited private schools that provide dyslexia therapy. Children in grades 1-12 are eligible if they have been properly screened and diagnosed with dyslexia, and if they either attended a public school or attended a state-approved private school that “emphasizes instruction in dyslexia intervention.” Students in most private schools in the state, homeschool, virtual school environments, or students in juvenile detention schools are not eligible for the program.
The voucher is equal to the Mississippi Adequate Education Program base student cost amount. This is the base funding amount the state provides to public schools for each student. Participation in this program is extremely limited, with just 210 students receiving vouchers in FY 2018. This low participation is likely driven by the cost differential between the modest voucher amount and the higher cost to educate students with dyslexia.
Given the program’s strict eligibility requirements, the analysis assumes all students are switchers. The analysis also accounts for the differential cost of providing services to students with special needs. The methods section in the main report discusses further details.
Fiscal Disparity for Mississippi Dyslexia Therapy Scholarship for Students with Dyslexia Program
In Mississippi, the estimated total cost of public schools per student for students with special needs in FY 2018 was $17,128 and the estimated average variable cost per student for students with special needs was $13,165. The average voucher amount was $4,909, or just 29 percent of the total per-student cost for the public school system. The average per-student cost of the program is significantly less than the average per-student variable cost and indicates that that the program is generating cost savings for taxpayers and school districts when students leave the public school system.
Fiscal Impact
Because the program has been in operation for six years, fiscal effects are likely closer to the upper bound estimates.
Lower bound estimates: Lower bound estimates suggest that in the short run, the Dyslexia Therapy Scholarship for Students with Dyslexia Program generated $6 million in cumulative net fiscal benefits for Mississippi taxpayers, or about $8,100 for each voucher recipient through FY 2018. Put another way, for each dollar spent on the program, state and local taxpayers experienced $2.68 in cumulative savings. To save taxpayer dollars in the short run, over 37 percent of students would have to be switchers from public schools.
Upper bound estimates: Upper bound estimates suggest that in the long run, the Dyslexia Therapy Scholarship for Students with Dyslexia Program’s existence through FY 2018 saved Mississippi taxpayers $9 million, or about $11,750 for each voucher recipient. Put another way, for each dollar spent on the program, state and local taxpayers would experience $3.43 in cumulative savings. To save taxpayer dollars in the long run, over 29 percent of students would have to be switchers from public schools.
New Hampshire
PROGRAMS INCLUDED IN ANALYSIS
1. New Hampshire Education Tax Credit Program
FISCAL EFFECTS SINCE INCEPTION OF PROGRAMS THROUGH FY 2018
Short Run Cumulative Net Savings (Cost): $9.2 million
Short Run Cumulative Net Savings (Cost) Per Student: $7,688
Short Run Savings For Each Dollar of Program Expenditure: $3.43
Long Run Cumulative Net Savings (Cost): $15.2 million
Long Run Cumulative Net Savings (Cost) Per Student: $12,739
Long Run Savings For Each Dollar of Program Expenditure: $5.03
EDUCATION TAX CREDIT PROGRAM
Plan parameters described below were in effect during FY 2018, the latest year in the analysis, and may not reflect provisions currently in place.
The New Hampshire Education Tax Credit Program provides scholarships to students from families with household income below 300 percent of the federal poverty level. The program is open to students from private schools and homeschool settings.
Individuals subject to New Hampshire’s interest and dividends tax and businesses may receive one dollar in tax credits for each dollar donated to scholarship organizations (SOs). The average value of all non-homeschooling scholarships an SO awards cannot exceed $2,762 in 2018, except for students with special needs, whose scholarships cannot be less than $4,749. That amount is adjusted each year to reflect the changes in the Consumer Price Index. Homeschooling students may receive reimbursements for educational expenses.
The program places a cap on available tax credits at $5.1 million each year, which is much lower than most tax-credit scholarship programs currently operating in other states. This cap, however, has yet to be reached. As a result of this low level of funding, participation in the program has been limited to just a few hundred students in recent years.
Because students currently enrolled in non-public schools can participate in the program and do not generate offsetting savings for the state or school districts, it will be important for the fiscal analysis to account for “switchers” and “non-switchers.” SOs annually report to the New Hampshire Department of Revenue certain prior-enrollment information about students. They also report information on the number of students eligible for the FRL program.i These data allow reasonable estimates for switcher rates.ii
Fiscal Disparity for Education Tax Credit Program
In New Hampshire, the estimated total cost of public schools per student in FY 2018 was $18,261 and the estimated average variable cost per student was $12,601. The average amount of tax credit disbursements was $5,538, or just 30 percent of the total per-student cost for the public school system. The average per-student cost of the program is less than the average per-student variable cost and indicates that that the program is generating cost savings for taxpayers and school districts when students leave the public school system.
Fiscal Impact
Because the program has been in operation for six years, fiscal effects are likely closer to the upper bound estimates.
Lower bound estimates: Lower bound estimates suggest that in the short run, the Education Tax Credit Program saved New Hampshire generated $9 million in cumulative net fiscal benefits for New Hampshire taxpayers, or about $7,700 for each scholarship student through FY 2018. Put another way, for each dollar spent on the program, state and local taxpayers experienced $3.43 in cumulative savings. To save taxpayer dollars in the short run, over 27 percent of students would have to be switchers from public schools.
Upper bound estimates: Upper bound estimates suggest that in the long run, the Education Tax Credit Program’s existence through FY 2018 saved New Hampshire taxpayers $15 million, or about $12,700 for each scholarship student. Put another way, for each dollar spent on the program, state and local taxpayers would experience $5.03 in cumulative savings. To save taxpayer dollars in the long run, over 18 percent of students would have to be switchers from public schools.
i The present analysis assumes that all scholarship students who are also eligible for FRL are switchers.
ii Notably, in the first two years of the program, scholarship organizations were required to award 70 percent of scholarship funds to students who previously attended a public school (“switchers”) or to switchers who already received a scholarship. However, beginning in the third year, the percentage of required switchers reduced by 5 percent each year. In 2017–18, the program required at least 50 percent of scholarship recipients to be switchers. Additionally, 40 percent of the total scholarships SOs award must be given to students who qualify for the federal free and reduced-price lunch program.
North Carolina
PROGRAMS INCLUDED IN ANALYSIS
1. North Carolina Special Education Scholarship Grants for Children with Disabilities
2. North Carolina Opportunity Scholarships
FISCAL EFFECTS SINCE INCEPTION OF PROGRAMS THROUGH FY 2018
Short Run Cumulative Net Savings (Cost): $74.1 million
Short Run Cumulative Net Savings (Cost) Per Student: $3,373
Short Run Savings For Each Dollar of Program Expenditure: $1.81
Long Run Cumulative Net Savings (Cost): $154.3 million
Long Run Cumulative Net Savings (Cost) Per Student: $7,022
Long Run Savings For Each Dollar of Program Expenditure: $2.69
SPECIAL EDUCATION SCHOLARSHIP GRANTS FOR CHILDREN WITH DISABILITIES
Plan parameters described below were in effect during FY 2018, the latest year in the analysis, and may not reflect provisions currently in place.
Launched in 2014, the North Carolina Special Education Scholarship Grants for Children with Disabilities program allows students with special needs to receive vouchers to attend private schools of their parents’ choosing.
Eligible students must have an Individualized Education Plan and receive special education services on a daily basis. Students must also meet one of the following conditions:
• They were enrolled in a North Carolina public school during the previous spring;
• They received special education services as a preschooler during the previous semester;
• They received a voucher under this program during the previous semester;
• They are eligible for enrollment in kindergarten or first grade; or
• They are a dependent of an active-duty member of the military.
Vouchers are funded on a semester basis and worth up to $4,000 per semester (or $8,000 per school year). They may be used for private school tuition and special education services, including services provided to home-schooled students. A total of $6.7 million was available for vouchers in 2017–18. Any leftover funds will carry over to the next fiscal year.
In FY 2018, the program expanded eligibility to all kindergarten students. Thus, it’s possible that some of these students would have enrolled in a non-public school setting without financial assistance from the program. Although this number is likely to be very small given their disadvantaged background and higher education costs, the analysis makes an adjustment to account for potential non-switchers by cautiously assuming that 85 percent of kindergarten students in FY 2018 were switchers.
It is possible that some kindergarten and first grade students participating in the program would have enrolled in a non-public school setting without financial assistance from the program. Although this number is likely to be very small given their disadvantaged background and higher education costs, the analysis makes an adjustment to account for potential non-switchers by cautiously assuming that 85 percent of kindergarten and first grade students were switchers.i The analysis also accounts for the differential cost of providing services to students with special needs. The methods section in the main report discusses further details.
Fiscal Disparity for Special Education Scholarship Grants for Children with Disabilities
In North Carolina, the estimated total cost of public schools per student for students with special needs in FY 2018 was $17,997 and the estimated average variable cost per student for students with special needs was $14,525. The average voucher amount was $6,765, or just 38 percent of the total per-student cost for the public school system. The average per-student cost of the program is significantly less than the average per-student variable cost and indicates that that the program is generating cost savings for taxpayers and school districts when students leave the public school system.
Fiscal Impact
Because the program has been in operation for five years, fiscal effects are likely closer to the upper bound estimates.
Lower bound estimates: Lower bound estimates suggest that in the short run, the Special Education Scholarship Grants for Children with Disabilities program generated $31 million in cumulative net fiscal benefits for North Carolina taxpayers, or about $7,500 for each voucher recipient through FY 2018. Put another way, for each dollar spent on the program, state and local taxpayers experienced $2.28 in cumulative savings. To save taxpayer dollars in the short run, over 43 percent of students would have to be switchers from public schools.
Upper bound estimates: Upper bound estimates suggest that in the long run, the Special Education Scholarship Grants for Children with Disabilities program’s existence through FY 2018 saved North Carolina taxpayers $45 million, or about $11,000 for each voucher recipient. Put another way, for each dollar spent on the program, state and local taxpayers would experience $2.88 in cumulative savings. To save taxpayer dollars in the long run, over 34 percent of students would have to be switchers from public schools.
OPPORTUNITY SCHOLARSHIPS
Plan parameters described below were in effect during FY 2018, the latest year in the analysis, and may not reflect provisions currently in place.
Started in 2014, the North Carolina Opportunity Scholarships program (NCOSP) awards vouchers statewide to students whose families meet certain income requirements. Students are eligible for the program if they come from families whose household income does not exceed 133 percent of FRL. In addition, students must have attended a public school during the semester prior to participating in the program. Exceptions to this prior enrollment requirement include students in kindergarten or first grade, foster children, dependents of full-time active military members, and children that have been adopted in the past year.
Vouchers may be worth up to $4,200 and cannot exceed the private school’s tuition and fees. They may be used for tuition, transportation, equipment or any other items required by qualifying private schools. Total funding available for the program was $44.8 million in 2017–18.
While prior enrollment in a public school is a requirement for program eligibility, there are a few exceptions to this requirement. Given these exceptions to the public school prior enrollment requirement, it is possible that some scholarship recipients would enroll in private school even without the program’s financial assistance. It is impossible to know exactly how many students in the program would be switchers, however, and data on prior enrollment are not available.
It is possible that some kindergarten and first grade students participating in the program would have enrolled in a non-public school setting without financial assistance from the program. The analysis for the NCOSP makes an adjustment by cautiously assuming that 85 percent of kindergarten and first grade students were switchers. The methods section in the main report discusses further details.
Fiscal Disparity for Opportunity Scholarships
In North Carolina, the estimated total cost of public schools per student in FY 2018 was $10,889 and the estimated average variable cost per student was $6,760. The average voucher amount was $3,807, or just 35 percent of the total per-student cost for the public school system. The average per-student cost of the program is significantly less than the average per-student variable cost and indicates that that the program is generating cost savings for taxpayers and school districts when students leave the public school system.
Fiscal Impact
Because the program has been in operation for four years, fiscal effects are likely closer to the lower bound estimates.
Lower bound estimates: Lower bound estimates suggest that in the short run, the North Carolina Opportunity Scholarship Program generated $44 million in cumulative net fiscal benefits for North Carolina taxpayers, or about $2,400 for each voucher recipient through FY 2018. Put another way, for each dollar spent on the program, state and local taxpayers experienced $1.64 in cumulative savings. To save taxpayer dollars in the short run, over 58 percent of students would have to be switchers from public schools.
Upper bound estimates: Upper bound estimates suggest that in the long run, the North Carolina Opportunity Scholarship Program’s existence through FY 2018 saved North Carolina taxpayers $109 million, or about $6,100 for each voucher recipient. Put another way, for each dollar spent on the program, state and local taxpayers would experience $2.62 in cumulative savings. To save taxpayer dollars in the long run, over 37 percent of students would have to be switchers from public schools.
i To estimate the number of kindergarten and first grade students in the program, the analysis assumes a uniform distribution of students across grades.
Ohio
PROGRAMS INCLUDED IN ANALYSIS
1. Ohio Cleveland Scholarship Program
2. Ohio Autism Scholarship
3. Ohio Educational Choice Scholarship Program
4. Ohio Jon Peterson Special Needs Scholarship Program
5. Ohio Income-Based Scholarship Program
FISCAL EFFECTS SINCE INCEPTION OF PROGRAMS THROUGH FY 2018
Short Run Cumulative Net Savings (Cost): $1.6 billion
Short Run Cumulative Net Savings (Cost) Per Student: $4,282
Short Run Savings For Each Dollar of Program Expenditure: $1.81
Long Run Cumulative Net Savings (Cost): $3.6 billion
Long Run Cumulative Net Savings (Cost) Per Student: $9,906
Long Run Savings For Each Dollar of Program Expenditure: $2.87
CLEVELAND SCHOLARSHIP PROGRAM
Plan parameters described below were in effect during FY 2018, the latest year in the analysis, and may not reflect provisions currently in place.
Started in 1996, the Cleveland Scholarship Program (CSTP) is the second-oldest modern-day voucher program in the U.S. Under this program, parents in the Cleveland Metropolitan School District can receive vouchers for their children to attend private schools or public schools bordering the school district. All children in grades K–12 who reside in the Cleveland Metropolitan School District are eligible. Priority is given to families with incomes less than 200 percent of the federal poverty level. Children from families with incomes above 200 percent of poverty are eligible to receive vouchers if approved by the Ohio Superintendent of Public Instruction. Participating private schools must accept voucher students on a random basis, giving preference to low-income students if they have more applicants than open seats.
The maximum voucher value is $4,650 for grades K–8 and $6,000 for high school. K–8 recipients with a household income no greater than twice the federal poverty level is allowed to use the voucher amount as full tuition payment. Parents whose household income is more than the 200 percent threshold may pay the remaining tuition or provide in-kind services of the same value.
The analysis accounts for switchers using information on prior enrollment obtained from the Ohio Department of Education. Until recently, no more than half of new recipients may be students previously enrolled in private schools. Historically, the share of vouchers awarded to private school students has been less than 25 percent, although that share has increased in recent years, as high as 43 percent in FY 2015. Even with an increase in the share of non-switchers, the program continues to generate a net fiscal benefit for taxpayers.
Fiscal Disparity for Cleveland Scholarship Program
In Cleveland, the estimated total cost of public schools per student in FY 2017 was $23,651 and the estimated average variable cost per student was $11,412. The average voucher amount was $4,614, or just 20 percent of the total per-student cost for the public school system. The average per-student cost of the program is significantly less than the average per-student variable cost and indicates that that the program is generating cost savings for taxpayers and school districts when students leave the public school system.
Fiscal Impact
Because the program has been in operation for 22 years, fiscal effects are likely closer to the upper bound estimates.
Lower bound estimates: Lower bound estimates suggest that in the short run, the Cleveland Scholarship Program generated $445 million in cumulative net fiscal benefits for Ohio taxpayers, or about $4,000 for each voucher recipient through FY 2017. Put another way, for each dollar spent on the program, state and local taxpayers experienced $2.32 in cumulative savings. To save taxpayer dollars in the short run, over 34 percent of students would have to be switchers from public schools.
Upper bound estimates: Upper bound estimates suggest that in the long run, the Cleveland Scholarship Program’s existence through FY 2017 saved Ohio taxpayers $1.0 billion, or about $9,400 for each voucher recipient. Put another way, for each dollar spent on the program, state and local taxpayers would experience $4.10 in cumulative savings. To save taxpayer dollars in the long run, over 19 percent of students would have to be switchers from public schools.
AUTISM SCHOLARSHIP PROGRAM
Plan parameters described below were in effect during FY 2018, the latest year in the analysis, and may not reflect provisions currently in place.
Launched in 2004, the Ohio Autism Scholarship Program provides vouchers for students on the autism spectrum to pay for education services from a private provider, including tuition at a private school. Students must be ages 3 to 21, diagnosed with an autism spectrum disorder, registered in a public school special education system and have a current IEP. Students may use the voucher whether or not they were enrolled previously in public schools, though students not previously enrolled in public schools must formally transfer into the public system (they do not need to actually leave their private schools).
The state compensates a student’s parents or custodian for education services up to a maximum of $27,000 per year. A child must be in the program for a full academic year to claim the maximum amount. Parents are responsible for covering any costs above the maximum annual allowance.
Although it is possible that some students participating in the program would have enrolled in a non-public school setting without financial assistance from the program, this number is likely to be very small given their disadvantaged background and higher education costs. The analysis takes a very cautious approach by assuming that 90 percent students in the program are switchers. The analysis also accounts for the differential cost of providing services to students with special needs.i The methods section in the main report in the main report discusses further details.
Fiscal Disparity for Autism Scholarship Program
In Ohio, the estimated total cost of public schools per student for autistic students was $41,422 and the estimated average variable cost per student for students with autism was $33,477 in FY 2018. The average voucher amount was $22,996, or just 56 percent of the total per-student cost for autistic students enrolled in the public school system. The average per-student cost of the program is less than the average per-student variable cost and indicates that that the program is generating cost savings for taxpayers and school districts when students leave the public school system.
Fiscal Impact
Because the program has been in operation for 14 years, fiscal effects are likely closer to the upper bound estimates.
Lower bound estimates: Lower bound estimates suggest that in the short run, the Autism Scholarships Program generated $142 million in cumulative net fiscal benefits for Ohio taxpayers, or about $5,100 for each voucher recipient through FY 2018. Put another way, for each dollar spent on the program, state and local taxpayers experienced $1.27 in cumulative savings. To save taxpayer dollars in the short run, over 71 percent of students would have to be switchers from public schools.
Upper bound estimates: Upper bound estimates suggest that in the long run, the Autism Scholarships Program’s existence through FY 2018 saved Ohio taxpayers $345 million, or about $12,300 for each voucher recipient. Put another way, for each dollar spent on the program, state and local taxpayers would experience $1.64 in cumulative savings. To save taxpayer dollars in the long run, over 58 percent of students would have to be switchers from public schools.
EDUCATIONAL CHOICE SCHOLARSHIPS PROGRAM
Plan parameters described below were in effect during FY 2018, the latest year in the analysis, and may not reflect provisions currently in place.
Enacted in 2005 as a pilot program, Ohio’s Educational Choice Scholarship Program provides up to 60,000 state-funded vouchers to students who attend chronically low-performing public schools for attending private schools. Students are eligible for the program if the student’s resident district is not a school district in which the pilot project scholarship program is operating (Cleveland), and the student satisfies one of the following conditions:
• the student attends a local public school that has received a grade D or F by the state’s performance index score,
• the student attends a local public school that was ranked in the lowest 10 percent of public schools in two of the three most recent rankings and the public school was not declared to be excellent or effective in the most recent rating system,
• the student is enrolled in a private school and is entering high school but would otherwise attend a D- or F-rated public school, or
• the student is enrolling in grades K–12 for the first time and would be assigned to a qualifying school as long as they are at least 5 years old by Jan. 1 of the school year.
Vouchers are worth up to $4,650 in grades K–8 and $6,000 in grades 9–12, and they may not exceed the private school’s actual tuition and fees. These limits are the same as voucher limits for the Cleveland Scholarship Program. Participating schools may charge remaining tuition not covered by the voucher for students whose household incomes exceed 200 percent of the federal poverty level, but they must accept the voucher as payment in full for students at or below the 200 percent level.
While prior enrollment in a public school is a requirement for program eligibility, there are two exceptions to this rule. The pathway for students enrolling in private school and entering high school who would otherwise attend a D- or F-rated public school was added after the present analysis’s study period. The other pathway provides access to the program for students enrolling in K–12 for the first time who would be assigned to a qualifying school. Given these exceptions to the public school prior enrollment requirement, it is possible that some scholarship recipients would enroll in private school even without the program’s financial assistance, although this number is likely to be very small given their disadvantaged background. Although attempts to obtain this information from the Ohio Department of Education were unsuccessful, the analysis makes an adjustment to account for potential non-switchers among kindergarten students in the program by cautiously assuming that 85 percent of students from these groups were switchers. The methods section in the main report discusses further details.
Fiscal Disparity for Educational Choice Scholarships Program
In Ohio, the estimated total cost of public schools per student in FY 2018 was $15,626 and the estimated average variable cost per student was $9,715. The average voucher amount was $4,762, or just 30 percent of the total per-student cost for the public school system. The average per-student cost of the program is significantly less than the average per-student variable cost and indicates that that the program is generating cost savings for taxpayers and school districts when students leave the public school system.
Fiscal Impact
Because the program has been in operation for 12 years, fiscal effects are likely closer to the upper bound estimates.
Lower bound estimates: Lower bound estimates suggest that in the short run, the Educational Choice Scholarships Program generated $692 million in cumulative net fiscal benefits for Ohio taxpayers, or about $3,900 for each voucher recipient through FY 2018. Put another way, for each dollar spent on the program, state and local taxpayers experienced $1.92 in cumulative savings. To save taxpayer dollars in the short run, over 52 percent of students would have to be switchers from public schools.
Upper bound estimates: Upper bound estimates suggest that in the long run, the Educational Choice Scholarships Program’s existence through FY 2018 saved Ohio taxpayers $1.7 billion, or about $9,500 for each voucher recipient. Put another way, for each dollar spent on the program, state and local taxpayers would experience $3.24 in cumulative savings. To save taxpayer dollars in the long run, over 31 percent of students would have to be switchers from public schools.
JON PETERSON SPECIAL NEEDS SCHOLARSHIP PROGRAM
Plan parameters described below were in effect during FY 2018, the latest year in the analysis, and may not reflect provisions currently in place.
The Ohio Jon Peterson Special Needs Scholarship Program provides vouchers to children with special needs enrolled in public schools that allows them to pay for private school tuition and access services from private therapists and other providers. Eligible students must be between ages 5 and 21 and have an IEP from their public school district. Families may use their voucher at public providers if the district accepts the students. Participation in the program is capped at five percent of students with special needs statewide.
The voucher amount is equal to the lesser of a) fees and tuition charged by the new school, b) the amount of state aid determined by the state’s funding formulas for the district, or c) a maximum scholarship amount ranging from $7,598 to $27,000 depending on a student’s special needs category. The amount is reduced proportionately if the child is not enrolled in the alternative or private school for the entire school year. The state sets maximum funding amounts for different types of special needs. The state sets a limit on funding which varies by type of special need. The voucher amount is prorated if a child is not enrolled in the alternative or private school for the full year.
Given the program’s public school prior enrollment requirements, the analysis assumes all students are switchers. The analysis also accounts for the differential cost of providing services to students with special needs. The methods section in the main report discusses further details.
Fiscal Disparity for Jon Peterson Special Needs Scholarship Program
In Ohio, the estimated total cost of public schools per student for students with special needs in FY 2018 was $26,372 and the estimated average variable cost per student for students with special needs was $21,314. The average voucher amount was $9,913, or just 38 percent of the total per-student cost for the public school system. The average per-student cost of the program is significantly less than the average per-student variable cost and indicates that that the program is generating cost savings for taxpayers and school districts when students leave the public school system.
Fiscal Impact
Because the program has been in operation for six years, fiscal effects are likely closer to the upper bound estimates.
Lower bound estimates: Lower bound estimates suggest that in the short run, the Jon Peterson Special Needs Scholarship Program generated $195 million in cumulative net fiscal benefits for Ohio taxpayers, or about $8,800 for each voucher recipient through FY 2018. Put another way, for each dollar spent on the program, state and local taxpayers experienced $1.94 in cumulative savings. To save taxpayer dollars in the short run, over 52 percent of students would have to be switchers from public schools.
Upper bound estimates: Upper bound estimates suggest that in the long run, the Jon Peterson Special Needs Scholarship Program’s existence through FY 2018 saved Ohio taxpayers $311 million, or about $14,100 for each voucher recipient. Put another way, for each dollar spent on the program, state and local taxpayers would experience $2.50 in cumulative savings. To save taxpayer dollars in the long run, over 40 percent of students would have to be switchers from public schools.
INCOME-BASED SCHOLARSHIP PROGRAM
Plan parameters described below were in effect during FY 2018, the latest year in the analysis, and may not reflect provisions currently in place.
Enacted and launched in 2013, the Ohio Income-Based Scholarship Program offers private school vouchers to students from low- and lower middle-income households. This program and the Educational Choice Scholarship program currently have a combined enrollment cap of 60,000 students. If 90 percent of the cap is reached in any year, it will increase by 5 percent in the subsequent year.
For the 2017–18 school year, students are eligible if they are incoming, first-time students in grades K–4 from families with income no more than 200 percent of the federal poverty level. Those at or below this income level are eligible for maximum vouchers ($4,650) when they first apply and renew their vouchers. All income-qualified K–12 students will be eligible starting in the 2020–21 school year. Only students from low-income families who do not qualify for the Educational Choice Scholarship Program are eligible.
Vouchers are worth up to $4,650 and do not exceed the private school’s actual tuition and fees. Families may receive 75 percent ($3,487) and 50 percent ($2,325) vouchers if they are renewing their child’s Income-Based Scholarship and earn up to 300 percent and 400 percent, respectively, of the federal poverty level.
Prior enrollment in a public school is not a requirement for program eligibility. Thus, it is possible that some students using vouchers would enroll in private school even without this financial assistance. To account for the possibility that some students would have enrolled in non-public schools without the program in place, the analysis uses information from lottery-based studies of voucher programs to inform switcher rates.ii Lower bound and upper bound median and weighted average switcher rate estimates were about 85 percent and 90 percent, respectively. The present analysis cautiously assumes 85 percent for the switcher rate in the program.
Fiscal Disparity for Income-Based Scholarship Program
In Ohio, the estimated total cost of public schools per student in FY 2018 was $15,626 and the estimated average variable cost per student was $9,715. The average voucher amount was $4,097, or just 26 percent of the total per-student cost for the public school system. The average per-student cost of the program is significantly less than the average per-student variable cost and indicates that that the program is generating cost savings for taxpayers and school districts when students leave the public school system.
Fiscal Impact
Because the program has been in operation for five years, fiscal effects are likely closer to the upper bound estimates.
Lower bound estimates: Lower bound estimates suggest that in the short run, the Income-Based Scholarship Program generated $97 million in cumulative net fiscal benefits for Ohio taxpayers, or about $3,600 for each voucher recipient through FY 2018. Put another way, for each dollar spent on the program, state and local taxpayers experienced $1.89 in cumulative savings. To save taxpayer dollars in the short run, over 45 percent of students would have to be switchers from public schools.
Upper bound estimates: Upper bound estimates suggest that in the long run, the Income-Based Scholarship Program’s existence through FY 2018 saved Ohio taxpayers $236 million, or about $8,600 for each voucher recipient. Put another way, for each dollar spent on the program, state and local taxpayers would experience $3.16 in cumulative savings. To save taxpayer dollars in the long run, over 27 percent of students would have to be switchers from public schools.
i The present analysis’s estimate for the cost of educating autistic students are lower than cost estimates for autistic children ages 6-17 reported by a team of researchers in JAMA Pediatrics. This team estimated that the average annual per capita cost of special education for children with autism in 2011 was £27,961 (British pounds-sterling). After converting to 2018 U.S. dollars, this cost becomes $49,944 per child.
Buescher AVS, Cidav Z, Knapp M, Mandell DS (2014). Costs of Autism Spectrum Disorders in the United Kingdom and the United States. JAMA Pediatrics, 168(8):721–728. doi:10.1001/jamapediatrics.2014.210
ii For a summary, please see: Martin F. Lueken (2020), The Fiscal Impact of K-12 Educational Choice: Using Random Assignment Studies of Private School Choice Programs to Infer Student Switcher Rates, Journal of School Choice, published online 3/4/2020 at https://doi.org/10.1080/15582159.2020.1735863
Oklahoma
PROGRAMS INCLUDED IN ANALYSIS
1. Oklahoma Lindsey Nicole Henry Scholarships for Students with Disabilities
2. Oklahoma Equal Opportunity Education Scholarships
FISCAL EFFECTS SINCE INCEPTION OF PROGRAMS THROUGH FY 2018
Short Run Cumulative Net Savings (Cost): $25.1 million
Short Run Cumulative Net Savings (Cost) Per Student: $2,811
Short Run Savings For Each Dollar of Program Expenditure: $1.72
Long Run Cumulative Net Savings (Cost): $54.7 million
Long Run Cumulative Net Savings (Cost) Per Student: $6,126
Long Run Savings For Each Dollar of Program Expenditure: $2.57
LINDSEY NICOLE HENRY SCHOLARSHIPS FOR STUDENTS WITH DISABILITIES PROGRAM
Plan parameters described below were in effect during FY 2018, the latest year in the analysis, and may not reflect provisions currently in place.
The Lindsey Nicole Henry Scholarships for Students with Disabilities Program was enacted in 2010 to provide vouchers for any Oklahoma student with special needs. Students eligible for the program must meet the following conditions:
• have an Individualized Education Plan or Individualized Service Plan, and
• meet one of these conditions:
• attended an Oklahoma public school the prior year,
• is the child of an active-duty member of the armed forces stationed in Oklahoma,
• is in out-of-home placement, or
• was adopted out of state custody.
Students who were previously provided services under an Individual Family Service Plan through the SoonerStart program and, during transition, were evaluated and determined to be eligible for school district services no longer need to have spent the prior school year in attendance at a public school to be eligible. Prior to 2018, out-of-home placement and adoptions out of state custody were not included as eligibility criteria.
The voucher amount is equal to lesser of the state and local funds that would have been spent on the child in his or her public school or the chosen private school’s tuition and fees. A student’s resident school district can keep up to 5 percent of the voucher funds for administrative purposes.
Although it is possible that some students participating in the program would have enrolled in a non-public school setting without financial assistance from the program, this number is likely to be very small given their disadvantaged background and higher education costs. Therefore, the analysis for this program assumes that all students using a voucher are switchers. The analysis also accounts for the differential cost of providing services to students with special needs. The methods section in the main report discusses further details.
Fiscal Disparity for Lindsey Nicole Henry Scholarships for Students with Disabilities Program
In Oklahoma, the estimated total cost of public schools per student for students with special needs in FY 2018 was $15,815 and the estimated average variable cost per student for students with special needs was $11,933. The average voucher amount was $6,624, or just 42 percent of the total per-student cost for the public school system. The average per-student cost of the program is significantly less than the average per-student variable cost and indicates that that the program is generating cost savings for taxpayers and school districts when students leave the public school system.
Fiscal Impact
Because the program has been in operation for eight years, fiscal effects are likely closer to the upper bound estimates.
Lower bound estimates: Lower bound estimates suggest that in the short run, the Lindsey Nicole Henry Scholarships for Students with Disabilities Program generated $13 million in cumulative net fiscal benefits for Oklahoma taxpayers, or about $4,700 for each voucher recipient through FY 2018. Put another way, for each dollar spent on the program, state and local taxpayers experienced $1.68 in cumulative savings. To save taxpayer dollars in the short run, over 60 percent of students would have to be switchers from public schools.
Upper bound estimates: Upper bound estimates suggest that in the long run, the Lindsey Nicole Henry Scholarships for Students with Disabilities Program’s existence through FY 2018 saved Oklahoma taxpayers $22 million, or about $8,300 for each voucher recipient. Put another way, for each dollar spent on the program, state and local taxpayers would experience $2.18 in cumulative savings. To save taxpayer dollars in the long run, over 46 percent of students would have to be switchers from public schools.
EQUAL OPPORTUNITY EDUCATION SCHOLARSHIPS
Plan parameters described below were in effect during FY 2018, the latest year in the analysis, and may not reflect provisions currently in place.
The Oklahoma Equal Opportunity Education Scholarships program was launched in 2013 and provides tax credits for donations to scholarship-granting organizations (SGOs) and education improvement granting organizations (EIGOs). EIGOs disburse grants to public schools. The program is open to students from households with incomes up to 300 percent of the free and reduced-price lunch program or who attend or live in the attendance zone of a public school designated by the state as “in need of improvement.”
Students with special needs who attended a public school with an Individualized Education Plan (IEP) may receive scholarships worth up to $25,000. Students without an IEP may receive scholarships worth up to $5,000 or 80 percent of the average per-pupil expenditure in their assigned public school district, whichever is greater.
The program is capped at $5 million, of which $3.5 million is dedicated to private school scholarships with a separate $1.5 million in tax credits available for donations made to organizations that distribute “educational improvement grants” to public schools. The allowable tax credit is 50 percent of the amount of contributions made during a taxable year, up to $1,000 for single individuals, $2,000 for married couples and $100,000 for corporations (including S-Corporations). The tax credit value is 75 percent for taxpayers who make a written commitment to contribute the same amount to an SGO for two consecutive years.
Prior enrollment in a public school is not a requirement for program eligibility. Thus, it is possible that some scholarship recipients would enroll in private school even without this financial assistance. It is impossible to know exactly how many students in the program would be switchers, however, and data on prior enrollment are not available. To account for the possibility that some students would have enrolled in non-public schools without the program in place, the analysis uses information from lottery-based studies of voucher programs to inform switcher rates.i Lower bound and upper bound median and weighted average switcher rate estimates were about 85 percent and 90 percent, respectively. The present analysis cautiously assumes 85 percent for the switcher rate in the program.
The analysis assumes that scholarship recipients do not have special needs. While the costs of tax credit disbursements for the program are incorporated in full, savings associated with special needs students are not reflected in full. Thus, to the extent that there are any students in the program with special needs, the fiscal effects estimates will understate any savings.
Fiscal Disparity for Equal Opportunity Education Scholarships
In Oklahoma, the estimated total cost of public schools per student in FY 2018 was $9,414 and the estimated average variable cost per student was $5,464. The average amount of tax credit disbursements was $1,872, or just 20 percent of the total per-student cost for the public school system. The average per-student cost of the program is significantly less than the average per-student variable cost and indicates that that the program is generating cost savings for taxpayers and school districts when students leave the public school system.
Fiscal Impact
Because the program has been in operation for six years, fiscal effects are likely closer to the upper bound estimates.
Lower bound estimates: Lower bound estimates suggest that in the short run, the Equal Opportunity Education Scholarships program generated $12 million in cumulative net fiscal benefits for Oklahoma taxpayers, or about $2,000 for each scholarship student through FY 2018. Put another way, for each dollar spent on the program, state and local taxpayers experienced $1.77 in cumulative savings. To save taxpayer dollars in the short run, over 48 percent of students would have to be switchers from public schools.
Upper bound estimates: Upper bound estimates suggest that in the long run, the Equal Opportunity Education Scholarships program’s existence through FY 2018 saved Oklahoma taxpayers $33 million, or about $5,200 for each scholarship student. Put another way, for each dollar spent on the program, state and local taxpayers would experience $3.02 in cumulative savings. To save taxpayer dollars in the long run, over 28 percent of students would have to be switchers from public schools.
Pennsylvania
PROGRAMS INCLUDED IN ANALYSIS
1. Pennsylvania Educational Improvement Tax Credit Program
2. Pennsylvania Opportunity Scholarship Tax Credit Program
FISCAL EFFECTS SINCE INCEPTION OF PROGRAMS THROUGH FY 2018
Short Run Cumulative Net Savings (Cost): $4.1 billion
Short Run Cumulative Net Savings (Cost) Per Student: $6,364
Short Run Savings For Each Dollar of Program Expenditure: $5.31
Long Run Cumulative Net Savings (Cost): $8.1 billion
Long Run Cumulative Net Savings (Cost) Per Student: $12,499
Long Run Savings For Each Dollar of Program Expenditure: $9.46
EDUCATIONAL IMPROVEMENT TAX CREDIT PROGRAM
Plan parameters described below were in effect during FY 2018, the latest year in the analysis, and may not reflect provisions currently in place.
The Educational Improvement Tax Credit (EITC) Program is one of two tax-credit scholarship programs in Pennsylvania. The program provides tax credits for corporate contributions to scholarship organizations (SOs), nonprofits that provide private school scholarships; educational improvement organizations (EIOs), nonprofits that support innovative programs in public schools; and/ or prekindergarten scholarship organizations (PKSOs). This analysis accounts for the tax credits claimed for donations to organizations that provide scholarships to attend private K–12 schools. It excludes tax credits awarded for donations to PKSOs and EIOs.
Children are eligible to participate in the program if their household income is less than $77,648 plus $15,530 for each child in the household in 2017–18. Thus, the income-eligibility limit for an only child is $93,178. The income-eligibility criterion for a student from a two-child household is $108,708. Income criteria increase each year to account for inflation.
Corporations that make donations to qualifying SOs may claim 75 cents for each dollar they donate. If they commit to at least two consecutive years of donations, then the value of the tax credit increases to 90 percent. There is a limit on the amount of claimable tax credits for donors. The amount of tax credits the state may give out each year for the EITC was capped at $135 million in 2019-20. The total amount of credits available for donations to SOs that year was $85 million.
Prior enrollment in a public school is not a requirement for program eligibility. Thus, it is possible that some scholarship recipients would enroll in private school even without this financial assistance. It is impossible to know exactly how many students in the program would be switchers, however, and data on prior enrollment are not available. To account for the possibility that some students would have enrolled in non-public schools without the program in place, the analysis uses information from lottery-based studies of voucher programs to inform switcher rates.i Lower bound and upper bound median and weighted average switcher rate estimates were about 85 percent and 90 percent, respectively. The present analysis cautiously assumes 85 percent for the switcher rate in the program.
Fiscal Disparity for Educational Improvement Tax Credit Program
In Pennsylvania, the estimated total cost of public schools per student in FY 2018 was $20,083 and the estimated average variable cost per student was $13,057. The average amount of tax credit disbursements was $2,076, or just 10 percent of the total per-student cost for the public school system. The average per-student cost of the program is significantly less than the average per-student variable cost and indicates that that the program is generating cost savings for taxpayers and school districts when students leave the public school system.
Fiscal Impact
Because the program has been in operation for 17 years, fiscal effects are likely closer to the upper bound estimates.
Lower bound estimates: Lower bound estimates suggest that in the short run, the Educational Improvement Tax Credit Program generated $3.7 billion in cumulative net fiscal benefits for Pennsylvania taxpayers, or about $6,400 for each scholarship student through FY 2018. Put another way, for each dollar spent on the program, state and local taxpayers experienced $6.03 in cumulative savings. To save taxpayer dollars in the short run, over just 14 percent of students would have to be switchers from public schools.
Upper bound estimates: Upper bound estimates suggest that in the long run, the Educational Improvement Tax Credit Program’s existence through FY 2018 saved Pennsylvania taxpayers $7.2 billion, or about $12,500 for each scholarship student. Put another way, for each dollar spent on the program, state and local taxpayers would experience $10.80 in cumulative savings. To save taxpayer dollars in the long run, over just 8 percent of students would have to be switchers from public schools.
OPPORTUNITY SCHOLARSHIP TAX CREDIT PROGRAM
Plan parameters described below were in effect during FY 2018, the latest year in the analysis, and may not reflect provisions currently in place.
The Pennsylvania Opportunity Scholarship Tax Credit Program provides tax credits for corporate contributions to scholarship organizations (SOs), nonprofits that provide private school scholarships.
Students are eligible for the program if they live in a “low-achieving” school zone defined as the state’s bottom 15 percent of public schools based on standardized test scores. In addition, students must come from a family whose household income is less than $77,648 plus $15,230 for each child in the household in 2019-20. For example, the income-eligibility limit for an only child is $92,878 and the income-eligibility criterion for a student from a two-child household is $108,108. Income criteria increase each year to account for inflation.
Corporations that make donations to SOs may claim 75 cents for each dollar they donate. If they commit to at least two consecutive years of donations, then the value of the tax credit increases to 90 percent. Total tax credit disbursements were capped at $50 million for 2017–18.
Scholarships may be worth up to $8,500 or a school’s tuition and fees, whichever is less. Students with special needs may receive up to $15,000.
SOs must give preference to students who received scholarships the previous year, those eligible for free and reduced-price lunch (FRL) and FRL students in certain school districts (a “first class” school district, a district with more than 7,500 students that receives an advance of its basic education subsidy or a school district that has both received an advance of its subsidy and is either in financial distress or is involved in a school finance lawsuit against the state).
Prior enrollment in a public school is not a requirement for program eligibility. Thus, it is possible that some scholarship recipients would enroll in private school even without this financial assistance. It is impossible to know exactly how many students in the program would be switchers, however, and data on prior enrollment are not available. To account for the possibility that some students would have enrolled in non-public schools without the program in place, the analysis uses information from lottery-based studies of voucher programs to inform switcher rates.ii Lower bound and upper bound median and weighted average switcher rate estimates were about 85 percent and 90 percent, respectively. The present analysis cautiously assumes 85 percent for the switcher rate in the program.
Fiscal Disparity for Opportunity Scholarship Tax Credit Program
In Pennsylvania, the estimated total cost of public schools per student in FY 2018 was $20,083 and the estimated average variable cost per student was $13,057. The average amount of tax credit disbursements was $3,257, or just 16 percent of the total per-student cost for the public school system. The average per-student cost of the program is significantly less than the average per-student variable cost and indicates that that the program is generating cost savings for taxpayers and school districts when students leave the public school system.
Fiscal Impact
Because the program has been in operation for six years, fiscal effects are likely closer to the upper bound estimates.
Lower bound estimates: Lower bound estimates suggest that in the short run, the Opportunity Scholarship Tax Credit Program generated $391 million in cumulative net fiscal benefits for Pennsylvania taxpayers, or about $6,100 for each scholarship student through FY 2018. Put another way, for each dollar spent on the program, state and local taxpayers experienced $2.82 in cumulative savings. To save taxpayer dollars in the short run, over just 30 percent of students would have to be switchers from public schools.
Upper bound estimates: Upper bound estimates suggest that in the long run, the Opportunity Scholarship Tax Credit Program’s existence through FY 2018 saved Pennsylvania taxpayers $827 million, or about $12,900 for each scholarship student. Put another way, for each dollar spent on the program, state and local taxpayers would experience $4.86 in cumulative savings. To save taxpayer dollars in the long run, over just 17 percent of students would have to be switchers from public schools.
i For a summary, please see: Martin F. Lueken (2020), The Fiscal Impact of K-12 Educational Choice: Using Random Assignment Studies of Private School Choice Programs to Infer Student Switcher Rates, Journal of School Choice, published online 3/4/2020 at https://doi.org/10.1080/15582159.2020.1735863
ii For a summary, please see: Martin F. Lueken (2020), The Fiscal Impact of K-12 Educational Choice: Using Random Assignment Studies of Private School Choice Programs to Infer Student Switcher Rates, Journal of School Choice, published online 3/4/2020 at https://doi.org/10.1080/15582159.2020.1735863
Rhode Island
PROGRAMS INCLUDED IN ANALYSIS
1. Rhode Island Tax Credits for Contributions to Scholarship Organizations
FISCAL EFFECTS SINCE INCEPTION OF PROGRAMS THROUGH FY 2018
Short Run Cumulative Net Savings (Cost): $33.5 million
Short Run Cumulative Net Savings (Cost) Per Student: $6,903
Short Run Savings For Each Dollar of Program Expenditure: $3.33
Long Run Cumulative Net Savings (Cost): $54.0 million
Long Run Cumulative Net Savings (Cost) Per Student: $11,120
Long Run Savings For Each Dollar of Program Expenditure: $4.76
TAX CREDITS FOR CONTRIBUTIONS TO SCHOLARSHIP ORGANIZATIONS
Plan parameters described below were in effect during FY 2018, the latest year in the analysis, and may not reflect provisions currently in place.
Rhode Island’s Tax Credits for Contributions to Scholarship Organizations Program is an income-based program, meaning that eligible students must come from households with incomes that do not exceed 250 percent of the federal poverty level.
Corporations that make donations to scholarship-granting organizations may receive 75 cents in tax credits for each dollar donated. If a donor commits to two consecutive years of donations and if the amount of donations in the second year is at least 80 percent of the first year’s donations, then the tax credit value increases to 90 percent. The amount of claimable tax credit by a donor is capped, and the program is limited to granting no more than $1.5 million in tax credits each year. Tax credits for each corporate donor are capped at $100,000 each year, and surplus donations cannot generate rollovers.
Prior enrollment in a public school is not a requirement for program eligibility. Thus, it is possible that some scholarship recipients would enroll in private school even without this financial assistance. It is impossible to know exactly how many students in the program would be switchers, however, and data on prior enrollment are not available. To account for the possibility that some students would have enrolled in non-public schools without the program in place, the analysis uses information from lottery-based studies of voucher programs to inform switcher rates.i Lower bound and upper bound median and weighted average switcher rate estimates were about 85 percent and 90 percent, respectively. The present analysis cautiously assumes 85 percent for the switcher rate in the program.
The analysis estimates tax support as the lesser of 90 percent of total donations received each year or the tax credit cap. The tax credit value for donors who have not committed to two years of donations is 75 percent of donations. Thus, estimated savings may be higher than actual savings.
Rhode Island’s program has resulted in high savings per student. Its low tax credit cap, however, has severely limited participation in the program and, therefore, limited low-income students who might desire an alternative to receiving an education in their assigned district schools.
Fiscal Disparity for Tax Credits for Contributions to Scholarship Organizations
In Rhode Island, the estimated total cost of public schools per student in FY 2018 was $18,768 and the estimated average variable cost per student was $12,980. The average amount of tax credit disbursements was $3,576, or just 19 percent of the total per-student cost for the public school system. The average per-student cost of the program is significantly less than the average per-student variable cost and indicates that that the program is generating cost savings for taxpayers and school districts when students leave the public school system.
Fiscal Impact
Because the program has been in operation for 12 years, fiscal effects are likely closer to the upper bound estimates.
Lower bound estimates: Lower bound estimates suggest that in the short run, the Tax Credits for Contributions to Scholarship Organizations program generated $34 million in cumulative net fiscal benefits for Rhode Island taxpayers, or about $6,900 for each scholarship student through FY 2018. Put another way, for each dollar spent on the program, state and local taxpayers experienced $3.33 in cumulative savings. To save taxpayer dollars in the short run, over just 25 percent of students would have to be switchers from public schools.
Upper bound estimates: Upper bound estimates suggest that in the long run, the Tax Credits for Contributions to Scholarship Organizations program’s existence through FY 2018 saved Rhode Island taxpayers $54 million, or about $11,100 for each scholarship student. Put another way, for each dollar spent on the program, state and local taxpayers would experience $4.76 in cumulative savings. To save taxpayer dollars in the long run, over just 18 percent of students would have to be switchers from public schools.
i For a summary, please see: Martin F. Lueken (2020), The Fiscal Impact of K-12 Educational Choice: Using Random Assignment Studies of Private School Choice Programs to Infer Student Switcher Rates, Journal of School Choice, published online 3/4/2020 at https://doi.org/10.1080/15582159.2020.1735863
South Carolina
PROGRAMS INCLUDED IN ANALYSIS
1. South Carolina Educational Credit for Exceptional Needs Children
FISCAL EFFECTS SINCE INCEPTION OF PROGRAMS THROUGH FY 2018
Short Run Cumulative Net Savings (Cost): $62.0 million
Short Run Cumulative Net Savings (Cost) Per Student: $7,823
Short Run Savings For Each Dollar of Program Expenditure: $2.46
Long Run Cumulative Net Savings (Cost): $99.8 million
Long Run Cumulative Net Savings (Cost) Per Student: $12,583
Long Run Savings For Each Dollar of Program Expenditure: $3.34
EDUCATIONAL CREDIT FOR EXCEPTIONAL NEEDS CHILDREN
Plan parameters described below were in effect during FY 2018, the latest year in the analysis, and may not reflect provisions currently in place.
South Carolina’s Educational Credit for Exceptional Needs Children Program provides scholarships for students who have been designated by the South Carolina Department of Education as meeting the federal definition of a “child with a disability.” Additionally, students are also eligible for the program if they were diagnosed by a licensed healthcare provider with a qualified impairment within the last three years.
Scholarship awards may be up to the lesser of $11,000 or the cost of tuition and qualified expenses. Scholarships may be used for school tuition, transportation, textbook expenses, or any combination of these uses.
Individuals, partnerships, corporations, and similar entities may claim a 100 percent tax credit for contributions to a dedicated fund for scholarships. Tax credits may be worth up to 60 percent of a donor’s tax liability. The amount of tax credits that may be awarded in 2017–18 was capped at $11 million.
Although it is possible that some students participating in the program would have enrolled in a non-public school setting without financial assistance from the program, this number is likely to be very small given their disadvantaged background and higher education costs. The analysis takes a very cautious approach by assuming that 90 percent students in the program are switchers. The analysis also accounts for the differential cost of providing services to students with special needs. The methods section in the main report discusses further details.
Fiscal Disparity for Educational Credit for Exceptional Needs Children
In South Carolina, the estimated total cost of public schools per student for students with special needs in FY 2018 was $21,048 and the estimated average variable cost per student for students with special needs was $15,615. The average amount of tax credit disbursements was $4,727, or just 22 percent of the total per-student cost for the public school system. The average per-student cost of the program is significantly less than the average per-student variable cost and indicates that that the program is generating cost savings for taxpayers and school districts when students leave the public school system.
Fiscal Impact
Because the program has been in operation for five years, fiscal effects are likely closer to the upper bound estimates.
Lower bound estimates: Lower bound estimates suggest that in the short run, the Educational Credit for Exceptional Needs Children Program generated $62 million in cumulative net fiscal benefits for South Carolina taxpayers, or about $7,800 for each scholarship student through FY 2018. Put another way, for each dollar spent on the program, state and local taxpayers experienced $2.46 in cumulative savings. To save taxpayer dollars in the short run, over 37 percent of students would have to be switchers from public schools.
Upper bound estimates: Upper bound estimates suggest that in the long run, the Educational Credit for Exceptional Needs Children Program’s existence through FY 2018 saved South Carolina taxpayers $100 million, or about $12,600 for each scholarship student. Put another way, for each dollar spent on the program, state and local taxpayers would experience $3.34 in cumulative savings. To save taxpayer dollars in the long run, over 27 percent of students would have to be switchers from public schools.
Utah
PROGRAMS INCLUDED IN ANALYSIS
1. Utah Carson Smith Special Needs Scholarship
FISCAL EFFECTS SINCE INCEPTION OF PROGRAMS THROUGH FY 2018
Short Run Cumulative Net Savings (Cost): $31.7 million
Short Run Cumulative Net Savings (Cost) Per Student: $3,706
Short Run Savings For Each Dollar of Program Expenditure: $1.76
Long Run Cumulative Net Savings (Cost): $55.0 million
Long Run Cumulative Net Savings (Cost) Per Student: $6,434
Long Run Savings For Each Dollar of Program Expenditure: $2.32
CARSON SMITH SPECIAL NEEDS SCHOLARSHIPS PROGRAM
Plan parameters described below were in effect during FY 2018, the latest year in the analysis, and may not reflect provisions currently in place.
Launched in 2005, the Carson Smith Special Needs Scholarships Program provides voucher for students with disabilities to attend private school. Funding for the program was capped at $5.1 million for 2017–18, significantly limiting the size of the program.
Public school students between ages 3 and 21 identified as disabled under federal disability rights law are eligible to receive vouchers. Students with special needs in private schools that served students with disabilities prior to participating in the program are also eligible.
Vouchers are determined by the state’s weighted pupil unit, an element of its school financing formula. Students who receive three or more hours of special education services per day get vouchers worth 2.5 times the weighted pupil unit, whereas students receiving fewer than three hours per day get vouchers worth 1.5 times the weighted pupil unit. In 2017–18, those values amount to $8,278 and $4,967, respectively. The voucher may not exceed the private school’s actual tuition and fees.
Although it is possible that some students participating in the program would have enrolled in a non-public school setting without financial assistance from the program, this number is likely to be very small given their disadvantaged background and higher education costs. The analysis takes a very cautious approach by assuming that 90 percent students in the program are switchers. The analysis also accounts for the differential cost of providing services to students with special needs. The methods section in the main report discusses further details.
Fiscal Disparity for Carson Smith Special Needs Scholarships Program
In Utah, the estimated total cost of public schools per student for students with special needs in FY 2018 was $14,794 and the estimated average variable cost per student for students with special needs was $11,286. The average voucher amount was $5,816, or just 39 percent of the total per-student cost for the public school system. The average per-student cost of the program is significantly less than the average per-student variable cost and indicates that that the program is generating cost savings for taxpayers and school districts when students leave the public school system.
Fiscal Impact
Because the program has been in operation for 13 years, fiscal effects are likely closer to the upper bound estimates.
Lower bound estimates: Lower bound estimates suggest that in the short run, the Carson Smith Special Needs Scholarships Program generated $32 million in cumulative net fiscal benefits for Utah taxpayers, or about $3,700 for each voucher recipient through FY 2018. Put another way, for each dollar spent on the program, state and local taxpayers experienced $1.76 in cumulative savings. To save taxpayer dollars in the short run, over 51 percent of students would have to be switchers from public schools.
Upper bound estimates: Upper bound estimates suggest that in the long run, the Carson Smith Special Needs Scholarships Program’s existence through FY 2018 saved Utah taxpayers about $55 million, or about $6,400 for each voucher recipient. Put another way, for each dollar spent on the program, state and local taxpayers would experience $2.32 in cumulative savings. To save taxpayer dollars in the long run, over 39 percent of students would have to be switchers from public schools.
Virginia
PROGRAMS INCLUDED IN ANALYSIS
1. Virginia Education Improvement Scholarships Tax Credits Program
FISCAL EFFECTS SINCE INCEPTION OF PROGRAMS THROUGH FY 2018
Short Run Cumulative Net Savings (Cost): $77.9 million
Short Run Cumulative Net Savings (Cost) Per Student: $6,444
Short Run Savings For Each Dollar of Program Expenditure: $4.49
Long Run Cumulative Net Savings (Cost): $131.6 million
Long Run Cumulative Net Savings (Cost) Per Student: $10,889
Long Run Savings For Each Dollar of Program Expenditure: $6.90
EDUCATION IMPROVEMENT SCHOLARSHIPS TAX CREDITS PROGRAM
Plan parameters described below were in effect during FY 2018, the latest year in the analysis, and may not reflect provisions currently in place.
Virginia’s Education Improvement Scholarships Tax Credits Program provides tax credits to individual and business taxpayers for donations to scholarship organizations that provide private school scholarships.
Students are eligible for the program if their household income is less than 300 percent of the federal poverty level. Income eligibility for students with special needs is 400 percent of the federal poverty level. Students must have been enrolled in public school the previous year or be a previous scholarship recipient. Exceptions to the public school enrollment requirement include students enrolled in kindergarten or first grade.
Scholarship funding for students are limited. For students without special needs, scholarship funding may not exceed the lesser of actual education expenses or the per-pupil amount the state distributes to the local public school.
Tax credits are worth 65 cents for each dollar donated, and the program caps the amount of available tax credits at $25 million each year. Individual taxpayers must donate a minimum of $500, and donations may not exceed $125,000 per year. The program does not place any constraints on donations from businesses.
It is possible that some scholarship recipients in kindergarten or first grade would enroll in private school even without financial assistance from the scholarship program. It is impossible to know exactly how many students in the program would be switchers, however, and data on prior enrollment are not available. The analysis makes an adjustment to account for potential non-switchers by cautiously assuming that 85 percent of students from these groups were switchers.i The methods section in the main report discusses further details.
The analysis adds another layer of caution by assuming that all scholarship recipients generate the same funding as students without special needs. While it factors in the full cost for all students participating in the program (i.e., total tax credit disbursements), it does not account for any potential offsetting costs from students with special needs. Thus, to the extent that students with special needs participate in the program and are switchers, estimates in this analysis will understate fiscal benefits from the program.
Fiscal Disparity for Education Improvement Scholarships Tax Credits Program
In Virginia, the estimated total cost of public schools per student in FY 2018 was $13,450 and the estimated average variable cost per student was $8,908. The average amount of tax credit disbursements was $1,831, or just 14 percent of the total per-student cost for the public school system. The average per-student cost of the program is significantly less than the average per-student variable cost and indicates that that the program is generating cost savings for taxpayers and school districts when students leave the public school system.
Fiscal Impact
Because the program has been in operation for six years, fiscal effects are likely closer to the upper bound estimates.
Lower bound estimates: Lower bound estimates suggest that in the short run, the Education Improvement Scholarships Tax Credits Program generated $78 million in cumulative net fiscal benefits for Virginia taxpayers, or about $6,400 for each scholarship student through FY 2018. Put another way, for each dollar spent on the program, state and local taxpayers experienced $4.49 in cumulative savings. To save taxpayer dollars in the short run, over just 22 percent of students would have to be switchers from public schools.
Upper bound estimates: Upper bound estimates suggest that in the long run, the Education Improvement Scholarships Tax Credits Program’s existence through FY 2018 saved Virginia taxpayers $132 million, or about $10,900 for each scholarship student. Put another way, for each dollar spent on the program, state and local taxpayers would experience $6.90 in cumulative savings. To save taxpayer dollars in the long run, over just 14 percent of students would have to be switchers from public schools.
Wisconsin
PROGRAMS INCLUDED IN ANALYSIS
1. Wisconsin Milwaukee Parental Choice
2. Wisconsin Parental Private School Choice Program (Racine)
3. Wisconsin Parental Choice Program (Statewide)
FISCAL EFFECTS SINCE INCEPTION OF PROGRAMS THROUGH FY 2018
Short Run Cumulative Net Savings (Cost): $381.4 million
Short Run Cumulative Net Savings (Cost) Per Student: $1,065
Short Run Savings For Each Dollar of Program Expenditure: $1.16
Long Run Cumulative Net Savings (Cost): $2.2 billion
Long Run Cumulative Net Savings (Cost) Per Student: $6,048
Long Run Savings For Each Dollar of Program Expenditure: $1.93
MILWAUKEE PARENTAL CHOICE PROGRAM
Plan parameters described below were in effect during FY 2018, the latest year in the analysis, and may not reflect provisions currently in place.
Enacted in 1990, the Milwaukee Parental Choice Program (MPCP) is the nation’s first modern school voucher program. As it has experienced various policy changes over time, the MPCP has been ripe for researchers to study the effects of private school choice program. Indeed, it may be the most studied private school choice programs (and possibly one of the most politically contentious). The program has enjoyed significant growth, the result of several modifications to the program that expanded eligibility. For example, in 1998 the Wisconsin Legislature opened the program to allow parents to choose religious as well as secular private schools.
The program is open to some families in the middle class. Milwaukee families that earn up to 300 percent of the federal poverty guidelines qualify to receive vouchers. The income limit increases by $7,000 for married households. Students who are continuing the program from previous years and those who were on a school’s waiting list in the prior year because the school did not have space available do not need to demonstrate income eligibility. Once a student receives a voucher, that student can keep it, regardless of his or her family’s future income.
In 2017–18, the maximum voucher amounts were $7,530 for grades K–8 and $8,176 for grades 9–12. Each school year, maximum voucher payments increase by a dollar amount equal to the dollar-amount increase in general school aid to Wisconsin public schools. Parents of students in grades 9–12 that have an income greater than 220 percent of the federal poverty level may be charged additional tuition above the voucher amount.
Because the MPCP is open to students enrolled in both public and private schools, any fiscal analysis of the program should account for the likelihood that some students using vouchers would have enrolled in a non-public school setting without financial assistance from the program. The analysis for this program assumes that 90 percent for students would likely enroll in public schools without financial assistance from the program. There are two sources that back up this assumption.i First, work by Robert M. Costrell at the University of Arkansas suggested a 90 percent switcher rate.ii This rate is also in line with overall switcher rate estimates reported in a more recent study that analyzed information from lottery-based random assignment studies of voucher programs for inferring switcher rates.iii Notably, Costrell demonstrated that the fiscal effects from the MPCP are distributed unevenly among local taxpayers inside and outside of Milwaukee such that local taxpayers in Milwaukee have incurred fiscal costs while local taxpayers outside of Milwaukee incurred fiscal benefits. Known as the “funding flaw,” this feature will be phased out by 2024-25.iv The fiscal effects estimates reported below represent the combined net fiscal effect for all state and local taxpayers in Wisconsin.
Fiscal Disparity for Milwaukee Parental Choice Program
For Milwaukee Public Schools, the estimated total cost per student in FY 2018 was $15,648 and the estimated average variable cost per student was $9,688. The average voucher amount was $7,503, or just 48 percent of the total per-student cost for the school district. The average per-student cost of the program is significantly less than the average per-student variable cost and indicates that that the program is generating cost savings for taxpayers and school districts when students leave the public school system.
Fiscal Impact
Because the program has been in operation for 28 years, fiscal effects are likely closer to the upper bound estimates.
Lower bound estimates: Lower bound estimates suggest that in the short run, the MPCP generated $376 million in cumulative net fiscal benefits for Wisconsin taxpayers, or about $1,100 for each voucher recipient through FY 2018. Put another way, for each dollar spent on the program, state and local taxpayers experienced $1.17 in cumulative savings. To save taxpayer dollars in the short run, over 77 percent of students would have to be switchers from public schools.
Upper bound estimates: Upper bound estimates suggest that in the long run, the MPCP’s existence through FY 2018 saved Wisconsin taxpayers $2.1 billion, or about $6,100 for each voucher recipient. Put another way, for each dollar spent on the program, state and local taxpayers would experience $1.94 in cumulative savings. To save taxpayer dollars in the long run, over 45 percent of students would have to be switchers from public schools.
RACINE PARENTAL CHOICE PROGRAM
Plan parameters described below were in effect during FY 2018, the latest year in the analysis, and may not reflect provisions currently in place.
The Racine Parental Choice Program was enacted in 2011 to provide vouchers for students to attend a private school of their choosing. Students must be from families with household incomes at or below 300 percent of the federal poverty level. For married parents or legal guardians, this threshold is $7,000 higher. In addition, eligible students must meet one of the following requirements:
• have attended a Racine Unified School District school or home school in the prior year;
• not enrolled in school in the prior year;
• enrolled in a private school under the voucher program in the prior year; or
• be entering kindergarten, first grade, or ninth grade.
The voucher amount in 2017–18 was $7,230 for students in grades K-8 and $8,176 for students in grades 9-12. Annual increases in the voucher amount is tied to increases in funding for Wisconsin public schools. Private schools may charge additional tuition above the voucher amount if students are in grades 9-12 and come from families with household incomes greater than 220 percent of the federal poverty limit.
Data to allow for a proper estimate of switcher rates were not readily available from the Wisconsin Department of Public Instruction (DPI). The DPI reports where students were enrolled in the prior year, but this way of reporting prior enrollment does not provide a reliable estimate for switchers.v The reason is that a student who signed up for the program and came from a public school in one year will be counted as incoming from a private school for ensuing years in the program.
It is possible that some students in kindergarten, first grade, ninth grade, from out of state, and not enrolled in school the prior year would have enrolled in a non-public school setting without financial assistance from the program. The analysis makes an adjustment to account for potential non-switchers by cautiously assuming that 85 percent of students from these groups were switchers. The methods section in the main report discusses further details.
Fiscal Disparity for Racine Parental Choice Program
For Racine Public Schools, the estimated total cost per student in FY 2017 was $15,393 and the estimated average variable cost per student was $9,272. The average voucher amount was $7,447, or 48 percent of the total per-student cost for the school district. The average per-student cost of the program is significantly less than the average per-student variable cost and indicates that that the program is generating cost savings for taxpayers and school districts when students leave the public school system.
Fiscal Impact
Because the program has been in operation for seven years, fiscal effects are likely closer to the upper bound estimates.
Lower bound estimates: Lower bound estimates suggest that in the short run, the Racine Parental Choice Program generated $10 million in cumulative net fiscal benefits for Wisconsin taxpayers, or about $1,300 for each voucher recipient through FY 2018. Put another way, for each dollar spent on the program, state and local taxpayers experienced $1.18 in cumulative savings. To save taxpayer dollars in the short run, over 80 percent of students would have to be switchers from public schools.
Upper bound estimates: Upper bound estimates suggest that in the long run, the Racine Parental Choice Program’s existence through FY 2018 saved Wisconsin taxpayers $55 million, or about $6,900 for each voucher recipient. Put another way, for each dollar spent on the program, state and local taxpayers would experience $1.97 in cumulative savings. To save taxpayer dollars in the long run, over 48 percent of students would have to be switchers from public schools.
PARENTAL CHOICE PROGRAM (STATEWIDE)
Plan parameters described below were in effect during FY 2018, the latest year in the analysis, and may not reflect provisions currently in place.
Wisconsin’s statewide parental choice program is designed to serve families who reside outside attendance zones for Milwaukee Public Schools and the Racine Unified School District. Students from families with income no more than 220 percent of the federal poverty level are eligible. In addition, a family’s income limit increases by $7,000 if the student’s parents or legal guardians are married. For 2017–18, participation in the program was limited to 2 percent of a public school district’s enrollment. This cap increases by 1 percentage point each year until the enrollment limit reaches 10 percent, then there will no longer be a cap.
The maximum voucher amount in 2017–18 was equal to $7,530 for students in grades K-8 and $8,176 for students in grades 9-12. Annual increases in the voucher amount is tied to increases in funding for Wisconsin public schools.
Data to allow for a proper estimate of switcher rates were not readily available from the Wisconsin Department of Public Instruction (DPI). The DPI reports where students were enrolled in the prior year, but this way of reporting prior enrollment does not provide a reliable estimate for switchers.i The reason is that a student who signed up for the program and came from a public school in one year will be counted as incoming from a private school for ensuing years in the program.
Prior enrollment in a public school is not a requirement for program eligibility. Thus, it is possible that some scholarship recipients would enroll in private school even without this financial assistance. It is impossible to know exactly how many students in the program would be switchers, however, and data on prior enrollment are not available. To account for the possibility that some students would have enrolled in non-public schools without the program in place, the analysis uses information from lottery-based studies of voucher programs to inform switcher rates.ii Lower bound and upper bound median and weighted average switcher rate estimates were about 85 percent and 90 percent, respectively. The present analysis cautiously assumes 85 percent for the switcher rate in the program.
Fiscal Disparity for Wisconsin Parental Choice Program
In Wisconsin, the estimated total cost of public schools per student in FY 2018 was $14,631 and the estimated average variable cost per student was $8,454. The average voucher amount was $7,712, or 53 percent of the total per-student cost for the public school system. The average per-student cost of the program is less than the average per-student variable cost and indicates that that the program is generating cost savings for taxpayers and school districts when students leave the public school system.
Fiscal Impact
Because the program has been in operation for five years, fiscal effects are likely closer to the upper bound estimates.
Lower bound estimates: Lower bound estimates suggest that in the short run, the Wisconsin Parental Choice Program generated an estimated cumulative net fiscal cost for Wisconsin taxpayers worth an estimated $5 million, or about $500 for each voucher recipient through FY 2018. Put another way, for each dollar spent on the program, state and local taxpayers experienced $0.94 in cumulative savings. To save taxpayer dollars in the short run, over 91 percent of students would have to be switchers from public schools.
Upper bound estimates: Upper bound estimates suggest that in the long run, the Wisconsin Parental Choice Program’s existence through FY 2018 saved Wisconsin taxpayers $50 million, or about $4,400 for each voucher recipient. Put another way, for each dollar spent on the program, state and local taxpayers would experience $1.59 in cumulative savings. To save taxpayer dollars in the long run, over 54 percent of students would have to be switchers from public schools.
i Data on New Hampshire’s tax-credit scholarship program also support this assumption. New Hampshire’s program has the same income eligibility requirements and does not require prior enrollment in public schools. Publicly reported data on where students were enrolled prior to entering this program suggest annual switcher rates ranging from 90 percent to 98 percent.
ii Robert M. Costrell (2010), The Fiscal Impact of the Milwaukee Parental Choice Program: 2010-2011 Update and Policy Options, (Report #22, School Choice Demonstration Project), SCDP Milwaukee Evaluation, retrieved from the University of Arkansas: http://www.uaedreform.org/downloads/2011/03/report-22-the-fiscal-impact-of-the-milwaukee-parental-choice-program-2010-2011-update-and-policy-options.pdf
iii For a summary, please see: Martin F. Lueken (2020). The Fiscal Impact of K-12 Educational Choice: Using Random Assignment Studies of Private School Choice Programs to Infer Student Switcher Rates, Journal of School Choice, published online at: https://doi.org/10.1080/15582159.2020.1735863
iv Christina Pugh (2015), Private School Choice Programs (Informational Paper 25), Wisconsin Legislative Fiscal Bureau, retrieved from: http://docs.legis.wisconsin.gov/misc/lfb/informational_papers/january_2015/0025_private_school_choice_programs_informational_paper_25.pdf.
v Wisconsin Department of Public Instruction, Racine Parental Choice Program (RCPC): RPCP Facts and Figures for 2019-20 As of October 2019,” retrieved from DPI: https://dpi.wi.gov/sites/default/files/imce/sms/Choice/Data_and_Reports/2019-20/2019-20_rpcp_facts_and_figures.pdf.
Appendix 1
Appendix 2
Appendix 3
Notes
Valerie Strauss, “What’s wrong with school ‘choice’? Here’s what.” Washington Post, May 20, 2013, https://www.washingtonpost.com/news/answer-sheet/wp/2013/05/20/whats-wrong-with-school-choice-heres-what/
All states except North Dakota and Wyoming have balanced budget requirements. While these requirements vary by strength, most states have strong requirements.
Urban Institute and Brookings Institution, “What are state balanced budget requirements and how do they work?” in Briefing Book: A Citizen’s Guide to the Fascinating (Though Often Complex) Elements of the US Tax System, Tax Policy Center, updated May 2020. Retrieved from: https://www.taxpolicycenter.org/briefing-book/what-are-state-balanced-budget-requirements-and-how-do-they-work
Huriya Jabbar, Carlton J. Fong, Emily Germain, Dongmei Li, Joanna Sanchez, Wei-Ling Sun, and Michelle Devall (2019). The competitive effects of school choice on student achievement: A systematic review. Educational Policy, https://doi.org/10.1177/0895904819874756; Dennis Epple, Richard E. Romano, and Miguel Urquiola (2017). School Vouchers: A Survey of the Economics Literature. Journal of Economic Literature, 55(2), 441–92. http://dx.doi.org/10.1257/jel.20150679; Anna J. Egalite and Patrick J. Wolf (2016). A Review of the Empirical Research on Private School Choice. Peabody Journal of Education, 91(4), 441–454. http://dx.doi.org/10.1080/0161956X.2016.1207436; Anna J. Egalite (2013). Measuring Competitive Effects from School Voucher Programs: A Systematic Review. Journal of School Choice, 7(4), 443–464. http://dx.doi.org/10.1080/15582159.2013.837759
Twenty-seven empirical studies have examined the competitive effects of private school choice programs. Of these, 25 detected that private school choice programs improved the performance of nearby schools, one study estimated a negative effect, and one study could not detect any effect.
EdChoice (2020), The 123s of School Choice: What the Research Says about Private School Choice Programs in America, 2020 edition, retrieved from: https://www.edchoice.org/wp-content/uploads/2020/04/123s-of-SchoolChoice-2020.pdf
EdChoice, “School Choice FAQs,” accessed August 23, 2021 at https://www.edchoice.org/school-choice/faqs/
Of the 76 programs, 65 consist of education savings account programs, school voucher programs, and tax-credit scholarship programs operating in the 32 states plus D.C. and Puerto Rico. The 76 programs include 11 individual tax credit and tax deduction programs and 3 town-tuitioning programs that are not considered in the analysis.
“School Choice in America Dashboard,” EdChoice, last modified March 1, 2021 http://www.edchoice.org/school-choice/school-choice-in-america.
The analysis does not include the Florida A+ Opportunity Scholarships program, which was ruled unconstitutional by the Florida Supreme Court and was discontinued in 2006. The analysis also excludes town tuitioning programs (Maine, New Hampshire, and Vermont), which allows students in towns without district schools at a student’s grade level to use public funds to attend any public or approved private school. Finally, the analysis excludes Nevada’s tax-credit scholarship program. In this program’s third year (FY 2018), the state legislature provided a one-time infusion of $20 million into the program. As only half of available scholarship funds were disbursed that year, this atypical infusion of scholarship funds does not permit a comprehensive analysis of the fiscal effects of the program.
Public school estimates account for the higher cost of serving students with special needs. The analysis assumes that total per-pupil costs for students with special needs is 1.91 times the average per-pupil cost for students without special needs. See Methods section for further details.
As of FY 2014, 34 states have some form of hold harmless or declining enrollment funding arrangement. Michelle J. Atherton and Meghan E. Rubado (2014), Hold Harmless Education Finance Policies in the U.S.: A Survey, Center on Regional Politics, Policy Brief, December, retrieved from: https://williampennfoundation.org/sites/default/files/reports/Hold%20Harmless.pdf
Scafidi (2012) found that some school districts in Georgia that lost students for non-school choice reasons were able to reduce significant costs more than commensurate with their decline in students. However, he observed that some of these districts actually increased administrative costs when they lost students for non-school choice reasons. Benjamin Scafidi, The Fiscal Effects of School Choice Programs on Public School Districts, Friedman Foundation for Educational Choice, retrieved from EdChoice website: https://www.edchoice.org/research/the-fiscal-effects-of-school-choice-programs-on-publicschool-districts
These fiscal benefits for local taxpayers may or may not materialize as direct reductions in their tax bills. Local governments could choose to reduce taxes, but this is often not the case (Hines and Thaler, 1995). If governments do not reduce local property taxes when costs for delivering education decrease, then districts will end up with more resources per student for the fewer students who remain.
James R. Hines and Richard H. Thaler (1995), The Flypaper Effect, Journal of Economic Perspectives, 9(4), pp. 217-226, https://pubs.aeaweb.org/doi/pdfplus/10.1257/jep.9.4.217
Some states provide “hold harmless” funding, which guarantees districts a certain level of funding, or declining enrollment funds intended to protect school districts against large fluctuations in school funding. Michelle J. Atherton and Meghan E. Rubado (2014), Hold Harmless Education Finance Policies in the U.S.: A Survey, Center on Regional Politics, Temple University, policy brief, December, retrieved from: https://sites.temple.edu/corparchives/files/2019/08/HH-Policies-Policy-Brief.pdf
In the context of financing educational choice programs, when shifts in enrollment triggers “hold harmless,” it simultaneously creates a fiscal cost for the state and a fiscal benefit for public schools when a shift in enrollment triggers this funding. For the present analysis, explicitly accounting for this funding source is unnecessary because these funds are included in RS and drop out of equation (3).
Long run estimates reflect all costs such as capital and maintenance costs. These savings could be achieved in the context of a choice program for at least two reasons. First, students who leave public schools via choice programs would reduce need for school building expansions or creation of new school buildings. Second, choice programs may help avoid some private school closures, therefore avoiding a scenario where the public school system would need additional capital to absorb students from closed schools. Even if these scenarios do not play out in full, the long run fiscal effects will likely be close to the upper bound estimates.
Martin F. Lueken (2018), The Fiscal Effects of Tax-Credit Scholarship Programs in the United States, Journal of School Choice, 12(2), pp.181–215, https://dx.doi.org/1 0.1080/15582159.2018.1447725
Benjamin Scafidi’s estimates for average short run fixed and variable costs were based on the experiences of school districts in Georgia that had significant enrollment declines from one year to the next. Scafidi’s analysis found that districts were able to reduce expenditures, commensurate with their decrease in enrollment, in the following categories: instruction, instructional staff support, student support, enterprise operations, and food service. Variable cost estimates in the present analysis are lower than Scafidi’s, who also includes costs for enterprise operations and food service in addition to the costs that comprise my variable cost estimates. Estimates are also below or within the range of what Bifulco and Reback estimate as variable costs for public schools in Albany and Buffalo, and below variable cost estimates used by DeAngelis and Trivitt for Louisiana school districts.
Benjamin Scafidi, The Fiscal Effects of School Choice Programs on Public School Districts s, Friedman Foundation for Educational Choice, retrieved from EdChoice website: https://www.edchoice.org/research/the-fiscal-effects-of-school-choice-programs-on-publicschool-districts; Robert Bifulco and Randall Reback (2014), Fiscal Impacts of Charter Schools: Lessons from New York, Education Finance and Policy 9(1), pp. 86–107, http://dx.doi.org/10.1162/EDFP_a_00121; Corey A. DeAngelis and Julie R. Trivitt (2016). Squeezing the Public School Districts: The Fiscal Effects of Eliminating the Louisiana Scholarship Program (EDRE Working Paper 2016-10). Retrieved from University of Arkansas Department of Education Reform website: http://www.uaedreform.org/downloads/2016/08/squeezing-the-public-school-districts-the-fiscal-effects-of-eliminating-the-louisiana-scholarship-program.pdf
Participation data for some programs were not available for certain groups like students from military families and students in foster care. Because these populations are unique and likely to be quite small, the analysis does not apply adjustments for these students potentially being non-switchers when data were unavailable. This approach is unlikely to significantly affect the results.
Lower bound and upper bound weighted average switcher rate estimates were about 85 percent and 90 percent, respectively. The upper bound estimates are based on students who enrolled in a public school after they applied for an oversubscribed program and lost the lottery. The lower bound estimates include statistical adjustments, previously used by Costrell (2008) for potential bias from lottery winners who did not use the voucher.
Lueken, Martin F. (2020). The Fiscal Impact of K-12 Educational Choice: Using Random Assignment Studies of Private School Choice Programs to Infer Student Switcher Rates, Journal of School Choice, published online at https://www.tandfonline.com/doi/abs/10.1080/15582159.2020.1735863.
Robert M. Costrell (2008), The Fiscal Impact of the Milwaukee Parental Choice Program in Milwaukee and Wisconsin, 1993-2008 (Report #2, School Choice Demonstration Project), SCDP Milwaukee Evaluation, https://cpb-us-e1.wpmucdn.com/wordpressua.uark.edu/dist/9/544/files/2018/10/report-2-the-fiscal-impact-of-the-milwaukee-parental-choice-program-in-milwaukee-and-wisconsin-1993-2008-1tq6aii.pdf.
From the state’s perspective, the break-even switcher rate (BERS) can be estimated by: BERS = C / RS
Martin F. Lueken (2018), The Fiscal Effects of Tax-Credit Scholarship Programs in the United States, Journal of School Choice, 12(2), pp. 181–215, https://dx.doi.org/10.1080/15582159.2018.1447725; Jeffrey Spalding (2014), The School Voucher Audit: Do Publicly Funded Private School Choice Programs Save Money? Friedman Foundation for Educational Choice, retrieved from EdChoice website: http://www.edchoice.org/wp-content/uploads/2015/07/The-School-VoucherAudit-Do-Publicly-Funded-Private-School-Choice-Programs-SaveMoney.pdf
The average variable cost per student for any group of students using special needs vouchers is unique to that group. While this amount will be higher than the overall statewide average variable cost for all students, it can also vary significantly among students with special needs.
If the real costs to educate program participants in the public school system is higher than 1.91 times the per-pupil current expenditures for all students in the public K–12 school system, then the present analysis would underestimate any taxpayer savings. If the real cost is lower, then the analysis would overestimate savings.
These factors are based on a study of educational costs for students with special needs, funded by the U.S. Department of Education. The study was mandated in the 1997 reauthorization of the Individuals with Disabilities Education Act (IDEA). For more information about the project, see American Institutes for Research, Center for Special Education Finance, The Special Education Expenditure Project, accessed July 31, 2018, retrieved from http://www.csef-air.org
For the fiscal analysis of the Ohio Autism Scholarship Program, a cost differential factor of three is used to estimate the reduction in variable costs associated with students with autism. This is based on part of the SEEP study which estimated separate cost differential factors by disability type. Education costs for students with autism were on average three times the cost of students without disabilities.
While this estimated cost may differ from the state’s cost, it likely reflects the total cost for special education services for students with autism. The estimates used in the present analysis are somewhat lower than cost estimates for autistic children ages 6–17 reported by Buescher et al. (2014), who estimated that the average annual per capita cost of special education for children with autism in 2011 was £27,961 (British pounds-sterling). After converting to 2018 U.S. dollars, this cost becomes $49,944 per child.
Jay G. Chambers, Jamie Shkolnik, and Maria Perez (2003), Total Expenditures for Students with Disabilities, 1999-2000: Spending Variation by Disability [Special Education Expenditure Project (SEEP), Report 5]: retrieved from American Institutes for Research website: https://www.air.org/sites/default/files/SEEP5-Total-Expenditures.pdf.
Ariane V. S. Buescher, Zuleyha Cidav, Martin Knapp, and David S. Mandell (2014). Costs of Autism Spectrum Disorders in the United Kingdom and the United States. JAMA Pediatrics, 168(8):721–728, https://jamanetwork.com/journals/jamapediatrics/article-abstract/1879723.
U.S. Department of Education, EDFacts Data Warehouse (EDW): “IDEA Part B Child Count and Educational Environments Collection,” 2017-18, retrieved from https://www2.ed.gov/programs/osepidea/618-data/state-level-data-files/index.html; U.S. Department of Education, National Center for Education Statistics, Common Core of Data (CCD), “Local Education Agency (School District) Universe Survey”, 2017-18 v.1a; “State Nonfiscal Public Elementary/Secondary Education Survey”, 2017-18 v.1a.
Alabama disbursed more than $24 million in tax credits for contributions to SGOs by taxpayers during the first year of the program while just 20 students enrolled that year. This enormous imbalance is unusual for tax-credit scholarship programs and has not smoothed out yet over subsequent years of Alabama’s program.
Participation in the program during the program’s first three years was low relative to many other programs while donations for scholarship were frontloaded, leading to the program generating a cumulative net fiscal cost for taxpayers over this period. Through 2018, SGOs awarded nearly $2.2 million in scholarships to 620 students while the state disbursed $6.4 million in tax credits for $9.2 million in taxpayer donations to SGOs.
Martin Lueken (2021), “The Fiscal Effects of the Kansas Tax Credit for Low Income Students,” Kansas Policy Institute, March 1, https://kansaspolicy.org/the-fiscal-effects-of-the-kansas-tax-credit-for-low-income-students-scholarship-program/.
This separate analysis used school finance data from the Kansas Department of Education and similar methodology as the present paper.
An analysis that isolates the fiscal effects of programs on state taxpayers would require incorporating each state’s school funding formula, a Herculean task for an analysis that is national in scope. This endeavor is left for future research.
Corey A. DeAngelis and Patrick J. Wolf (2019), Private School Choice and Crime: Evidence from Milwaukee, Social Science Quarterly, 100(6), pp. 2302–2315, https://doi.org/10.1111/ssqu.12698; Corey DeAngelis and Angela K. Dills (2020), The effects of school choice on mental health, School Effectiveness and School Improvement, published online December 3, 2020, https://doi.org/10.1080/09243453.2020.1846569
M. Danish Shakeel, Kaitlin P. Anderson, and Patrick J. Wolf (2016). The Participant Effects of Private School Vouchers across the Globe: A Meta-Analytic and Systematic Review (EDRE Working Paper 2016-07), https://dx.doi.org/10.2139/ssrn.2777633; Leesa M. Foreman (2017), Educational Attainment Effects of Public and Private School Choice, Journal of School Choice, 11(4), pp. 642–654, https://dx.doi.org/10.1080/15582159.2017.1395619; Dennis Epple, Richard E. Romano, and Miguel Urquiola (2017), School Vouchers: A Survey of the Economics Literature, Journal of Economic Literature, 55(2), p. 441, https://dx.doi.org/10.1257/jel.20150679; Corey A. DeAngelis (2017), Do Self-Interested Schooling Selections Improve Society? A Review of the Evidence, Journal of School Choice, 11(4), pp. 546–558, https://dx.doi.org/10.1080/15582159.2017.1395615
Acknowledgments
This paper benefited immensely from very helpful reviews by Corey DeAngelis, Angela Dills, Mike Podgursky, Ben Scafidi, and Aaron Smith. I appreciate additional helpful feedback and formatting assistance from Drew Catt. I’m grateful for Jen Wagner’s deft copyediting. Special thanks to Jacob Vinson and Michael Davey for their amazing work (and patience) in designing the numerous tables and figures, and for their efforts laying out the report. Any errors are attributed to the author.
